Oct 1, 2008 - 7.1.4.12 Constant Heap Occupation Ratio . ... memory caches or garbage collectors when modeling performance is hardly prudent. ... designed to document how sharing occurs in various modes of service composition, what are the ...... Instead, we see that accesses to odd cache lines are approximately.
Project Deliverable D3.3 Resource Usage Modeling Project name: Contract number: Project deliverable: Author(s): Work package: Work package leader: Planned delivery date: Delivery date: Last change: Version number:
Q-ImPrESS FP7-215013 D3.3: Resource Usage Modeling Vlastimil Babka, Lubom´ır Bulej, Martin Dˇeck´y, Johan Kraft, Peter Libiˇc, Luk´asˇ Marek, Cristina Seceleanu, Petr T˚uma WP3 PMI February 1, 2009 February 2, 2009 February 3, 2009 2.0
Abstract The Q-ImPrESS project deals with modeling of quality attributes in service oriented architectures, which generally consist of interacting components that share resources. This report analyzes the degree to which resource sharing of various omnipresent implicitly shared resources (e.g. memory content caches, memory buses, etc.) affect various quality attributes. The main goal is to identify the resources whose sharing affects the quality attributes significantly, and next propose methods for modeling of these effects.
Keywords resource sharing, quality attributes, modeling
Project Deliverable D3.3: Resource Usage Modeling
Version: 2.0
Last change: February 3, 2009
Revision history Version 1.0 2.0
Change Date 01-10-2008 02-02-2009
Author(s) CUNI, MDU CUNI
c Q-ImPrESS Consortium
Description Initial version Extended version
Dissemination Level: public
Page 2 / 210
Project Deliverable D3.3: Resource Usage Modeling
Version: 2.0
Last change: February 3, 2009
Contents 1
Introduction
2
Experiment Design 2.1 Experiment Workloads . . . . . . . . . . . . . . . . . . . . . . . . . . . . . . . . . . . . . . . . 2.2 Composition Scenarios . . . . . . . . . . . . . . . . . . . . . . . . . . . . . . . . . . . . . . . . 2.3 Quality Attributes . . . . . . . . . . . . . . . . . . . . . . . . . . . . . . . . . . . . . . . . . . .
9 9 9 11
3
Shared Resources 3.1 Considered Resources . . . . . . . . . . . . . . . . . . . 3.2 Experimental Platforms . . . . . . . . . . . . . . . . . . . 3.2.1 Dell PowerEdge 1955 . . . . . . . . . . . . . . . . 3.2.2 Dell PowerEdge SC1435 . . . . . . . . . . . . . . 3.2.3 Dell Precision 620 MT . . . . . . . . . . . . . . . 3.2.4 Dell Precision 340 . . . . . . . . . . . . . . . . . 3.3 Resource: Example Resource . . . . . . . . . . . . . . . 3.3.1 Platform Details . . . . . . . . . . . . . . . . . . . 3.3.1.1 Platform Intel Server . . . . . . . . . . . 3.3.1.2 Platform AMD Server . . . . . . . . . . 3.3.2 Platform Investigation . . . . . . . . . . . . . . . . 3.3.2.1 Experiment: The name of the experiment 3.3.3 Composition Scenario . . . . . . . . . . . . . . .
4
5
7
. . . . . . . . . . . . .
. . . . . . . . . . . . .
. . . . . . . . . . . . .
. . . . . . . . . . . . .
. . . . . . . . . . . . .
. . . . . . . . . . . . .
. . . . . . . . . . . . .
. . . . . . . . . . . . .
. . . . . . . . . . . . .
. . . . . . . . . . . . .
. . . . . . . . . . . . .
. . . . . . . . . . . . .
. . . . . . . . . . . . .
. . . . . . . . . . . . .
. . . . . . . . . . . . .
. . . . . . . . . . . . .
12 12 13 13 14 14 14 15 15 15 16 16 16 17
Processor Execution Core 4.1 Resource: Register Content . . . . . . . . . . . . . . . . . . . . . . . 4.2 Resource: Branch Predictor . . . . . . . . . . . . . . . . . . . . . . . 4.2.1 Platform Details . . . . . . . . . . . . . . . . . . . . . . . . . 4.2.1.1 Platform Intel Server . . . . . . . . . . . . . . . . . 4.2.1.2 Platform AMD Server . . . . . . . . . . . . . . . . 4.2.2 Sharing Effects . . . . . . . . . . . . . . . . . . . . . . . . . 4.2.3 Pipelined Composition . . . . . . . . . . . . . . . . . . . . . 4.2.4 Artificial Experiments . . . . . . . . . . . . . . . . . . . . . . 4.2.4.1 Experiment: Indirect Branch Misprediction Overhead 4.2.5 Modeling Notes . . . . . . . . . . . . . . . . . . . . . . . . .
. . . . . . . . . .
. . . . . . . . . .
. . . . . . . . . .
. . . . . . . . . .
. . . . . . . . . .
. . . . . . . . . .
. . . . . . . . . .
. . . . . . . . . .
. . . . . . . . . .
. . . . . . . . . .
. . . . . . . . . .
. . . . . . . . . .
. . . . . . . . . .
. . . . . . . . . .
. . . . . . . . . .
18 18 18 19 19 19 19 20 20 20 27
System Memory Architecture 5.1 Common Workloads . . . . . . . . . . . . . . . . . . . . . . . . 5.2 Resource: Address Translation Buffers . . . . . . . . . . . . . . 5.2.1 Platform Details . . . . . . . . . . . . . . . . . . . . . . 5.2.1.1 Platform Intel Server . . . . . . . . . . . . . . 5.2.1.2 Platform AMD Server . . . . . . . . . . . . . 5.2.2 Platform Investigation . . . . . . . . . . . . . . . . . . . 5.2.2.1 Miss Penalties . . . . . . . . . . . . . . . . . 5.2.2.2 Experiment: L1 DTLB miss penalty . . . . . . 5.2.2.3 Experiment: DTLB0 miss penalty, Intel Server
. . . . . . . . .
. . . . . . . . .
. . . . . . . . .
. . . . . . . . .
. . . . . . . . .
. . . . . . . . .
. . . . . . . . .
. . . . . . . . .
. . . . . . . . .
. . . . . . . . .
. . . . . . . . .
. . . . . . . . .
. . . . . . . . .
. . . . . . . . .
. . . . . . . . .
28 28 32 33 33 34 34 35 35 37
c Q-ImPrESS Consortium
Dissemination Level: public
. . . . . . . . . . . . .
. . . . . . . . . . . . .
. . . . . . . . . . . . .
. . . . . . . . . . . . .
. . . . . . . . .
. . . . . . . . . . . . .
. . . . . . . . .
. . . . . . . . .
Page 3 / 210
Project Deliverable D3.3: Resource Usage Modeling
Version: 2.0
5.3
5.4
Last change: February 3, 2009
5.2.2.4 Experiment: L2 DTLB miss penalty, AMD Server . . . . . . . . . . . . . . . . 5.2.2.5 Experiment: Extra translation caches . . . . . . . . . . . . . . . . . . . . . . 5.2.2.6 Experiment: L1 ITLB miss penalty . . . . . . . . . . . . . . . . . . . . . . . . 5.2.2.7 Experiment: L2 ITLB miss penalty, AMD Server . . . . . . . . . . . . . . . . . 5.2.3 Pipelined Composition . . . . . . . . . . . . . . . . . . . . . . . . . . . . . . . . . . . 5.2.4 Artificial Experiments . . . . . . . . . . . . . . . . . . . . . . . . . . . . . . . . . . . . 5.2.4.1 Experiment: DTLB sharing . . . . . . . . . . . . . . . . . . . . . . . . . . . . 5.2.4.2 Experiment: ITLB sharing . . . . . . . . . . . . . . . . . . . . . . . . . . . . 5.2.5 Parallel Composition . . . . . . . . . . . . . . . . . . . . . . . . . . . . . . . . . . . . 5.2.6 Artificial Experiments . . . . . . . . . . . . . . . . . . . . . . . . . . . . . . . . . . . . 5.2.6.1 Experiment: Translation Buffer Invalidation Overhead . . . . . . . . . . . . . . 5.2.7 Modeling Notes . . . . . . . . . . . . . . . . . . . . . . . . . . . . . . . . . . . . . . . Resource: Memory Content Caches . . . . . . . . . . . . . . . . . . . . . . . . . . . . . . . . 5.3.1 Platform Details . . . . . . . . . . . . . . . . . . . . . . . . . . . . . . . . . . . . . . . 5.3.1.1 Platform Intel Server . . . . . . . . . . . . . . . . . . . . . . . . . . . . . . . 5.3.1.2 Platform AMD Server . . . . . . . . . . . . . . . . . . . . . . . . . . . . . . 5.3.2 Sharing Effects . . . . . . . . . . . . . . . . . . . . . . . . . . . . . . . . . . . . . . . 5.3.3 Platform Investigation . . . . . . . . . . . . . . . . . . . . . . . . . . . . . . . . . . . . 5.3.3.1 Experiment: Cache line sizes . . . . . . . . . . . . . . . . . . . . . . . . . . 5.3.3.2 Experiment: Streamer prefetcher, Intel Server . . . . . . . . . . . . . . . . . 5.3.3.3 Experiment: Cache set indexing . . . . . . . . . . . . . . . . . . . . . . . . . 5.3.3.4 Miss Penalties . . . . . . . . . . . . . . . . . . . . . . . . . . . . . . . . . . 5.3.3.5 Experiment: L1 cache miss penalty . . . . . . . . . . . . . . . . . . . . . . . 5.3.3.6 Experiment: L2 cache miss penalty . . . . . . . . . . . . . . . . . . . . . . . 5.3.3.7 Experiment: L1 and L2 cache random miss penalty, AMD Server . . . . . . . . 5.3.3.8 Experiment: L2 cache miss penalty dependency on cache line set, Intel Server 5.3.3.9 Experiment: L3 cache miss penalty, AMD Server . . . . . . . . . . . . . . . . 5.3.4 Pipelined Composition . . . . . . . . . . . . . . . . . . . . . . . . . . . . . . . . . . . 5.3.5 Artificial Experiments . . . . . . . . . . . . . . . . . . . . . . . . . . . . . . . . . . . . 5.3.5.1 Experiment: L1 data cache sharing . . . . . . . . . . . . . . . . . . . . . . . 5.3.5.2 Experiment: L2 cache sharing . . . . . . . . . . . . . . . . . . . . . . . . . . 5.3.5.3 Experiment: L3 cache sharing, AMD Server . . . . . . . . . . . . . . . . . . . 5.3.5.4 Experiment: L1 instruction cache sharing . . . . . . . . . . . . . . . . . . . . 5.3.6 Real Workload Experiments: Fourier Transform . . . . . . . . . . . . . . . . . . . . . . 5.3.6.1 Experiment: FFT sharing data caches . . . . . . . . . . . . . . . . . . . . . . 5.3.7 Parallel Composition . . . . . . . . . . . . . . . . . . . . . . . . . . . . . . . . . . . . 5.3.8 Artificial Experiments . . . . . . . . . . . . . . . . . . . . . . . . . . . . . . . . . . . . 5.3.8.1 Experiment: Shared variable overhead . . . . . . . . . . . . . . . . . . . . . 5.3.8.2 Experiment: Cache bandwidth limit . . . . . . . . . . . . . . . . . . . . . . . 5.3.8.3 Experiment: Cache bandwidth sharing . . . . . . . . . . . . . . . . . . . . . 5.3.8.4 Experiment: Shared cache prefetching . . . . . . . . . . . . . . . . . . . . . 5.3.9 Real Workload Experiments: Fourier Transform . . . . . . . . . . . . . . . . . . . . . . 5.3.9.1 Experiment: FFT sharing data caches . . . . . . . . . . . . . . . . . . . . . . 5.3.10 Real Workload Experiments: SPEC CPU2006 . . . . . . . . . . . . . . . . . . . . . . . 5.3.10.1 Experiment: SPEC CPU2006 sharing data caches . . . . . . . . . . . . . . . Resource: Memory Buses . . . . . . . . . . . . . . . . . . . . . . . . . . . . . . . . . . . . . . 5.4.1 Platform Details . . . . . . . . . . . . . . . . . . . . . . . . . . . . . . . . . . . . . . . 5.4.1.1 Platform Intel Server . . . . . . . . . . . . . . . . . . . . . . . . . . . . . . . 5.4.1.2 Platform AMD Server . . . . . . . . . . . . . . . . . . . . . . . . . . . . . . 5.4.2 Sharing Effects . . . . . . . . . . . . . . . . . . . . . . . . . . . . . . . . . . . . . . . 5.4.3 Parallel Composition . . . . . . . . . . . . . . . . . . . . . . . . . . . . . . . . . . . . 5.4.4 Artificial Experiments . . . . . . . . . . . . . . . . . . . . . . . . . . . . . . . . . . . .
c Q-ImPrESS Consortium
Dissemination Level: public
. . . . . . . . . . . . . . . . . . . . . . . . . . . . . . . . . . . . . . . . . . . . . . . . . . . .
38 40 44 47 47 48 48 51 54 54 54 58 58 60 60 61 62 62 63 66 68 70 70 76 77 84 86 88 89 89 90 91 93 94 94 100 100 100 102 105 109 116 116 121 121 124 124 124 124 125 125 125
Page 4 / 210
Project Deliverable D3.3: Resource Usage Modeling
Version: 2.0
5.4.4.1 5.4.4.2 6
Last change: February 3, 2009
Experiment: Memory bus bandwidth limit . . . . . . . . . . . . . . . . . . . . . 125 Experiment: Memory bus bandwidth limit . . . . . . . . . . . . . . . . . . . . . 125
Operating System 6.1 Resource: File Systems . . . . . . . . . . . . . . . . . . . . . . . . . . . . . . . . . 6.1.1 Platform Details . . . . . . . . . . . . . . . . . . . . . . . . . . . . . . . . . 6.1.1.1 Platform RAID Server . . . . . . . . . . . . . . . . . . . . . . . . 6.1.2 Sharing Effects . . . . . . . . . . . . . . . . . . . . . . . . . . . . . . . . . 6.1.3 General Composition . . . . . . . . . . . . . . . . . . . . . . . . . . . . . . 6.1.4 Artificial Experiments . . . . . . . . . . . . . . . . . . . . . . . . . . . . . . 6.1.4.1 Sequential access . . . . . . . . . . . . . . . . . . . . . . . . . . 6.1.4.2 Experiment: Concurrent reading of individually written files . . . . . 6.1.4.3 Experiment: Individual reading of concurrently written files . . . . . 6.1.4.4 Experiment: Concurrent reading of concurrently written files . . . . 6.1.4.5 Random access . . . . . . . . . . . . . . . . . . . . . . . . . . . 6.1.4.6 Experiment: Concurrent random reading of individually written files 6.1.4.7 Experiment: Individual random reading of concurrently written files .
. . . . . . . . . . . . .
. . . . . . . . . . . . .
. . . . . . . . . . . . .
. . . . . . . . . . . . .
. . . . . . . . . . . . .
. . . . . . . . . . . . .
. . . . . . . . . . . . .
128 128 128 128 129 129 129 131 132 133 133 136 136 136
Virtual Machine 7.1 Resource: Collected Heap . . . . . . . . . . . . . . . . . . . . . . . . . . 7.1.1 Platform Details . . . . . . . . . . . . . . . . . . . . . . . . . . . . 7.1.1.1 Platform Desktop . . . . . . . . . . . . . . . . . . . . . . 7.1.1.2 Platform Intel Server . . . . . . . . . . . . . . . . . . . . 7.1.1.3 Platform AMD Server . . . . . . . . . . . . . . . . . . . 7.1.2 Sharing Effects . . . . . . . . . . . . . . . . . . . . . . . . . . . . 7.1.3 General Composition . . . . . . . . . . . . . . . . . . . . . . . . . 7.1.4 Artificial Experiments: Overhead Dependencies . . . . . . . . . . . 7.1.4.1 Experiment: Object lifetime . . . . . . . . . . . . . . . . 7.1.4.2 Experiment: Heap depth . . . . . . . . . . . . . . . . . . 7.1.4.3 Experiment: Heap size . . . . . . . . . . . . . . . . . . . 7.1.4.4 Varying Allocation Speed . . . . . . . . . . . . . . . . . 7.1.4.5 Experiment: Allocation speed with object lifetime . . . . . 7.1.4.6 Experiment: Allocation speed with heap depth . . . . . . 7.1.4.7 Experiment: Allocation speed with heap size . . . . . . . 7.1.4.8 Varying Maximum Heap Size . . . . . . . . . . . . . . . 7.1.4.9 Experiment: Maximum heap size with object lifetime . . . 7.1.4.10 Experiment: Maximum heap size with heap depth . . . . 7.1.4.11 Experiment: Maximum heap size with heap size . . . . . 7.1.4.12 Constant Heap Occupation Ratio . . . . . . . . . . . . . 7.1.4.13 Experiment: Constant heap occupation with object lifetime 7.1.4.14 Experiment: Constant heap occupation with heap depth . 7.1.4.15 Experiment: Constant heap occupation with heap size . . 7.1.5 Artificial Experiments: Workload Compositions . . . . . . . . . . . . 7.1.5.1 Experiment: Allocation speed with composed workload . . 7.1.5.2 Experiment: Heap size with composed workload . . . . .
. . . . . . . . . . . . . . . . . . . . . . . . . .
. . . . . . . . . . . . . . . . . . . . . . . . . .
. . . . . . . . . . . . . . . . . . . . . . . . . .
. . . . . . . . . . . . . . . . . . . . . . . . . .
. . . . . . . . . . . . . . . . . . . . . . . . . .
. . . . . . . . . . . . . . . . . . . . . . . . . .
. . . . . . . . . . . . . . . . . . . . . . . . . .
139 139 140 140 140 140 141 141 141 141 146 146 153 153 157 159 162 162 169 169 169 178 178 178 184 184 188
8
Predicting the Impact of Processor Sharing on Performance 8.1 Simulation Example . . . . . . . . . . . . . . . . . . . . . . . . . . . . . . . . . . . . . . . . . . 8.2 Simulation Optimization . . . . . . . . . . . . . . . . . . . . . . . . . . . . . . . . . . . . . . . . 8.3 Generated Statistics Report for Performance Analysis . . . . . . . . . . . . . . . . . . . . . . . .
193 193 194 196
9
Conclusion
201
7
c Q-ImPrESS Consortium
Dissemination Level: public
. . . . . . . . . . . . . . . . . . . . . . . . . .
. . . . . . . . . . . . . . . . . . . . . . . . . .
. . . . . . . . . . . . . . . . . . . . . . . . . .
. . . . . . . . . . . . . . . . . . . . . . . . . .
. . . . . . . . . . . . . . . . . . . . . . . . . .
Page 5 / 210
Project Deliverable D3.3: Resource Usage Modeling
Version: 2.0
Last change: February 3, 2009
Terminology
206
References
208
c Q-ImPrESS Consortium
Dissemination Level: public
Page 6 / 210
Project Deliverable D3.3: Resource Usage Modeling
Version: 2.0
Last change: February 3, 2009
Chapter 1
Introduction The Q-ImPrESS project deals with modeling of quality attributes, such as performance and reliability, in service oriented architectures. Since the project understands the service oriented architectures in terms of interacting components that share resources, modeling of quality attributes necessitates modeling of both the components and the resources. To achieve reasonable complexity, common approaches to modeling choose to abstract from certain resources, especially resources associated with service platform internals such as the memory caches of a processor or the garbage collector of a virtual machine. The influence of such resources on quality attributes, however, tends to change, bringing some previously secondary resources to prominence – when advances in memory caches or garbage collectors are behind major performance gains of processors or virtual machines, abstracting away from memory caches or garbage collectors when modeling performance is hardly prudent. The role of task T3.3 is to analyze the degree to which resource sharing affects various quality attributes, focusing on resources that are not yet considered in approaches to modeling planned for the Q-ImPrESS project. The task proceeds by first identifying the resources whose sharing affects the attributes, and next developing methods for adjustment of the prediction models. Task T3.3 is complemented by task T3.1, which defines the quality attributes and prediction models considered in the Q-ImPrESS project. Both the attributes and the models are described in deliverable D3.1 [33], which analyzes the strengths and weaknesses of the individual prediction models with respect to support of the chosen quality attributes. Task T3.3 is planned both for an early phase of the Q-ImPrESS project, when the initial experiments and initial analyses are done, and for a late phase of the Q-ImPrESS project, when the validation and evaluation take place. The early work culminates with deliverable D3.3, a report describing the experiments that quantify the impact of resource sharing on quality attributes and documenting the choice of resources to model. The report is structured as follows: •
In Chapter 2, the design of the experiments used to assess the impact of resource sharing on quality attributes is outlined. Two major aspects of the design are the choice of workloads, which is made with the goal of separating individual resource demand factors, and the composition of workloads, which is made with the goal of reflecting service composition. Two major scenarios of service composition are defined – the pipelined composition, where components are invoked sequentially, and the parallel composition, where components are invoked concurrently.
•
In Chapter 3, the shared resources are introduced. Since the following chapters, which focus on specific resources, use a common template, this template is also introduced, giving the basic properties of the platforms used for the resource sharing experiments as the template content.
•
Chapters 4, 5, 6 and 7 give the descriptions and results of the resource sharing experiments for specific resources. For each shared resource, an overview of its principal features is given first, followed by the details of its implementation on the experimental platforms. The resource sharing experiments come next, designed to document how sharing occurs in various modes of service composition, what are the typical and maximum effects of sharing and what is the workload under which such effects are observed.
c Q-ImPrESS Consortium
Dissemination Level: public
Page 7 / 210
Project Deliverable D3.3: Resource Usage Modeling
Version: 2.0
Last change: February 3, 2009
•
In Chapter 8, a related tool for predicting impact of processor sharing on response time is presented, to illustrate one of the approaches to modeling planned for the Q-ImPrESS project.
•
In Chapter 9, an overall conclusion closes the report.
The resource sharing experiments describe results of complex interactions among multiple resources, with the interactions only partially observable and the resources only partially documented. Besides the interpretation offered here, the results are therefore open to multiple additional interpretations, including interpretations where results are attributed to errors in the experiment. Although utmost care was taken to provide correct analysis, this disclaimer should be remembered together with limits that external observation of complex interactions necessarily has.
c Q-ImPrESS Consortium
Dissemination Level: public
Page 8 / 210
Project Deliverable D3.3: Resource Usage Modeling
Version: 2.0
Last change: February 3, 2009
Chapter 2
Experiment Design The experiments used to analyze the degree to which resource sharing affects various quality attributes follow a straightforward construction. When two workloads are executed first in isolation and then composed together over a resource, the difference in the quality attributes observed during the experiment is necessarily due to sharing of the resource. Obviously critical in this construction is the choice of workloads and the manner of composition.
2.1 Experiment Workloads The workload choice is driven by two competing motivations. For the experimental results to be practically relevant, the workloads should exercise resources in the same patterns as the practical services do. However, for the experimental results to be analyzable, the workloads should exercise as few resources as possible in as simple patterns as possible. Since the Q-ImPrESS project plan counts on modeling the effects of resource sharing, having analyzable results is essential. For this reason, the resource sharing experiments rely on artificial workloads, constructed specifically to exercise a particular resource in a particular pattern. Where exercising a particular resource alone is not possible, as few additional resources as possible are exercised in as simple patterns as possible. The experimental results for the artificial workloads form the centerpiece of the report. To make sure that the experimental results do not lose their practical relevance, practical workloads are used to check whether the effects of resource sharing under practical workloads resemble a combination of the effects under artificial workloads. The experimental results for the practical workloads, however, are not considered essential for the report, because the Q-ImPrESS project plan allocates a separate additional task for validation on practical workloads.
2.2 Composition Scenarios The Q-ImPrESS project plan assumes that a service architecture consists of components interacting through connectors, where components and connectors can share resources. The workload composition follows two distinct scenarios in which such sharing occurs: Pipelined composition The pipelined composition scenario covers a situation where the invocations coming from the outside pass through the composed components sequentially. The scenario describes common design patterns such as nesting of components, where one component invokes another to serve an outside request. The pipelined composition scenario is distinct in that multiple components access shared resources sequentially, one after another. A single component thus executes with complete control of the shared resources, other components access the resources only when this component suspends its execution. In such a scenario, resource sharing impacts the quality attributes mostly due to state change overhead, incurred when one component stops and another starts accessing a resource. Examples of such overhead are flushing and populating of caches when components switch on a virtual memory resource, or positioning of disk heads when components switch on a file system resource. c Q-ImPrESS Consortium
Dissemination Level: public
Page 9 / 210
Project Deliverable D3.3: Resource Usage Modeling
Version: 2.0
Last change: February 3, 2009
Parallel composition The parallel composition scenario covers a situation where the invocations coming from the outside pass through the composed components concurrently. The scenario describes common design patterns such as pooling of components, where multiple components are invoked to serve multiple outside requests. In parallel composition, multiple components access shared resources concurrently, all together. No single component thus executes with complete control of any shared resource. In such a scenario, resource sharing impacts the quality attributes mostly due to capacity limitations, encountered when multiple components consume a resource. Examples of such limitations are conflict and capacity evictions in caches when components share a virtual memory resource, or allocation of disk blocks when components share a file system resource. Note that a combination of the two composition scenarios can also occur in practice. In that case, the information on how resource sharing influences quality attributes needs to be adjusted accordingly. In this respect, the two composition scenarios identified in this report are not meant to be exhaustive, but rather to represent well defined cases of service composition that lead to resource sharing. An example of a particularly frequent combination is representing a service that handles multiple clients concurrently as a parallel composition of services that handle a single client, each service being a pipelined composition of individual components. The workload composition in the resource sharing experiments reflects the way in which performance models are populated with quality attributes gathered by isolated benchmarks. The Q-ImPrESS project plan assumes that the service architecture is captured by a service architecture model, which contains quality annotations describing the quality attributes of the individual components and connectors [32]. To predict the quality attributes of the service architecture from the quality attributes of the individual components and connectors, prediction models are generated from the service architecture model. When solved, the prediction models take the quality attributes of the components and connectors as their input and produce predictions of the quality attributes of the service architecture as their output. The outlined application of the prediction models requires knowledge of the quality attributes of the components and connectors. These quality attributes can be obtained by various approaches, including estimates, monitoring and benchmarking. •
Estimates can serve well at early development stages, when the service implementation does not exist and little information is available. Early estimates are relatively cheap to obtain and imprecise.
•
Monitoring can serve well at late development stages, when the service implementation exists and the running service can be monitored. Late monitoring is relatively expensive to obtain and precise.
•
Benchmarking is of particular importance as a compromise between estimates and monitoring when the service implementation partially exists. It is more precise than estimates since the quality attributes of the implemented components and connectors can be measured precisely. It is less expensive than monitoring since the implemented components and connectors can be measured in isolation.
The use of benchmarking is hindered by the fact that the quality attributes of the components and connectors are not constant. Instead, they change with the execution context – the same component will perform better with more available memory or faster processor speed, the same connector will perform better with more network bandwidth or smaller message sizes. Benchmarking, however, only captures the quality attributes in a single execution context, typically isolated or otherwise artificial. The context in which the components and connectors execute differs between an isolated benchmark and a composed service. Notably, resources that were only used by a single component in the benchmark can be used by multiple components in the service. In this, the changes in quality attributes correspond to the changes in the experimental results between the isolated execution of each workload and the composed execution of multiple workloads. When considering combinations of the two composition scenarios, special attention must be paid to resource sharing due to context switching in multitasking operating systems. As in the pipelined scenario, context switching implies interleaved execution, but it does not quite match the scenario since the interleaving happens at arbitrary c Q-ImPrESS Consortium
Dissemination Level: public
Page 10 / 210
Project Deliverable D3.3: Resource Usage Modeling
Version: 2.0
Last change: February 3, 2009
points in time. As in the parallel scenario, context switching implies concurrent execution, but it does not quite match the scenario since the concurrency is only coarse grained. The two composition scenarios, however, can still represent context switching well. The argument is based on the assumption that the observed effect of resource sharing has to be large enough and frequent enough if it is to influence the prediction precision significantly. Obviously, the observed effect is unlikely to affect the prediction precision at the component level if the combination of its size and frequency is below the scale of the component quality attributes. There are two major categories of context switches in multitasking operating systems. Their properties can be characterized as follows: Due to Scheduler Interrupts These context switches happen at regular intervals and involve resources necessarily used by all tasks, such as the resources described in Section 4. The details of the resource sharing effects for these resources suggest that context switches due to scheduler interrupts do not occur frequently enough to amplify the size of the resource sharing effects significantly. For example, for the platforms considered in the report, the effects of sharing a memory cache can only amount to some millions of cycles per context switch, and that in the extremely unlikely case of a workload that uses the entire cache with no prefetching possible. Context switches due to scheduler interrupts typically happen only once some tens or hundreds of millions of cycles, meaning that the effects of sharing a memory cache can only represent units of percents of the execution time, and that only for extremely unlikely workloads. Due to Resource Blocking These context switches happen at arbitrary times and additionally involve the blocking resource. The operation times and the resource sharing effects related to the blocking resource tend to be larger than the resource sharing effects related to the other resources. The blocking resource therefore dictates behavior, pretty much the same as in the parallel scenario, or even in the interleaved scenario. For example, for the platforms considered in the report, the operation times and the effects of sharing a file system are in the order of milliseconds per operation. As noted above, the effects of sharing a memory cache can only ammount to some millions of cycles and therefore some milliseconds per context switch for extremely unlikely workloads, meaning that the effects of sharing a file system should prevail.
2.3 Quality Attributes The Q-ImPrESS project plan considers a wide range of quality attributes and the associated quantifying metrics, described in [33]. The resource sharing experiments, however, can only collect information on those attributes and those metrics that are directly measurable. Where performance is concerned, these are: •
Responsivity as an attribute that describes temporal behavior of a service from the point of view of a single client, quantified as response time and derivative statistics of response time including mean response time and response time jitter.
•
Capacity as an attribute that describes temporal behavior of a service from the point of view of the overall architecture, quantified as throughput and utilization.
•
Scalability as an attribute that describes changes in responsivity and capacity depending on the scale of the workload or the scale of the platform.
c Q-ImPrESS Consortium
Dissemination Level: public
Page 11 / 210
Project Deliverable D3.3: Resource Usage Modeling
Version: 2.0
Last change: February 3, 2009
Chapter 3
Shared Resources The usual understanding of shared resources is rather broad in scope, requiring an additional selection of shared resources of concern to the Q-ImPrESS project. The selection helps narrow down the scope of the shared resources considered, avoiding the danger of delivering shallow results spread over too many types of shared resources. Besides this, the selection also clearly defines the types of shared resources to consider, making it possible to show that the delivered results are complete with respect to the selection criteria. The selection of shared resources singles out resources that are: •
Shared implicitly, by the fact of deploying components together. Resources that are shared explicitly in the service architecture model are likely to be also modeled explicitly in the prediction models created by transformations from the service architecture model, and therefore do not need to be considered by separate resource models. For example, this criterion would include memory content caches, because components share the caches by virtue of sharing the processor, rather than by declaring explicit connection to the caches and performing explicit operations with caches.
•
Intended to serve other primary purpose than scheduling. Resources whose primary purpose is scheduling are better modeled in the prediction models than in separate resource models, since their function is pivotal to the functioning of the prediction models. For example, this criterion would exclude database connection pools, because components use the pools primarily to schedule access to database, rather than to perform operations that would have scheduling as its side effect.
3.1 Considered Resources The list of resources that match this classification includes:
Processor Execution Core Resources The processor execution core is likely to exhibit significant resource sharing effects when thread level parallelism is supported directly by the hardware.
System Memory Architecture Resources Translation buffers are likely to exhibit significant resource sharing effects in services with large address space coverage requirements. Memory caches are likely to exhibit significant resource sharing effects in services with localized memory access patterns. Memory buses are likely to exhibit significant resource sharing effects in services with randomized memory access patterns and in services with coherency requirements. c Q-ImPrESS Consortium
Dissemination Level: public
Page 12 / 210
Project Deliverable D3.3: Resource Usage Modeling
Version: 2.0
Last change: February 3, 2009
Operating System Resources File system
is likely to exhibit significant resource sharing effects in services with intensive file system access.
Virtual Machine Resources Collected heap
is likely to exhibit significant resource sharing effects in services with complex data structures.
3.2 Experimental Platforms This section contains description of the computing platforms that were used for running the resource sharing experiments. The range of different computing platforms in use today is extremely large and even minute configuration details can influence the experiment results. It is therefore not practical to attempt a comprehensive coverage of the computing platforms in the resource sharing experiments. Instead, we have opted for thoroughly documenting several common computing platforms that were used for running the resource sharing experiments, so that the applicability of the results to other computing platforms can be assessed. In line with the overall orientation of the Q-ImPrESS project, we have selected typical high-end desktop and low-end server platforms with both Intel and AMD processors: •
We have considered only the internal processor caches, as opposed to the less common external caches.
•
We have considered only SMP multiprocessor systems, as opposed to the less common NUMA multiprocessor systems.
•
We have considered only systems with separate processor cores, as opposed to the less common systems with processor cores shared by multithreading or hyperthreading.
The description of the hardware platforms is derived mostly from vendor documentation. The detailed information about the processor, such as the cache sizes and associativity, is obtained by the x86info tool [22], which gathers the information using the CPUID instruction ([3, page 3-180] for Intel-based and [11] for AMD-based platforms), and confirmed by our experiments. Other hardware information, such as memory configuration and controllers, is obtained by the lshw tool [23], which uses the DMI structures and the device identification information from the available buses (PCI, SCSI).
3.2.1 Dell PowerEdge 1955 The Dell PowerEdge 1955 machine represents a common server configuration with an Intel processor, and is referred to as Platform Intel Server. The platform is used in most processor and memory related experiments, since its processor and memory architecture is representative of contemporary computing platforms. Processor Dual Quad-Core Intel Xeon CPU E5345 2.33 GHz (Family 6 Model 15 Stepping 11), 32 KB L1 caches, 4 MB L2 caches Memory Hard drive
8 GB Hynix FBD DDR2-667, synchronous, two-way interleaving, Intel 5000P memory controller 73 GB Fujitsu SAS 2.5 inch 10000 RPM, LSI Logic SAS1068 Fusion-MPT controller
Operating system Virtual machine
Fedora Linux 8, kernel 2.6.25.4-10.fc8.x86 64, gcc-4.1.2-33.x86 64, glibc-2.7-2.x86 64 Sun Java SE Runtime Environment build 1.6.0-11-b03, Java HotSpot VM build 11.0-b16
c Q-ImPrESS Consortium
Dissemination Level: public
Page 13 / 210
Project Deliverable D3.3: Resource Usage Modeling
Version: 2.0
Last change: February 3, 2009
3.2.2 Dell PowerEdge SC1435 The Dell PowerEdge SC1435 machine represents a common server configuration with an AMD processor, and is referred to as Platform AMD Server. The platform is used in most processor and memory related experiments, since its processor and memory architecture is representative of contemporary computing platforms. Processor Dual Quad-Core AMD Opteron 2356 2.3 GHz (Family 16 model 2 stepping 3), 64 KB L1 caches, 512 KB L2 caches, 2 MB L3 caches Memory
16 GB DDR2-667 unbuffered, ECC, synchronous, integrated memory controller
Hard drive 146 GB Fujitsu SAS 3.5 inch 15000 RPM, 2 drives in RAID0, LSI Logic SAS1068 Fusion-MPT controller Operating system
Fedora Linux 8, kernel 2.6.25.4-10.fc8.x86 64, gcc-4.1.2-33.x86 64, glibc-2.7-2.x86 64
3.2.3 Dell Precision 620 MT The Dell Precision 620 MT machine represents a disk array server configuration, and is referred to as Platform RAID Server. The platform is used in operating system related experiments. Processor Dual Intel Pentium 3 Xeon CPU 800 MHz (Family 6 Model 8 Stepping 3), 16 KB L1 instruction cache, 16 KB L1 data cache, 256 KB L2 cache Memory
2 GB RDRAM 400 MHz, Intel 840 memory controller
Hard drive 18 GB Quantum SCSI 3.5 inch 10000 RPM, 4 drives in RAID 5, Adaptec AIC7899P SCSI U160 controller Operating system File system
Fedora Linux 10, kernel 2.6.27.9-159.fc10.i686, gcc-4.3.2-7.i386, glibc-2.9-3.i686
Linux ext3 4 KB blocks, metadata journal, directory index
3.2.4 Dell Precision 340 The Dell Precision 340 machine represents a common desktop configuration, and is referred to as Platform Desktop. The platform is used in virtual machine related experiments, since its relative simplicity facilitates result interpretation. Processor Intel Pentium 4 CPU 2.2 GHz (Family 15 Model 2 Stepping 4), 12 Ko trace cache, 8 KB L1 data cache, 512 KB L2 cache Memory Hard drive
512 MB RDRAM 400 MHz, Intel 850E memory controller 250 GB Hitachi PATA 3.5 inch 7200 RPM, Intel 82801BA IDE U100 controller
Operating system Virtual machine
Fedora Linux 9, kernel 2.6.25.11-97.fc9.i686, gcc-4.3.0-8.i386, glibc-2.8-8.i686 Sun Java SE Runtime Environment build 1.6.0-06-b02, Java HotSpot VM build 10.0-b22
c Q-ImPrESS Consortium
Dissemination Level: public
Page 14 / 210
Project Deliverable D3.3: Resource Usage Modeling
Version: 2.0
Last change: February 3, 2009
3.3 Resource: Example Resource A separate chapter is dedicated to each logical group of resources. Inside each chapter, a separate section is dedicated to each resource. The resource section follows a fixed template: •
An overview of the resource and a detailed information on how the resource is implemented on the experimental platforms. This overview is not intended to serve as a tutorial for the resource, rather, it illustrates what principal features of the resource are considered to form a technological basis for the descriptions of the individual experiments.
•
Descriptions of the individual experiments. Motivations for the individual experiments are provided in floating sections in between the experiments as necessary, introducing experiments that investigate platform details and experiments that mimic the pipelined and parallel composition scenarios from Chapter 2.
•
Notes on modeling the resource. In the Q-ImPrESS project, resource sharing experiments are conducted to develop resource sharing models, it is therefore necessary that initial sketches towards modeling the resources are done even in the experimental task.
This particular resource section serves as an example to introduce the resource section template. Rather than focusing on a particular resource, the section focuses on the framework used to perform the experiments on most resources, providing information about framework overhead inherent to the experiments.
3.3.1 Platform Details Although the principal features of a resource are usually well known, it turns out that the resource sharing experiment results are difficult to analyze with this knowledge alone. This part of the resource template therefore provides a detailed description of how the particular resource is implemented on the individual experimental platforms, facilitating the analysis. Typically, the level of detail available in common sources, including vendor documentation, is not sufficient for a rigorous analysis of the results, capable of distinguishing fundamental effects from accompanying cross talk, constantly present noise, or even potential experiment errors. The information in common sources, including vendor documentation, often abstracts from details and sometimes provides conflicting or fragmented statements, significant effort was therefore spent documenting the exact source of each resource description statement and verifying or precising each statement with additional experiments, providing a unified resource description. In this example section, the mechanism used to collect the results on the individual platforms is described. 3.3.1.1 Platform Intel Server
Precise timing •
To collect the timing information, the RDTSC processor instruction is used. The instruction fetches the value of the processor clock counter and, on this particular platform, is stable even in presence of frequency scaling. With 2.33 GHz clock, a single clock tick corresponds to 0.429 ns. Since the RDTSC processor instruction does not serialize execution, a sequence of XOR EAX, EAX and CPUID is executed before RDTSC to enforce serialization.
•
The total duration of the timing collection sequence is 245 cycles. The overhead of the framework when collecting the timing information is 266 cycles. The overhead is amortized when performing more operations in a single measured interval.
Performance counters •
To collect additional information, we use the performance event counters. Performance event counters are internal processor registers that can be configured to count occurences of performance related events. The
c Q-ImPrESS Consortium
Dissemination Level: public
Page 15 / 210
Project Deliverable D3.3: Resource Usage Modeling
Version: 2.0
Last change: February 3, 2009
selection of the performance related events depends on the processor, but typically includes events such as instruction retirement, cache miss or cache hit. The performance events supported by this particular platform are described in [6, Appendix A.3]. Although the number of available performance events is usually very high, the number of performance counters in a processor is typically low, often only two or four. When the number of events to be counted is higher than the number of counters, we repeat the experiment multiple times with different sets of events to be counted. To collect the values of the performance counters, we use the PAPI library [25] running on top of perfctr [26]. In this document, we refer to the events by the event names used by the PAPI library, which mostly match the event names in [6, Appendix A.3]. •
The access to a performance counter takes between 7800 and 8000 cycles. The overhead is not present in the timing information, since the additional information is collected separately. It is, however, still present in the workload when the additional information is collected.
3.3.1.2 Platform AMD Server
Precise timing •
To collect the timing information, the RDTSCP processor instruction is used. The instruction fetches the value of the processor clock counter and, on this particular platform, is stable even in presence of frequency scaling. With 2.3 GHz clock, a single clock tick corresponds to 0.435 ns.
•
The total duration of the RDTSCP processor instruction is 75 cycles. The overhead of the framework when collecting the timing information is 80-81 cycles. The overhead is amortized when performing more operations in a single measured interval.
Performance counters •
To collect additional information, we use the processor performance counters. The performance events supported by this particular platform are described in [12, Section 3.14]. We use the PAPI library [25] running on top of perfctr [26] to collect the values of the performance counters. In this document, we refer to the events by the event names used by the PAPI library, which are in most cases capitalized event names from [12, Section 3.14].
•
The access to a performance counter takes between 6500 and 7500 cycles. The overhead is not present in the timing information, since the additional information is collected separately. It is, however, still present in the workload when the additional information is collected.
The rest of the resource section contains experiments grouped by their intent, which is either investigation of platform details or assessment of particular resource sharing scenario – pipelined composition, parallel composition, or general composition.
3.3.2 Platform Investigation The section dedicated to investigation of platform details presents experiments that determine various details of operation of the particular shared resource on the particular experiment platform. 3.3.2.1 Experiment: The name of the experiment
When introducing an experiment, the code used in the experiments is described first, with code fragments included as necessary. Descriptions and results of individual experiments follow, using a common template: Purpose
A brief goal of the experiment.
c Q-ImPrESS Consortium
Dissemination Level: public
Page 16 / 210
Project Deliverable D3.3: Resource Usage Modeling
Version: 2.0
Last change: February 3, 2009
Measured The measured workload. This is the primary code of the experiment, monitored by the framework, which collects the information for the experiment results. Parameters Parameters used by the measured code. A parameter may be a range of values, which means that the experiment is executed multiple times, iterating over the values. Interference The interfering workload. This is the secondary code of the experiment, designed to compete with the measured code over the shared resource. Depending on the composition scenario, it is executed either in sequence or in parallel with the measured workload. Expected Results Since most experiments are designed to trigger particular effects of resource sharing, we describe the expected results of the resource sharing first. This is necessary so that we can compare the measured results with the expectations and perhaps explain why some of the expectations were not met. Measured Results After the expected results, we describe the measured results and validate them against the expectations. When the results meet the expectations, the numeric values of the results provide us with quantification of resource sharing effects. When the results do not meet the expectations, additional explanation and potentially also additional experiments are provided. Open Issues When the measured results exhibit effects that would require additional experiments to investigate, but the effects are not essential to the purpose of the report, the effects are listed as open issues. To illustrate the results, we often provide plots of values such as the duration of the measured operation or the value of a performance counter, often plotted as a dependency on one of the experiment parameters. To capture the statistical variability of the results, we use boxplots of individual samples, or, where the duration of individual operations approaches the measurement overhead, boxplots of averages. The boxplots are scaled to fit the boxes with the whiskers, but not necessarily to fit all the outliers, which are usually not related to the experiment. Where boxplots would lead to poorly readable graphs, we use dots connected by lines to plot the averages. When averages are used in a plot, the legend of the plot informs about the exact calculation of the averages using standardized acronyms. The Avg acronym is used to denote standard mean of the individual observations – for example, 1000 Avg indicates that the plotted values are standard means from 1000 operations performed by the experiment. The Trim acronym is used to denote trimmed mean of the individual observations where 1 % of minimum observations and 1 % of maximum observations was discarded – for example, 1000 Trim indicates that the plotted values are trimmed means from 1000 operations performed by the experiment. The acronyms can be combined – for example, 1000 walks Avg Trim means that observations from 1000 walks performed by the experiment were the input of a standard mean calculation, whose outputs were the input of a trimmed mean calculation, whose output is plotted. In this context, a walk generally denotes multiple operations performed by the experiment to iterate over a full range of data structures that the experiment uses, such as all cache lines or all memory pages.
3.3.3 Composition Scenario Separate sections group experiments that assess a particular resource sharing scenario, which is either the pipelined composition scenario or the parallel composition scenario as described in Chapter 2. A section on general composition groups experiments where the choice of a particular resource sharing scenario does not matter or does not apply. Two general types of experiments are distinguished, namely the artificial experiments and the practical experiments. The goal of the artificial experiments is to exhibit the largest possible effect of resource sharing, even if the workload used to achieve the effect is not common. The goal of the practical experiments is to exhibit the effect of resource sharing in a common workload. The artificial experiments thus allow us to determine the upper bounds of the impact due to sharing the particular resource, and to decide whether to continue with the practical experiments. At this stage of the Q-ImPrESS project, we focus on the artificial experiments, although some practical experiments are also already presented.
c Q-ImPrESS Consortium
Dissemination Level: public
Page 17 / 210
Project Deliverable D3.3: Resource Usage Modeling
Version: 2.0
Last change: February 3, 2009
Chapter 4
Processor Execution Core When considering the shared resources associated with the processor execution core, we assume a common processor that implements speculative superscalar execution with pipelining and reordering on multiple cores. The essential functions provided by the processor execution core to the components are maintaining register content and executing machine instructions with optimizations based on tracking the execution history. Of these optimizations, branch prediction is singled out as a function associated with the processor execution core. Other optimizations, such as caching and prefetching, are discussed with other parts of the processor, such as the address translation buffers and the memory content caches. Since multiple components require multiple processor execution cores to access shared resources concurrently, entire processor execution cores will only be subject to resource sharing in the pipelined composition scenario. As an exception, the processor execution cores of some processors do share most parts of their architecture, except for partitioning resources to guarantee fair utilization and replicating resources necessary to guarantee core isolation [1, page 2-41]. Such processors, however, are not considered in the Q-ImPrESS project.
4.1 Resource: Register Content Since machine instructions frequently modify registers, register content is typically assumed lost whenever control is passed from one component to another. The overhead associated with register content change is therefore always present simply because the machine code of the components uses calling conventions that assume register content is lost. In an environment where calling conventions are subject to optimization after composition, the overhead associated with register content change can be influenced by composition. Such environments, however, are not considered in the Q-ImPrESS project. Effect Summary The overhead of register content change is unlikely to be influenced by component composition, and therefore also unlikely to be visible as an effect of component composition.
4.2 Resource: Branch Predictor The goal of branch prediction is to allow efficient pipelining in presence of conditional and indirect branches. When encountering a conditional or an indirect branch instruction, the processor execution core can either suspend the pipeline until the next instruction address becomes known, or speculate on the next instruction address, filling the pipeline with instructions that might need to be discarded should the speculation prove wrong. Branch prediction increases the efficiency of pipelining by improving the chance of successful speculation on the next instruction address after conditional and indirect branches. Multiple branch predictor functions are typically present in a processor execution core, including a conditional branch predictor, a branch target buffer, a return stack buffer, an indirect branch predictor. A conditional branch predictor is responsible for deciding whether a conditional branch instruction will jump or not. Common predictors decide based on the execution history, assuming that the branch will behave as it did c Q-ImPrESS Consortium
Dissemination Level: public
Page 18 / 210
Project Deliverable D3.3: Resource Usage Modeling
Version: 2.0
Last change: February 3, 2009
earlier. In absence of the execution history, the predictor can decide based on the direction of the branch. As a special case, conditional branches that form loops with constant iteration counts can also be predicted. A branch target buffer caches the target addresses of recent branch instructions. The address of the branch instruction is used as the cache tag, the target address of the branch instruction makes the cache data. The branch target buffer can be searched even before the branch instruction is fully decoded, providing further opportunities for increasing the efficiency of pipelining. A return stack buffer stores the return addresses of nested call instructions. An indirect branch predictor is responsible for deciding where an indirect branch instruction will jump to. Combining the functions of the conditional branch predictor and the branch target buffer, the indirect branch predictor uses the execution history to select among the cached target addresses of an indirect branch.
4.2.1 Platform Details 4.2.1.1 Platform Intel Server
A detailed description of the branch predictor functions on Platform Intel Server should not be relied upon in the experiments, since the branch predictor functions depend on the exact implementation of the processor execution core [6, Section 18.12.3]. •
The processor contains a branch target buffer that caches the target addresses of recent branch instructions. The branch target buffer is indexed by the linear address of the branch instruction [1, Section 2.1.2.1].
•
The return stack buffer has 16 entries [1, page 2-6].
•
The indirect branch predictor is capable of predicting indirect branches with constant targets and indirect branches with varying targets based on the execution history [1, page 2-6].
4.2.1.2 Platform AMD Server
A description of the branch prediction function on Platform AMD Server is provided in [13, page 224]. •
The processor contains a conditional branch predictor based on a global history bimodal counter table indexed by the global conditional branch history and the conditional branch address.
•
The branch target buffer has 2048 entries.
•
The return stack buffer has 24 entries.
•
The indirect branch predictor contains a separate target array to predict indirect branches with multiple dynamic targets. The array has 512 entries.
•
Mispredicted branches incur a penalty of 10 or more cycles.
4.2.2 Sharing Effects The effects that can influence the quality attributes when multiple components share a branch predictor include: Execution history change The processor execution core can only keep a subset of the execution history. Assuming that the predictions based on tracking the execution history work best with a specific subset of the execution history, then the more code is executed, the higher the chance that the predictions will not have the necessary subset of the execution history available. However, if the overhead associated with the missed optimizations is to affect the prediction precision at the component level, the combination of its size and frequency should be on the scale of the component quality attributes. Since the optimizations are performed at the machine instruction level, the overhead associated with the missed optimizations is likely to be of similar scale as the machine instructions themselves. The missed optimizations therefore have to be very frequent to become significant, but that also makes it more likely that the necessary subset of the execution history will be available and the optimizations will not be missed in the first place. c Q-ImPrESS Consortium
Dissemination Level: public
Page 19 / 210
Project Deliverable D3.3: Resource Usage Modeling
Version: 2.0
Last change: February 3, 2009
4.2.3 Pipelined Composition In the pipelined composition scenario, the effects of sharing the branch predictor can be exhibited as follows: •
Assume components that execute many different branch instructions in each invocation. A pipelined composition of such components will increase the number of different branch instructions executed each invocation. When the number of branch instructions exceeds the capacity of the branch target buffer, the target addresses of the branch instructions will not be predicted. With the typical branch target buffer capacity of thousands of items, the overhead of missing the branch predictions would only become significant if the branches made up a significant part of a series of thousands of instructions. This particular workload is therefore not considered in further experiments.
•
Assume components that contain nested call instructions. A pipelined composition of such components will increase the nesting. When the nesting exceeds the depth of the return stack buffer, the return addresses of nested call instructions beyond the depth of the return stack buffer will not be predicted. With the typical return stack buffer depth of tens of items, the overhead of missing a single branch prediction in a series of tens of nested calls is unlikely to become significant. This particular workload is therefore not considered in further experiments.
•
Assume a component that invokes virtual functions implemented by other components. The virtual functions are invoked by indirect branch instructions. A pipelined composition of such components can increase the number of targets of each indirect branch instruction, eventually exceeding the ability of the indirect branch predictor to predict the targets.
4.2.4 Artificial Experiments 4.2.4.1 Experiment: Indirect Branch Misprediction Overhead
The experiment to determine the overhead associated with the indirect branch predictor invokes a virtual function on a varying number of targets. The experiment instantiates TotalClasses objects, each a child of the same base class and each with a different implementation of an inherited virtual function. An array of TotalRe f erences references is filled with references to the TotalClasses objects so that entry i points to object i mod TotalClasses. A single virtual function call iterates over the array of references to invoke the inherited virtual functions of the objects. Listing 4.1: Indirect branch prediction experiment. 1 2 3 4
// Object implementations class VirtualBase { virtual void Invocation() = 0; };
5 6 7 8 9 10 11
class VirtualChildOne : public VirtualBase { virtual void Invocation() { // ... } };
12 13 14
VirtualChildOne oVirtualChildOne; // ...
15 16 17
VirtualBase *apChildren[TotalClasses] = { &oVirtualChildOne, ... }; VirtualBase *apReferences[TotalReferences];
18
c Q-ImPrESS Consortium
Dissemination Level: public
Page 20 / 210
Project Deliverable D3.3: Resource Usage Modeling
Version: 2.0
19 20 21 22
Last change: February 3, 2009
// Array initialization for (int i = 0; i < TotalReferences; i++) { apReferences[i] = apChildren[i % TotalClasses]; }
23 24 25 26 27
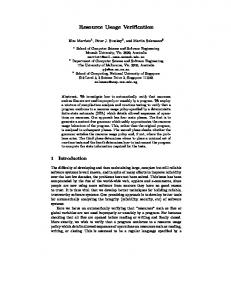
// Workload generation for (int i = 0; i < TotalReferences; i++) { apReferences[i]->Invocation(); } The real implementation of the experiment uses multiple virtual function invocations in the workload generation to make sure the effect of the indirect branches that implement the invocation outweighs the effect of the conditional branches that implement the loop. The implementations of the inherited virtual function perform random memory accesses that trigger cache misses, assuming high cost of their speculative execution. Purpose Determine the maximum overhead related to the ability of the indirect branch predictor to predict the target of a virtual function invocation. Measured Time to perform a single invocation from Listing 4.1 depending on the number of different virtual function implementations. Parameters TotalClasses: 1-4; TotalRe f erences: 12 (chosen as the least common multiple of the actual number of classes). Expected Results With the growing number of different virtual function implementations invoked by the same indirect branch instruction, the ability of the indirect branch predictor to predict the targets will be exceeded. Measured Results On Platform Intel Server, the difference between an invocation time with one and four virtual function implementations is 112 cycles, see Figure 4.1. The indirect branch prediction miss counter on Figure 4.2 indicates that the indirect branch predictor predicts 100 % of the branches with a single target, 12 % of the branches with two targets, and less than 5 % of the branches with three and four targets. The return branch prediction miss counter on Figure 4.3 indicates that the miss on the indirect branch instruction, coupled with a speculative execution of the return branch instruction, makes the return stack buffer miss as well. The comparison of the cycles spent stalling due to branch prediction miss on Figure 4.4 and the cycles spent stalling due to loads and stores on Figure 4.5 illustrates the high cost of performing the random memory accesses speculatively. With four targets, out of the 401 cycles that the invocation takes, 350 cycles are spent stalling due to branch prediction miss. On Platform AMD Server, the difference between an invocation time with one and three virtual function implementations is 75 cycles, see Figure 4.6. The indirect branch prediction miss counter on Figure 4.7 indicates that the indirect branch predictor predicts 100 % of the branches with a single target, 46 % of the branches with two targets, and less than 20 % of the branches with three and four targets. The return branch prediction hit counter on Figure 4.8 indicates that the miss on the indirect branch instruction, coupled with a speculative execution of the return branch instruction, does not make the return stack buffer miss. The comparison of the cycles spent stalling due to branch prediction miss on Figure 4.9 and the cycles spent stalling due to loads and stores on Figure 4.10 illustrates the high cost of performing the random memory accesses speculatively. With three targets, out of the 353 cycles that the invocation takes, 264 cycles are spent stalling due to branch prediction miss. Effect Summary The overhead can be visible in workloads with virtual functions of size comparable to the address prediction miss, however, it is unlikely to be visible with larger virtual functions.
c Q-ImPrESS Consortium
Dissemination Level: public
Page 21 / 210
Project Deliverable D3.3: Resource Usage Modeling
300
320
340
360
380
400
420
Last change: February 3, 2009
280
Duration of virtual function invocation [cycles − 10 Avg]
Version: 2.0
1
2
3
4
Number of different virtual function implementations
1.0 0.8 0.6 0.4 0.2 0.0
Counts of BR_IND_MISSP_EXEC [events − 100 Avg]
Figure 4.1: Indirect branch misprediction overhead on Intel Server.
1
2
3
4
Number of different virtual function implementations
Figure 4.2: Indirect branch prediction counter per virtual function invocation on Intel Server.
c Q-ImPrESS Consortium
Dissemination Level: public
Page 22 / 210
Project Deliverable D3.3: Resource Usage Modeling
0.2
0.4
0.6
0.8
1.0
Last change: February 3, 2009
0.0
Counts of BR_RET_MISSP_EXEC [events − 100 Avg]
Version: 2.0
1
2
3
4
Number of different virtual function implementations
400 300 200 100 0
Counts of RESOURCE_STALLS.BR_MISS_CLEAR [events − 100 Avg]
Figure 4.3: Return branch prediction counter per virtual function invocation on Intel Server.
1
2
3
4
Number of different virtual function implementations
Figure 4.4: Stalls due to branch prediction miss counter per virtual function invocation on Intel Server.
c Q-ImPrESS Consortium
Dissemination Level: public
Page 23 / 210
Project Deliverable D3.3: Resource Usage Modeling
200
250
300
Last change: February 3, 2009
150
Counts of RESOURCE_STALLS.LD_ST [events − 100 Avg]
Version: 2.0
1
2
3
4
Number of different virtual function implementations
360 340 320 300 280
Duration of virtual function invocation [cycles − 100 Avg]
Figure 4.5: Stalls due to loads and stores counter per virtual function invocation on Intel Server.
1
2
3
4
Number of different virtual function implementations
Figure 4.6: Indirect branch misprediction overhead on AMD Server.
c Q-ImPrESS Consortium
Dissemination Level: public
Page 24 / 210
Project Deliverable D3.3: Resource Usage Modeling
0.2
0.4
0.6
0.8
1.0
Last change: February 3, 2009
0.0
RETIRED_INDIRECT_BRANCHES_MISPREDICTED [events − 10 Avg]
Version: 2.0
1
2
3
4
Number of different virtual function implementations
3.0 2.5 2.0 1.5 1.0
Counts of RETURN_STACK_HITS [events − 10 Avg]
Figure 4.7: Indirect branch prediction counter per virtual function invocation on AMD Server.
1
2
3
4
Number of different virtual function implementations
Figure 4.8: Return branch prediction counter per virtual function invocation on AMD Server.
c Q-ImPrESS Consortium
Dissemination Level: public
Page 25 / 210
Project Deliverable D3.3: Resource Usage Modeling
50
100
150
200
250
300
Last change: February 3, 2009
0
Counts of DISPATCH_STALL_FOR_BRANCH_ABORT [events − 10 Avg]
Version: 2.0
1
2
3
4
Number of different virtual function implementations
300 250 200 150 100 50
Counts of DISPATCH_STALL_FOR_LS_FULL [events − 10 Avg]
Figure 4.9: Stalls due to branch prediction miss counter per virtual function invocation on AMD Server.
1
2
3
4
Number of different virtual function implementations
Figure 4.10: Stalls due to loads and stores counter per virtual function invocation on AMD Server.
c Q-ImPrESS Consortium
Dissemination Level: public
Page 26 / 210
Project Deliverable D3.3: Resource Usage Modeling
Version: 2.0
Last change: February 3, 2009
4.2.5 Modeling Notes For the branch predictor resource, the only source of overhead investigated by the experiments is the reaction of the indirect branch predictor to an increase in the number of indirect branch targets. When the number of potential targets of an indirect branch increases, especially from one target to more than one target, the indirect branch predictor might be more likely to mispredict the target. The misprediction introduces two sources of overhead, one due to the need to cancel the speculatively executed instructions, and one due to the interruption in the pipelined execution. Modeling this effect therefore requires modeling the probability of the indirect branch predictor mispredicting the target, and modeling the overhead of canceling speculatively executed instructions and the overhead of interrupting the pipelined execution. The existing work on performance evaluation of branch predictors provides contribution in these major topic groups: Evaluation of a particular branch predictor is usually done when a new branch predictor is proposed, observing the branch predictor behavior under specific workloads. Because a hardware implementation of the branch predictor would be expensive, a software simulation is used instead, with varying level of detail and therefore varying precision. Examples in this group of related work include [38], which simulates the behavior of several conditional branch predictors and indirect branch predictors over traces of the SPEC benchmark, reporting misprediction rates, and [36], which simulates the behavior of several indirect branch predictors over traces of the SPEC benchmark, reporting misprediction counts. With respect to the modeling requirements of the Q-ImPrESS project, the evaluations of a particular branch predictor do not attempt to characterize the workload and do not attempt to model the overhead associated with misprediction. Evaluation of the worst case execution time is done to improve the overestimation rates of the worst case execution time on modern processors. The models consider all execution paths in the control flow graph, assuming a general implementation of the branch predictor based on execution history and branch counters. Examples in this group of related work include [37], where the worst case execution time is estimated by maximizing the accumulated misprediction overhead over all execution paths in the control flow graph, assuming constant overhead of single misprediction. The assumption of constant overhead is challenged in [35], which extends an earlier approach to modeling certain predictable branches by including varying misprediction overhead, but the overhead itself is not enumerated. Given the requirements of the Q-ImPrESS project and the state of the related work, it is unlikely that the reaction of the indirect branch predictor to an increase in the number of indirect branch targets could be modeled precisely. It is, however, worth considering whether a potential for incurring a resource sharing overhead could be detected by identifying cases of composition that increase the number of indirect branch targets in performance sensitive code.
c Q-ImPrESS Consortium
Dissemination Level: public
Page 27 / 210
Project Deliverable D3.3: Resource Usage Modeling
Version: 2.0
Last change: February 3, 2009
Chapter 5
System Memory Architecture When considering the shared resources associated with the system memory architecture, we assume a common architecture with virtual memory and multiple levels of caches, potentially shared between multiple processors, with support for coherency.
5.1 Common Workloads Because the artificial workloads used in the experiments on the individual memory subsystem resources are practically the same, only with different parameters, we describe them together. In most of the experiments with data access, the measured workload reads or writes data from or to memory using various access patterns. Apart from the access instructions themselves, the code of the workload also contains additional instructions that determine the access address and control the access loop. Although it is only the behavior of the access instructions that is of interest in the experiment, measuring the access instructions alone is not possible due to measurement overhead. Instead, the entire access loop, containing both the access instructions and the additional instructions, is measured. To minimize the distortion of the experiment results, the measured workload should perform as few additional memory accesses and additional processor instructions as possible. To achieve this, we create the access pattern before the measurement and store it in memory as the very data that the experiment accesses. The access pattern forms a chain of pointers and the measured workload uses the pointer that it reads in each access as an address for the next access. When writing is needed in addition to reading, the measured workload also flips and masks the lowest bit of the pointers. The workload is illustrated in Listing 5.1. Listing 5.1: Pointer walk workload. 1 2
// Variable start is initialized by an access pattern generator uintptr_t *ptr = start;
3 4 5 6 7 8 9 10 11 12
// // // // // // // // //
When measuring the duration of the whole pointer walk, the loop is surrounded by the timing code and the loopCount variable is set to a multiple of the pointer walk length. When measuring the duration of a fixed number of iterations, the loop is split in two, with the inner loop surrounded by the timing code and performing the fixed number of iterations.
13 14 15 16
for (int i = 0; i < loopCount; i++) { if (writeAccess) { uintptr_t value = *ptr;
17 18
// Write access flips the least significant bit of the pointer c Q-ImPrESS Consortium
Dissemination Level: public
Page 28 / 210
Project Deliverable D3.3: Resource Usage Modeling
Version: 2.0
Last change: February 3, 2009
*ptr = value ˆ 1;
19 20
// The least significant bit is masked to get next access address ptr = (uintptr_t) (value & -2) } else { // Read access just follows the pointer walk ptr = (uintptr_t *) *ptr; }
21 22 23 24 25 26 27
} The pointer walk code from Listing 5.1 serves to emphasize access latencies, since each access has to finish before the address of the next access is available. In experiments that need to assess bandwidth rather than latency, the dependency between accesses would limit the maximum speed achieved. Such experiments therefore use a variant of the pointer walk code with multiple pointers illustrated in Listing 5.2. The multipointer walk is similar to the pointer walk, except that in each iteration, it advances multiple pointers in independent memory regions instead of just one pointer in one memory region. The processor can therefore execute multiple concurrent accesses in each iteration. When enough pointers are used in multipointer walk, the results will be limited by the access bandwidth rather than the access latency since, at any given time, there will be an outstanding access. Listing 5.2: Multipointer walk workload.
1
uintptr_t **ptrs = new (void *)[numPointers];
2 3 4 5 6
for (int i = 0; i < numPointers; i++) { // Variable startAddress is an array variant of start in pointer walk ptrs[i] = startAddress[i]; }
7 8 9
// The same considerations as in pointer walk // apply for measuring access duration.
10 11 12 13 14 15 16 17
for (int i = 0; i < loopCount; i++) { for (int j = 0; j < numPointers ; j++) { // Read access just follows the pointer walk // Write access is the same as in pointer walk ptrs[j] = (uintptr_t *) *(ptrs[j]); } } In some experiments, the multipointer walk is used as an interfering workload running in parallel with the measured workload. When that is the case, the intensity of accesses performed by the interfering workload is controlled by inserting a sequence of NOP instructions into each iteration, as illustrated in Listing 5.3. The length of the inserted sequence of NOP instructions is a parameter of the experiment, with an upper limit to prevent trashing the instruction cache. If the number of inserted NOP instructions needs to be higher than this limit, a shorter sequence is executed repeatedly to achieve a reasonably homogeneous workload without trashing the instruction cache. Listing 5.3: Multipointer walk workload with delays.
1 2
// Create the sequence of NOP instructions dynamically void (*nopFunc)() = createNopFunc(nopCount, nopLimit);
3 4
uintptr_t **ptrs = new (void *)[numPointers];
5 6
for (int i = 0; i < numPointers; i++) { c Q-ImPrESS Consortium
Dissemination Level: public
Page 29 / 210
Project Deliverable D3.3: Resource Usage Modeling
Version: 2.0
ptrs[i] = startAddress[i];
7 8
Last change: February 3, 2009
}
9 10 11 12
for (int i = 0; i < loopCount; i++) { // Execute the NOP instructions as a delay (*nopFunc)();
13
for (int j = 0; j < numPointers ; j++) { // Read access just follows the pointer walk // Write access is the same as in pointer walk ptrs[j] = (uintptr_t *) *(ptrs[j]); }
14 15 16 17 18 19
} To initialize a memory region for the pointer walk, or multiple independent memory regions for the multipointer walk, we use several access pattern generators. The very basic access pattern is the linear pattern, where the pointer walk consists of addresses increasing with a constant stride, starting at the beginning of the allocated buffer. The code to generate the access pattern is presented in Listing 5.4 and has the following parameters: allocSize
Amount of memory both allocated and accessed through the pointers.
accessStride
The stride between two consecutive pointers. Listing 5.4: Linear access pattern generator.
1 2
// To simplify the pointer arithmetics accessStride /= sizeof(uintptr_t);
3 4 5 6
// Create the linear pointer walk uintptr_t *start = buffer; uintptr_t *ptr = start;
7 8 9 10 11 12
while (ptr < buffer + allocSize) { uintptr_t *next = ptr + accessStride; (*ptr) = next; ptr = next; }
13 14 15
// Wrap the pointer walk (*(ptr - accessStride)) = (uintptr_t) start; In experiments that use the linear access pattern, care needs to be taken to avoid misleading interpretation of experiment results. When both the measured workload and the interfering workload use the linear access pattern, a choice of the buffer addresses can make the workloads exercise different associativity sets, distorting the experiment results. For experiments that require uniform distribution of accesses over all cache entries with no hardware prefetch, a random access pattern is used instead of the linear one. The code to generate the access pattern is presented in Listing 5.5. First, an array of pointers to the buffer is created. Next, the array is shuffled randomly. Finally, the array is used to create the pointer walk of given length. The parameters of the code follow: allocSize accessSize
The range of addresses spanned by the pointer walk. The amount of memory accessed by the pointer walk.
c Q-ImPrESS Consortium
Dissemination Level: public
Page 30 / 210
Project Deliverable D3.3: Resource Usage Modeling
Version: 2.0
accessStride
The stride between the pointers beffore shuffling.
accessOffset
Offset of pointers within the stride.
Last change: February 3, 2009
Listing 5.5: Random access pattern generator. 1 2
// All pointers are shifted by requested offset buffer += accessOffset;
3 4 5 6 7 8 9
// Create array of pointers in the allocated buffer int numPtrs = allocSize / accessStride; uintptr_t **ptrs = new (uintptr_t *)[numPtrs]; for (int i = 0; i < numPtrs; i++) { ptrs [i] = buffer + i * accessStride; }
10 11 12
// Randomize the order of the pointers random_shuffle(ptrs, ptrs + numPtrs);
13 14 15 16 17 18 19 20 21 22
// Create the pointer walk from selected pointers uintptr_t *start = ptrs[0]; uintptr_t **ptr = (uintptr_t **) start; int numAccesses = accessSize / accessStride; for (int i = 1; i < numAccesses; i++) { uintptr_t *next = ptrs[i]; (*ptr) = next; ptr = (uintptr_t **) next; }
23 24 25 26
// Wrap the pointer walk (*ptr) = start; delete[] ptrs; Some experiments need to force set collision by accessing only those addresses that map to a single associativity set of a translation buffer or a memory cache. Although this could be done by using the random access pattern generator with the stride parameter set to the size of the buffer or cache divided by the associativity, we have decided to create a a specialized access pattern generator instead. The set collision access pattern generator operates on entire memory pages rather than individual cache lines, and it can randomize the offset of accesses within a page to make it possible to avoid memory cache misses while still triggering translation buffer misses. The code of the set collision access pattern generator, presented in Listing 5.6, accepts these parameters: allocPages accessPages cacheSets accessOffset
The range of page addresses spanned by the pointer walk. The number of pages accessed by the pointer walk. The number of associativity sets to consider. Offset of pointers within the page when not randomized.
accessOffsetRandom
Tells whether the offset will be randomized. Listing 5.6: Set collision access pattern generator.
1
uintptr_t **ptrs = new (uintptr_t *)[allocPages];
2
c Q-ImPrESS Consortium
Dissemination Level: public
Page 31 / 210
Project Deliverable D3.3: Resource Usage Modeling
Version: 2.0
3 4 5 6
Last change: February 3, 2009
// Create array of pointers to the allocated pages for (int i = 0; i < allocPages; i++) { ptrs[i] = (uintptr_t *) buf + cacheSets * PAGE_SIZE; }
7 8 9
// Cache line size is considered in units of pointer size int numPageOffsets = PAGE_SIZE / cacheLineSize;
10 11 12 13 14 15
// Create array of offsets in a page offsets = new int[numPageOffsets]; for (int i = 0; i < numPageOffsets; i++) { offsets[i] = i * cacheLineSize; }
16 17 18 19
// Randomize the order of pages and offsets random_shuffle(ptrs, ptrs + allocPages); random_shuffle(offsets, offsets + numPageOffsets);
20 21 22 23 24 25 26
// Create the pointer walk from pointers and offsets uintptr_t *start = ptrs[0]; if (accessOffsetRandom) start += offsets[0]; else start += accessOffset;
27 28 29 30 31 32 33 34 35 36 37
uintptr_t **ptr = (uintptr_t **) start; for (int i = 1; i < accessPages; i++) { uintptr_t *next = ptrs[i]; if (accessOffsetRandom) next += offsets[i \% numPageOffsets]; else next += accessOffset; (*ptr) = next; ptr = (uintptr_t **) next; }
38 39 40 41
// Wrap the pointer walk (*ptr) = start; delete[] ptrs; So far, only experiments with data access were considered. Experiments with instruction access use a similar approach, except for replacing chains of pointers with chains of jump instructions. A necessary difference from using the chains of pointers is that the chains of jump instructions must not wrap, but must contain additional instructions that control the access loop. To achieve a reasonably homogeneous workload, the access loop is partially unrolled, as presented in Listing 5.7.
5.2 Resource: Address Translation Buffers An address translation buffer is a shared resource that provides address translation caching to multiple components running on the same processor core. The essential function provided by the address translation buffer to the components is caching of virtual-to-physical address mappings. c Q-ImPrESS Consortium
Dissemination Level: public
Page 32 / 210
Project Deliverable D3.3: Resource Usage Modeling
Version: 2.0
Last change: February 3, 2009
Listing 5.7: Instruction walk workload. 1
int len = testLoopCount / 16;
2 3 4 5 6 7
while (len --) { // The jump_walk function contains the jump instructions jump_walk(); // The jump_walk function is called 16 times }
Whenever a component accesses a virtual address, the processor searches the address translation buffer. If the translation of the virtual address is found in the buffer, the corresponding physical address is fetched from the buffer, allowing the processor to bypass the translation using the paging structures. When the virtual address is not found in the buffer, a translation using the paging structures is made and the result of the translation is cached in the address translation buffer. Both Platform Intel Server and Platform AMD Server are configured to use 64 bit virtual addresses, but out of the 64 bits, only 48 bits are used [7, Section 2.2]. When only the common page size of 4 KB is considered, the paging structures used to translate virtual addresses to physical addresses have four levels, with every 9 bits of the virtual address serving as an index of a table entry containing the physical address of the lower level structure [7, page 10, Figure 1]. From top to bottom, these structures are the Page Mapping Level 4 (PML4) Table, Page Directory Pointer (PDP) Table, Page Directory with Page Directory Entries (PDE) and Page Table with Page Table Entries (PTE).
5.2.1 Platform Details 5.2.1.1 Platform Intel Server
Each processor core is equipped with its own translation lookaside buffer (TLB), which caches a limited number of most recently used [5, page 10-5] translations referenced by the virtual page number [7, Section 3], allowing it to skip the relatively slow page walks. TLB is split in two separate parts for instruction fetching and data access. •
The replacement policy of all TLBs behaves as a true LRU for the access patterns of our experiments.
•
The instruction TLB (ITLB) is 4-way set associative, has 128 entries, and an ITLB miss incurs penalty of approximately 18.5 cycles (Experiment 5.2.2.6).
•
The data TLB (DTLB) has two levels, not exclusive according to Experiment 5.2.2.2. Both are 4-way set associative, where the smaller and faster DTLB0 with 16 entries is used only for load operations [1, page 2-13] and the larger and slower DTLB1 with 256 entries is used for stores and DTLB0 misses.
•
The penalty of a DTLB0 miss which hits in the DTLB1 is 2 cycles as stated in [6, page A-9] and confirmed in Experiment 5.2.2.3.
•
Translations that miss also in the DTLB1 and hit the PDE cache (see below) incur a 9 cycles penalty (7 cycles beyond the DTLB0 miss) in case the page walk step hits the L1 data cache (Experiment 5.2.2.2).
In addition to the multiple TLBs, [7, Section 4] states that the processor may use extra caches for the PML4, PDP, and PDE entries to prevent page walks through the whole page structures hierarchy in case of a TLB miss. For example, PDE cache entries are indexed by 27 virtual address bits (47:21) and contain the Page Table address, so the translation has to look only in the Page Table. Similarly, the PDP and PML4 caches are indexed by less bits (18 and 9) and result in more paging structures lookups (2 and 3, respectively). Only misses in (or absence of) all these caches result in all four page walk steps. c Q-ImPrESS Consortium
Dissemination Level: public
Page 33 / 210
Project Deliverable D3.3: Resource Usage Modeling
Version: 2.0
Last change: February 3, 2009
Specific details about which of these caches are implemented in this particular processor and their parameters are however implementation dependent and not specified precisely in the vendor documentation. The documentation [5, page 10-5] states only that TLBs store ”page-directory and page-table entries”, which suggests that a PDE cache is implemented. The Intel presentation [9, slide 15] mentions a PDE cache with 32 entries and 4-way associativity. Experiment 5.2.2.5 indicates that PDE and PDP caches are present, the PDE cache has 64 entries and 4-way associativity, and the PDP cache has 4 or less entries. There seems to be no PML4 cache – a miss in the PDP cache needs two extra page walk steps. A PDE miss adds 4 cycles and a PDP cache miss adds 8 cycles penalty in the ideal case – since the paging structures are cached as any other data in the main memory, duration of the address translation depends on whether the entries are present in the data cache. The results of Experiment 5.2.2.5 indicate that cache misses caused by page walk steps have the same penalties as the penalties of data access (see 5.3) and add up to other penalties. 5.2.1.2 Platform AMD Server
Each processor core is equipped with its own TLB, which caches a limited number of most recently used virtual to physical address translations [13, page 225]. The TLB is split in two separate parts for instruction fetching and data access, both parts have two levels. •
The L1 DTLB has 48 entries for 4 KB pages and is fully associative [13, page 225]. A miss in the L1 that hits in the L2 DTLB incurs a penalty of 5 cycles, the replacement policy behaves as true LRU for our workload (Experiment 5.2.2.2).
•
The L2 DTLB has 512 entries with 4-way associativity for 4 KB pages [13, page 226] and seems to be nonexclusive with the L1 DTLB. A miss that needs only one page walk step (PDE cache hit) incurs a penalty of 35 cycles (if the page walk step hits in the L2 cache) beyond the L1 DTLB miss penalty (Experiment 5.2.2.4).
•
The L1 ITLB has 32 entries for 4 KB pages and is fully associative [13, page 225]. A miss in the L1 that hits in the L2 ITLB incurs a penalty of 4 cycles, the replacement policy behaves as true LRU for our workload (Experiment 5.2.2.6).
•
The L2 ITLB has 512 entries with 4-way associativity for 4 KB pages [13, page 226] and seems to be nonexclusive with the L1 ITLB. A miss that needs only one page walk step (PDE cache hit) incurs a penalty of 40 cycles (if the page walk step hits in the L2 cache) beyond the L1 DTLB miss penalty (Experiment 5.2.2.7).
In addition to the two levels of DTLB and ITLB, Experiment 5.2.2.5 indicates that all the extra translation caches (PDE, PDP and PML4) are present and used for data access translations, although not mentioned in the vendor documentation. Although we did not determine their sizes and associativity in the experiment, we observed that additional penalties for misses in these caches are 21 cycles for every extra page walk step. A data access that misses all these caches therefore has a penalty of 103 cycles, which is subsequently more than on Platform Intel Server. The difference is partially caused by the fact that on the AMD processor, the page walk steps go directly to the L2 cache and not in the L1 data cache first. This is a consequence of the paging structures being addressed by physical frame numbers and the L1 data cache on this platform being virtually indexed.
5.2.2 Platform Investigation We perform the following experiments to verify parameters of the translation caches derived from the documentation or CPUID queries, and experimentally determine parameters that could not be derived. In particular, we are interested in the following properties: TLB miss penalty Determines the maximum theoretical slowdown of a single memory access due a TLB sharing. It is not always specified. TLB associativity Determines the number of translations for pages with addresses of a particular fixed stride, that may simultaneously reside in the cache. It is generally well specified, our experiments that determine the miss penalty also confirm these specifications. c Q-ImPrESS Consortium
Dissemination Level: public
Page 34 / 210
Project Deliverable D3.3: Resource Usage Modeling
Version: 2.0
Last change: February 3, 2009
Extra translation caches The processor may implement extra translation caches that are used in the case of a TLB miss to reduce the number of page walk steps needed. Details about their implementation are generally unspecified or model-specific. We determine their presence and miss penalties, that add up to the TLB miss penalties. 5.2.2.1 Miss Penalties
To measure the penalty of a TLB miss, we use a memory access pattern that accesses a given number of memory pages using the code in Listing 5.1 and 5.6. The stride is set so that the accesses map to the same TLB entry set in order to trigger associativity misses. Because we generally access only few pages, we repeat the pointer walk 1000 times to amortize the measurement overhead. By varying the number of accessed pages we should observe no TLB misses until we reach the TLB associativity. The exact behavior after the associativity is exceeded depends on the TLB replacement policy. For LRU, our access pattern should trigger TLB miss on each access as soon as the number of accesses exceeds the number of ways, because the page that is accessed next is the page that has its TLB entry just evicted. Depending on the LRU or LRU approximation variant being implemented in the particular TLB, our access pattern may or may not exhibit the same behavior. 5.2.2.2 Experiment: L1 DTLB miss penalty
Purpose Measured
Determine the penalty of an L1 DTLB miss. Time to perform a single memory access in set collision pointer walk from Listing 5.1 and 5.6.
Parameters Intel Server Pages allocated: 32; access pattern stride: 64 pages (256 DTLB entries divided by 4 ways); pages accessed: 1-32; offset in page: randomized. AMD Server Pages allocated: 64; access pattern stride: 1 page (full associativity); pages accessed: 1-64; offset in page: randomized. Expected Results We should observe no L1 DTLB misses until the number of pages reaches the number of ways in the L1 DTLB, or the number of all entries in case of full associativity. Then we should observe L1 DTLB misses, with exact behavior depending on the replacement policy. The difference between the access durations with and without miss is the L1 DTLB miss penalty. Measured Results The results from Platform Intel Server (Figure 5.1) show an increase in access duration from 3 to 12 cycles at 5 accessed pages, which confirms the 4-way set-associativity of the L1 DTLB. The replacement policy behaves as a true LRU for our access pattern. The event counts of the L0 DTLB miss (DTLB MISSES:L0 MISS LD) and L1 DTLB miss (DTLB MISSES:ANY) events both change from 0 to 1 simultaneously. This indicates that the policy between L0 and L1 DTLB is not exclusive, otherwise their 4-way associativity would add up. The penalty of an L1 DTLB miss is thus 9 cycles. We will determine the penalty of a purely L0 DTLB miss (L1 DTLB hit) in the next experiment. The counts of PAGE WALKS:COUNT (number of page walks executed) increase from 0 to 1, confirming that a page walk has to be performed to perform the address translation in case of a DTLB miss. The PAGE WALKS:CYCLES (cycles spend in page walks) event counter shows increase from 0 to 5 cycles, which means that the counter does not capture the whole 9 cycles penalty observed. The L1D ALL REF (L1 data cache accesses) event counter shows increase from 1 to 2 following the change in DTLB misses. This indicates that (1) page tables are cached in the L1 data cache and (2) a PDE cache is present and the accesses hit there, thus only the last level page walk step is needed. Experiment 5.2.2.5 examines the PDE cache more and determines whether there is also a PDP and other caches present. The results from Platform AMD Server (Figure 5.3) show change from 3 to 8 cycles at 49 accessed pages, which confirms the full associativity and 48 entries in the L1 DTLB. The replacement policy behaves as a true LRU for our access pattern. The performance counters (Figure 5.4) show a change from 0 to 1 in the L1 DTLB miss (L1 DTLB MISS AND L2 DTLB HIT:L2 4K TLB HIT) event and that the L2 DTLB miss c Q-ImPrESS Consortium
Dissemination Level: public
Page 35 / 210
Project Deliverable D3.3: Resource Usage Modeling
6
8
10
12
Last change: February 3, 2009
4
Duration of access [cycles − 1000 walks Avg]
Version: 2.0
1
3
5
7
9
11
13
15
17
19
21
23
25
27
29
31
Number of accessed pages
5
Event counters
1
2
3
4
DTLB_MISSES:ANY L1D_ALL_REF DTLB_MISSES:L0_MISS_LD PAGE_WALKS:COUNT PAGE_WALKS:CYCLES
0
Number of events per access [events − 1000 walks Avg Trim]
Figure 5.1: L1 DTLB miss penalty on Intel Server.
0
5
10
15
20
25
30
Number of accessed pages
Figure 5.2: Performance event counters related to L1 DTLB misses on Intel Server.
c Q-ImPrESS Consortium
Dissemination Level: public
Page 36 / 210
Project Deliverable D3.3: Resource Usage Modeling
4
5
6
7
8
Last change: February 3, 2009
3
Duration of access [cycles − 1000 walks Avg]
Version: 2.0
1
4
7 10
14
18
22
26
30
34
38
42
46
50
54
58
62
Number of accessed pages
1.0 0.8 0.6
Event counters
0.2
0.4
L1_DTLB_MISS_AND_L2_DTLB_HIT:L2_4K_TLB_HIT L1_DTLB_AND_L2_DTLB_MISS:4K_TLB_RELOAD L1_DTLB_HIT:L1_4K_TLB_HIT
0.0
Number of events per access [events − 1000 walks Avg Trim]
Figure 5.3: L1 DTLB miss penalty on AMD Server.
0
10
20
30
40
50
60
Number of accessed pages
Figure 5.4: Performance event counters related to L1 DTLB misses on AMD Server.
(L1 DTLB AND L2 DTLB MISS:4K TLB RELOAD) event does not occur, which confirms the expectation. The penalty of the L1 DTLB miss which hits in the L2 DTLB is thus 5 cycles. Note that the value of L1 DTLB HIT:L1 4K TLB HIT event counter being always 1 indicates a possible problem with this event counter – either it is supposed to count DTLB accesses instead of hits, or has an implementation error. 5.2.2.3 Experiment: DTLB0 miss penalty, Intel Server
Purpose Measured
Determine the penalty of a pure L0 DTLB (DTLB0) miss on Platform Intel Server Time to perform a single memory access in set collision pointer walk from Listing 5.1 and 5.6.
c Q-ImPrESS Consortium
Dissemination Level: public
Page 37 / 210
Project Deliverable D3.3: Resource Usage Modeling
5
Clock cycles DTLB_MISSES:ANY DTLB_MISSES:L0_MISS_LD
1
2
3
Cycles / event counters
4
Last change: February 3, 2009
0
Duration of access/counts of events [cycles/events − 1000 walks Avg Trim]
Version: 2.0
0
5
10
15
20
25
30
Number of accessed pages
Figure 5.5: DTLB0 miss penalty and related performance events on Intel Server.
Parameters Pages allocated: 32; access pattern stride: 4 pages (16 DTLB0 entries divided by 4 ways); pages accessed: 1-32; offset in page: randomized. Expected Results We should observe no DTLB0 misses until the number of pages reaches the DTLB0 associativity, after which we should start seeing misses, depending on the replacement policy. Because the stride is 4 pages, the accesses should not cause associativity misses in the L1 DTLB which has 64 sets. Measured Results The results (Figure 5.5) show that the access duration increases from 3 to 5 cycles at 5 accessed pages and the related performance events show that it is caused by only DTLB0 misses and L1 DTLB hits. The penalty of a DTLB0 miss is thus 2 cycles, which confirms the description of the DTLB MISSES.L0 MISS LD event in [6, page A-9]. 5.2.2.4 Experiment: L2 DTLB miss penalty, AMD Server
Purpose Determine the penalty of an L2 DTLB miss and the inclusion policy between L1 and L2 DTLB on Platform AMD Server. Measured
Time to perform a single memory access in set collision pointer walk from Listing 5.1 and 5.6.
Parameters Pages allocated: 64; access pattern stride: 128 pages (512 L2 DTLB entries divided by 4 ways); pages accessed: 1-64; offset in page: randomized. Expected Results We should observe no L1 or L2 DTLB misses until the number of pages reaches the number of entries in the L1 DTLB. Depending on the inclusion policy between L1 and L2 DTLB we should then start observing L2 DTLB hits first (exclusive policy) or immediately L2 DTLB misses (non-exclusive policy), with exact behavior depending on the L2 DTLB replacement policy. The difference between the access duration with L2 DTLB hit and L2 DTLB miss is the L2 DTLB miss penalty. Measured Results The results (Figure 5.6) show an increase from 3 to 43 cycles at 49 accessed pages, which means we observe L2 DTLB misses and indicates non-exclusive policy. The performance counters (Figure 5.7) show a change from 0 to 1 in the L1 DTLB AND L2 DTLB MISS:4K TLB RELOAD event. c Q-ImPrESS Consortium
Dissemination Level: public
Page 38 / 210
Project Deliverable D3.3: Resource Usage Modeling
10
20
30
40
Last change: February 3, 2009
0
Duration of access [cycles − 1000 walks Avg]
Version: 2.0
1
4
7 10
14
18
22
26
30
34
38
42
46
50
54
58
62
Number of accessed pages
1.0
Event counters
0.2
0.4
0.6
0.8
L1_DTLB_MISS_AND_L2_DTLB_HIT:L2_4K_TLB_HIT L1_DTLB_AND_L2_DTLB_MISS:4K_TLB_RELOAD REQUESTS_TO_L2:TLB_WALK
0.0
Number of events per access [events − 1000 walks Avg Trim]
Figure 5.6: L2 DTLB miss penalty on AMD Server.
0
10
20
30
40
50
60
Number of accessed pages
Figure 5.7: Performance event counters related to L2 DTLB misses on AMD Server.
The L1 DTLB MISS AND L2 DTLB HIT:L2 4K TLB HIT does not occur, which confirms immediate L2 DTLB misses and no hits. The penalty of the L2 DTLB miss is thus 35 cycles beyond the L1 DTLB miss penalty (40 cycles in total). On this processor, paging structures are cached only in the L2 cache or L3 cache and not in the L1 data cache. The REQUESTS TO L2:TLB WALK event counter shows that each L2 DTLB miss in this experiment results in one page walk step that accesses the L2 cache. This means that a PDE cache is present, which is further examined in Experiment 5.2.2.5. Note that the value of the L1 DTLB HIT:L1 4K TLB HIT event counter is still always 1, even in case of L2 DTLB misses. c Q-ImPrESS Consortium
Dissemination Level: public
Page 39 / 210
Project Deliverable D3.3: Resource Usage Modeling
Last change: February 3, 2009
Access stride [pages]
20
30
40
512 1k 2k 4k 8k 16k 32k 64k 128k 256k
10
Duration of access [cycles − 1000 walks Avg Trim]
Version: 2.0
5
10
15
Number of accessed pages
Figure 5.8: Extra translation caches miss penalty on Intel Server.
5.2.2.5 Experiment: Extra translation caches
Purpose
Determine the presence and latency of translation caches other than TLB.
Measured Time to perform a single memory access in set collision pointer walk from Listing 5.1 and 5.6 with various strides. Parameters Intel Server Pages allocated: 16; access pattern stride: 512 pages-256 K pages (exponential step); pages accessed: 1-16; offset in page: randomized. AMD Server Pages allocated: 64; access pattern stride: 128 pages-128 M pages (exponential step); pages accessed: 32-64; offset in page: randomized. Expected Results As we increase the access stride on Platform Intel Server we should see the increase in L1 cache references caused by page walk steps due to misses in the translation caches. Up to 4 accessed pages, the translation should hit in the DTLB as in the previous experiments. On Platform AMD Server we use the REQUESTS TO L2:TLB WALK event counter to determine the number of page walk steps. Up to 48 accessed pages, the translation should hit in the L1 DTLB. The results after exceeding the L1 DTLB capacity depends on parameters of the extra caches, which is not specified in vendor documentation for both platforms. Measured Results The results from Platform Intel Server are presented in Figure 5.8. Figure 5.9 shows event counts for L1 data cache references, which correspond to the page walk steps being performed. For the 512 pages stride, the related performance events are presented in Figure 5.10. The access duration changes from 3 to 12 cycles and the L1D ALL REF event counter shows a change from 1 to 2 events at 5 accessed pages, which means we hit the PDE cache as in the previous experiment. We see also an increase of the duration from 12 to 23 cycles and a change in L1D REPL counter from 0 to 1 events at 9 accessed pages. These L1 data cache misses are not caused by the accessed data but by the page walks – with this stride and alignment we always read the first entry of a page table, thus the same cache set. We see that the penalty of this miss is 11 cycles, also reflected in the value of PAGE WALKS:CYCLES counter, which changes from 5 to 16. The experiments in the memory caches section show that an L1 data cache miss penalty for data load on this platform is indeed 11 cycles, which means it is the same as for the miss during the page walk step and this penalty simply adds up to the DTLB miss penalty. c Q-ImPrESS Consortium
Dissemination Level: public
Page 40 / 210
Project Deliverable D3.3: Resource Usage Modeling
Access stride [pages] 512 1k 2k 4k 8k 16k 32k 64k 128k 256k
2
3
4
5
Last change: February 3, 2009
1
L1 cache accesses per page [events − 1000 walks Avg Trim]
Version: 2.0
5
10
15
Number of accessed pages
5
10
15
Event counters L1D_ALL_REF L1D_REPL PAGE_WALKS:CYCLES
0
Number of events per access [events − 1000 walks Avg Trim]
Figure 5.9: L1 data cache references events related to misses in the extra translation caches on Intel Server.
5
10
15
Number of accessed pages
Figure 5.10: Performance event counters with access stride of 512 pages on Intel Server.
c Q-ImPrESS Consortium
Dissemination Level: public
Page 41 / 210
Project Deliverable D3.3: Resource Usage Modeling
20
Last change: February 3, 2009
Event counters
5
10
15
L1D_ALL_REF L1D_REPL PAGE_WALKS:CYCLES
0
Number of events per access [events − 1000 walks Avg Trim]
Version: 2.0
5
10
15
Number of accessed pages
Figure 5.11: Performance event counters with access stride of 8192 pages on Intel Server.
As we increase the stride, we start to cause conflict misses also in the PDE cache. With the stride of 8192 pages (16 PDE entries) and 5 or more accessed pages, the PDE cache is missed on each access. The L1D ALL REF event counter shows that there are 3 L1 data cache references per access, 2 of them are therefore caused by page walk steps. This means that a PDP cache is also present. (Figure 5.11). The increase in cycles per access (and the PAGE WALKS:CYCLES event) compared to a PDE hit (thus the PDE miss latency) is 4 cycles. If we assume that the PDE cache has 4-way associativity, the fact we need a stride of 16 PDE entries to reliably miss indicates that it has 16 sets, thus 64 entries in total, which is slightly different from the 32 entries (8 sets of 4 ways) mentioned in the Intel presentation [9, slide 15]. Further increase of stride results in increase of PDP misses. With the 256 K (512 × 512) pages stride, each access maps to a different PDP entry. We see that at 5 accessed pages, the L1D ALL REF event counter increases to 5 L1 data cache references per access. This indicates that there is no PML4 cache (all four levels of page tables are walked) and that the PDP cache has only 4 or less entries. Compared to the 8192 pages stride, the PDP miss adds approximately 19 cycles per access. Out of those cycles, 11 cycles are added by an extra L1 data cache miss, as both PDE and PTE entries miss the L1 data cache due to being mapped to the same set – the L1D REPL event counter shows 2 cache misses. The remaining 8 cycles is the cost of walking two additional levels of page tables due to the PDP miss. The observed access durations on Platform AMD Server are shown in Figure 5.12 and values of the REQUESTS TO L2:TLB WALK event counter in Figure 5.13. We can see that for a stride of 128 pages we still hit the PDE cache as in the previous experiment, strides of 512 pages and more need 2 page walk steps and thus hit the PDP cache, strides of 256 K pages need 3 steps and thus hit the PML4 cache and finally strides of 128 M pages need all 4 steps. The duration per access increases by 21 cycles for each additional page walk step. In the case of 128 M stride we see additional penalty caused by the page walks triggering L2 cache misses as the L2 CACHE MISS:TLB WALK event counter shows (Figure 5.14). Determining the associativity and size of the extra translation caches is not possible from the results of this experiments as the fully associative L1 DTLB hides the behavior for 48 and less accesses and we therefore can not determine if the experiment causes associativity misses or capacity misses by 49 and more accesses. c Q-ImPrESS Consortium
Dissemination Level: public
Page 42 / 210
Project Deliverable D3.3: Resource Usage Modeling
128 256 512 1k 2k 4k 8k 16k 32k 64k 128k 256k 512k 1M 2M 4M 8M 16M 32M
50
100
150
Last change: February 3, 2009
Access stride [pages]
0
Duration of access [cycles − 1000 walks Avg Trim]
Version: 2.0
35
40
45
50
55
60
65
Number of accessed pages
Access stride [pages]
1
2
3
4
128 256 512 1k 2k 4k 8k 16k 32k 64k 128k 256k 512k 1M 2M 4M 8M 16M 32M
0
Counts of REQUESTS_TO_L2.TLB_WALK [events − 1000 walks Avg Trim]
Figure 5.12: Extra translation caches miss penalty on AMD Server.
35
40
45
50
55
60
65
Number of accessed pages
Figure 5.13: Page walk requests to L2 cache on AMD Server.
c Q-ImPrESS Consortium
Dissemination Level: public
Page 43 / 210
Project Deliverable D3.3: Resource Usage Modeling
128 256 512 1k 2k 4k 8k 16k 32k 64k 128k 256k 512k 1M 2M 4M 8M 16M 32M
0.2
0.4
0.6
0.8
1.0
1.2
Last change: February 3, 2009
Access stride [pages]
0.0
Counts of L2_CACHE_MISS.TLB_WALK [events − 1000 walks Avg Trim]
Version: 2.0
35
40
45
50
55
60
65
Number of accessed pages
Figure 5.14: L2 cache misses caused by page walks on AMD Server.
5.2.2.6 Experiment: L1 ITLB miss penalty
To measure the penalty of an ITLB miss, we use the same access pattern generator as for the DTLB (Listing 5.6), only modified to create chains of jump instructions executed by the code in Listing 5.7. Purpose Measured
Determine the penalty of an L1 instruction TLB miss. Time to execute a jump instruction in jump instruction chain from Listing 5.7 and 5.6.
Parameters Intel Server Pages allocated: 32; access pattern stride: 32 pages (128 ITLB entries divided by 4 ways); pages accessed: 1-32; offset in page: randomized. AMD Server Pages allocated: 64; access pattern stride: 1 page (full associativity); pages accessed: 1-64; offset in page: randomized. Expected Results We should observe no L1 ITLB misses until the number of pages reaches the number of ways in the L1 ITLB (or all entries in case of full associativity). Then we should observe L1 ITLB misses, with exact behavior depending on the replacement policy. The penalty is likely to be similar to the L1 DTLB penalty. Measured Results The results from Platform Intel Server (Figure 5.15) show an increase from approximately 3.5 cycles per jump instruction to 22 cycles, which is a penalty of 18.5 cycles (note that this could be probably even more if we could eliminate the measurement overhead). The related performance event counters are shown in Figure 5.16. The CYCLES L1I MEM STALLED event counters shows that the ITLB misses cause 19 cycles during which instruction fetches are stalled, which therefore should be the penalty with measurement overhead eliminated. The ITLB:MISSES event counter increases from 0 to 1, as well as the PAGE WALKS:COUNT and L1D ALL REF event counters, which means that only the last level page table is accessed (and cached in the L1 data cache) and a PDE cache is used for instruction fetches as well as for the data accesses. The number of PAGE WALKS:CYCLES increases from 0 to 5 cycles which is the same as in the case of a L1 DTLB miss, but in this case the observed penalty is twice the penalty of a L1 DTLB miss. Note that this c Q-ImPrESS Consortium
Dissemination Level: public
Page 44 / 210
Project Deliverable D3.3: Resource Usage Modeling
10
15
20
Last change: February 3, 2009
5
Duration of JMP instruction [cycles − 1024 walks Avg]
Version: 2.0
1
3
5
7
9
11
13
15
17
19
21
23
25
27
29
31
Number of JMP instructions executed
20 15
Event counters
5
10
L1D_ALL_REF PAGE_WALKS:COUNT PAGE_WALKS:CYCLES ITLB:MISSES CYCLES_L1I_MEM_STALLED
0
Number of events per JMP instruction [events − 1024 walks Avg Trim]
Figure 5.15: ITLB miss penalty on Intel Server.
0
5
10
15
20
25
30
Number of JMP instructions executed
Figure 5.16: Performance event counters related to ITLB miss on Intel Server.
c Q-ImPrESS Consortium
Dissemination Level: public
Page 45 / 210
Project Deliverable D3.3: Resource Usage Modeling
3
4
5
6
Last change: February 3, 2009
2
Duration per JMP instruction [cycles − 1024 walks Avg]
Version: 2.0
1
4
7 10
14
18
22
26
30
34
38
42
46
50
54
58
62
Number of JMP instructions executed
2.5
Event counters
0.5
1.0
1.5
2.0
L1_ITLB_MISS_AND_L2_ITLB_HIT L1_ITLB_MISS_AND_L2_ITLB_MISS:4K_PAGE_FETCHES INSTRUCTION_CACHE_FETCHES
0.0
Number of events per JMP instruction [events − 1024 walks Avg Trim]
Figure 5.17: L1 ITLB miss penalty on AMD Server.
0
10
20
30
40
50
60
Number of JMP instructions executed
Figure 5.18: Performance event counters related to L1 ITLB miss on AMD Server.
should not be caused by the L1 instruction cache misses nor branch prediction misses – their event counters are close to zero. The results from Platform AMD Server (Figure 5.17) show an increase from 2 to 6 cycles per jump instruction at 32 instructions, which confirms the full associativity and 32 entries in the L1 ITLB. The L1 ITLB MISS AND L2 ITLB HIT event counter (Figure 5.18 increases from 0 to 1 and the L1 ITLB MISS AND L2 ITLB MISS:4K PAGE FETCHES event counter stays zero. The penalty of an L1 ITLB miss that hits in the L2 ITLB is therefore 4 cycles. c Q-ImPrESS Consortium
Dissemination Level: public
Page 46 / 210
Project Deliverable D3.3: Resource Usage Modeling
10
20
30
40
50
Last change: February 3, 2009
0
Duration per JMP instruction [cycles − 1024 walks Avg Trim]
Version: 2.0
1
4
7 10
14
18
22
26
30
34
38
42
46
50
54
58
62
Number of JMP instructions executed
Figure 5.19: L2 ITLB miss penalty on AMD Server.
5.2.2.7 Experiment: L2 ITLB miss penalty, AMD Server
Purpose Measured
Determine the penalty of an L2 ITLB miss on Platform AMD Server. Time to execute a jump instruction in jump instruction chain from Listing 5.7 and 5.6.
Parameters Pages allocated: 64; access pattern stride: 128 pages (512 L2 ITLB entries divided by 4 ways); pages accessed: 1-64; offset in page: randomized. Expected Results We should observe no ITLB misses until the number of jump instructions reaches the number of entries in the L1 ITLB. Depending on the inclusion policy between L1 and L2 ITLB we should then start observing L2 ITLB hits first (exclusive policy) or immediately L2 ITLB misses (non-exclusive policy) with exact behavior depending on the replacement policy. The difference between the jump duration with L2 ITLB hit and L2 ITLB miss is the L2 ITLB miss penalty. Measured Results The results (Figure 5.19) show a change from 2 to 46 cycles at 32 accessed pages, which is the same amount of accesses than for the L1 ITLB and thus indicates non-exclusive policy. The L1 ITLB miss (L1 ITLB MISS AND L2 ITLB MISS:4K PAGE FETCHES) and ITLB RELOADS events show a change from 0 to 1 events per access, which confirms there are L2 ITLB misses and no hits (Figure 5.20). The penalty of the L2 ITLB miss is thus 40 cycles beyond the L1 ITLB miss penalty (44 cycles in total), which is similar to the L2 DTLB miss penalty in Experiment 5.2.2.4. The REQUESTS TO L2:TLB WALK event counter shows that each L2 ITLB causes only one page walk step, which indicates a PDE cache being used also for instruction fetches.
5.2.3 Pipelined Composition Translation lookaside buffers are shared in pipelined composition. This can have performance impact as evictions from a shared buffer make components compete for the buffer capacity: •
Compared to the isolated scenario, accesses to memory can trigger more misses in the translation lookaside buffer. An access that triggers a miss in the translation lookaside buffer requires an additional address translation, which entails searching the paging structure caches and traversing the paging structures.
Code most sensitive to these effects is: c Q-ImPrESS Consortium
Dissemination Level: public
Page 47 / 210
Project Deliverable D3.3: Resource Usage Modeling
0.8
1.0
Last change: February 3, 2009
0.6
Event counters
0.2
0.4
L1_ITLB_MISS_AND_L2_ITLB_MISS:4K_PAGE_FETCHES ITLB_RELOADS REQUESTS_TO_L2:TLB_WALK L2_CACHE_MISS:TLB_WALK
0.0
Number of events per JMP instruction [events − 1024 walks Avg Trim]
Version: 2.0
0
10
20
30
40
50
60
Number of JMP instructions executed
Figure 5.20: Performance event counters related to L1 ITLB misses on AMD Server.
•
Access to memory where addresses belonging to the same page are accessed only once, and where the accessed addresses would fit into the translation lookaside buffer (or a TLB set in case they have a bad stride, and the other pipelined code too) in the isolated scenario. Note that prefetching should not mask TLB misses (at least on Intel Core where prefetching works only within a page).
5.2.4 Artificial Experiments The following experiments resemble the scenario with the greatest expected sharing overhead of the TLB in the pipelined scenario, where executions of individual components are interleaved and thus a component may evict TLB entries of a different component during its execution. 5.2.4.1 Experiment: DTLB sharing
For the DTLB, the measured workload accesses data in a memory buffer so that each access uses an address in different memory page, i.e. different TLB entry. This is done by executing the set collision pointer walk code in Listing 5.1 and 5.6 with stride of 1 page so the accesses map to all entries in the TLB and not just to entries of one particular associativity set. The number of pages to access equals to the number of TLB entries, and offsets of the accesses in pages are randomly spread over cache lines to prevent associativity misses in the L1 data cache. The interfering workload is the same as the measured workload, but accessing a different memory buffer, so that the its address translations evict the TLB entries occupied by the measured workload. The number of accessed pages varies from 0 to the number of TLB entries, which influences the amount of TLB misses in the measured code from 0 % to 100 % Purpose Measured
Determine the impact of DTLB sharing on the most sensitive code. Time to perform a single memory access in set collision pointer walk from Listing 5.1 and 5.6.
Parameters Intel Server Pages allocated: 256; access pattern stride: 1 page; pages accessed: 256 (all L1 DTLB entries); offset in page: randomized. AMD Server Pages allocated: 512; access pattern stride: 1 page; pages accessed: 512 (all L2 DTLB entries); offset in page: randomized. c Q-ImPrESS Consortium
Dissemination Level: public
Page 48 / 210
Project Deliverable D3.3: Resource Usage Modeling
Last change: February 3, 2009
15 10 5
Duration of access [cycles − 512 Avg]
20
Version: 2.0
0
16
32
48
64
80
96 112
136
160
184
208
232
256
Number of pages accessed by the interfering workload
Figure 5.21: DTLB sharing with pipelined composition of most sensitive code on Intel Server.
Interference The same as the measured workload. Intel Server Pages allocated: 256; access pattern stride: 1 page; pages accessed: 0-256 (8 pages step); offset in page: randomized. AMD Server Pages allocated: 512; access pattern stride: 1 page; pages accessed: 0-512 (16 pages step); offset in page: randomized. Expected Results The measured workload should fit in the last level DTLB (L1 on Intel Server and L2 on AMD Server) and therefore hit on each access when executed with no interference. The interfering workload should increasingly evict the DTLB entries occupied by the measured workload, until the whole DTLB is evicted and the measured workload should miss the DTLB on each access. On Platform Intel Server, 256 accesses of the measured workload will also occupy 16 KB of the L1 data cache. The interfering workload will also occupy 16 KB with 256 accesses. Because DTLB misses cause additional accesses to the L1 data cache for the page walks and the L1 data cache is 32 KB large, we should also see L1 data cache misses as a direct consequence of the DTLB sharing. On Platform Intel Server, 512 accesses of the measured workload will also occupy 32 KB of the L1 data cache. The interfering workload will also occupy 32 KB with 512 accesses. Because page walks on DTLB misses access only the L2 cache and not the L1 data cache, we should see no extra L1 data cache capacity misses on this platform. Measured Results The results from Platform Intel Server (Figure 5.21) show an increase from 6 to 18 cycles due to the L1 DTLB sharing. With 256 L1 DTLB entries, the total overhead is approximately 3000 cycles. The event counters (Figure 5.22) confirm that the number of DTLB MISSES:ANY events increases up to 1 per access due to the interfering workload. The number of L1D REPL events increases to 0.9 L1 cache misses per access due to the page walks exceeding the L1 cache size which is already fully occupied by the workload accesses. The results from Platform AMD Server (Figure 5.23) show an increase from 11 to 42 cycles due to the L2 DTLB sharing. With 512 L2 DTLB entries, the total overhead is approximately 16000 cycles. The event counters (Figure 5.23-papi) show that number of the L1 DTLB AND L2 DTLB MISS.4K TLB RELOAD event increases due to the interfering workload, but does not reach 1 L2 DTLB miss per access. This could mean that the replacement policy of the L2 DTLB is not true LRU. Note that the DATA CACHE MISSES event counter shows L1 data cache misses that are non-zero even with no interference and increase with the interference. This is because the access pattern initialization (Listing 5.6) randomizes access offsets to cache c Q-ImPrESS Consortium
Dissemination Level: public
Page 49 / 210
Project Deliverable D3.3: Resource Usage Modeling
Version: 2.0
Last change: February 3, 2009
Event counters
4 3 2 1 0
Event counts [events − 512 Avg Trim]
5
DTLB_MISSES:ANY L1D_ALL_REF L1D_REPL L2_LINES_IN:SELF DTLB_MISSES:L0_MISS_LD PAGE_WALKS:COUNT PAGE_WALKS:CYCLES
0
50
100
150
200
250
Number of pages accessed by the interfering workload
40 30 20 10
Duration of access [cycles − 512 Avg]
Figure 5.22: DTLB sharing with pipelined composition of most sensitive code on Intel Server – performance events.
0
32
64
96 128
176
224
272
320
368
416
464
512
Number of pages accessed by the interfering workload
Figure 5.23: DTLB sharing with pipelined composition of most sensitive code on AMD Server.
lines uniformly in individual pages, however the L1 cache size of this platform divided by associativity is 32 KB (8 pages), which means some cache sets are getting more accesses than others. Note that the values of the performance counters (on both platforms) are affected by measurement overhead, which means the observed values might be higher. However the overhead here cannot be reduced by repeated execution of the experiment inside one event counters collection, otherwise events of for both measured and interfered code would be counted together. Effect Summary The overhead can be visible in workloads with very poor locality of data references to virtual pages that fit in the address translation buffer when executed alone. Depending on the range of accessed addresses, the workload can also cause additional cache misses when traversing the address translation structures. The translation buffer miss can be repeated only as many times as there are the address translation c Q-ImPrESS Consortium
Dissemination Level: public
Page 50 / 210
Project Deliverable D3.3: Resource Usage Modeling
Version: 2.0
Last change: February 3, 2009
0.8 0.6 0.4 0.2
Event counts [events − 512 Avg Trim]
Event counters DATA_CACHE_MISSES L1_DTLB_MISS_AND_L2_DTLB_HIT:L2_4K_TLB_HIT L1_DTLB_AND_L2_DTLB_MISS:4K_TLB_RELOAD
0
100
200
300
400
500
Number of pages accessed by the interfering workload
Figure 5.24: DTLB sharing with pipelined composition of most sensitive code on AMD Server – performance events.
buffer entries, the overhead will therefore only be significant in workloads where the number of data accesses per invocation is comparable to the size of the buffer.
5.2.4.2 Experiment: ITLB sharing
The ITLB sharing experiment is similar to the DTLB one except for executing chains of jump instruction (Listing 5.6) as both measured and interfering workload. Purpose Measured
Determine the impact of ITLB sharing on the most sensitive code. Time to execute a jump instruction in jump instruction chain from Listing 5.7 and 5.6.
Parameters Intel Server Pages allocated: 128; access pattern stride: 1 page; pages accessed: 128 (all L1 ITLB entries); offset in page: randomized. AMD Server Pages allocated: 512; access pattern stride: 1 page; pages accessed: 512 (all L2 ITLB entries); offset in page: randomized. Interference The same as the measured workload. Intel Server Pages allocated: 128; access pattern stride: 1 page; pages accessed: 0-128 (4 pages step); offset in page: randomized. AMD Server Pages allocated: 512; access pattern stride: 1 page; pages accessed: 0-512 (16 pages step); offset in page: randomized. Expected Results The measured workload should fit in the ITLB (L2 ITLB on AMD Server) and therefore hit on each access when executed with no interference. The interfering workload should increasingly evict the ITLB entries occupied by the measured workload, until the whole ITLB is evicted and the measured workload should miss the ITLB on each jump instruction. On Platform Intel Server, 128 accesses of the measured workload will also occupy 8 KB of the L1 instruction cache. The interfering workload will also occupy 8 KB with 128 accesses. As the L1 instruction cache is 32 KB large, there should be no misses. Also the amount of memory accessed by page walks due to ITLB misses should fit in the L1 data cache and cause no misses. c Q-ImPrESS Consortium
Dissemination Level: public
Page 51 / 210
Project Deliverable D3.3: Resource Usage Modeling
10
15
20
25
30
Last change: February 3, 2009
5
Duration per JMP instruction [cycles − 128 Avg]
Version: 2.0
0
8
16
24
32
40
48
56
64
72
80
88
96 104
116
128
Number of JMP instructions executed by the interfering workload
Event counters
1
2
3
4
5
L1D_ALL_REF L1D_REPL PAGE_WALKS:COUNT PAGE_WALKS:CYCLES L1I_MISSES ITLB:MISSES
0
Counts of events per JMP instruction [events − 128 Avg Trim]
Figure 5.25: ITLB sharing with pipelined composition of most sensitive code on Intel Server.
0
20
40
60
80
100
120
Number of JMP instructions executed by the interfering workload
Figure 5.26: ITLB sharing with pipelined composition of most sensitive code on Intel Server – performance events.
On Platform Intel Server, 512 accesses of the measured workload will also occupy 32 KB of the L1 instruction cache. The interfering workload will also occupy 32 KB with 512 accesses. The L1 instruction cache is 64 KB large, we should therefore see no L1 capacity misses on this platform. Measured Results The results from Platform Intel Server (Figure 5.25) show an increase from 6 to 28 cycles due to the ITLB sharing. With 128 ITLB entries, the total overhead is approximately 2800 cycles. The event counters (Figure 5.26) confirm that counts of the DTLB MISSES event as well as the PAGE WALKS:COUNT event increase up to 1 event per access due to the interfering workload. The results from Platform AMD Server (Figure 5.27) show an increase from 14 to 59 cycles due to the L2 ITLB sharing. With 512 L2 ITLB entries, the total overhead is approximately 23000 cycles. The event c Q-ImPrESS Consortium
Dissemination Level: public
Page 52 / 210
Project Deliverable D3.3: Resource Usage Modeling
20
30
40
50
60
Last change: February 3, 2009
10
Duration per JMP instruction [cycles − 128 Avg]
Version: 2.0
0
32
64
96 128
176
224
272
320
368
416
464
512
Number of JMP instructions executed by the interfering workload
1.4 1.2 1.0 0.8 0.6 0.4
Event counters L1_ITLB_MISS_AND_L2_ITLB_HIT L1_ITLB_MISS_AND_L2_ITLB_MISS:4K_PAGE_FETCHES INSTRUCTION_CACHE_FETCHES INSTRUCTION_CACHE_MISSES
0.2
Counts of events per JMP instruction [events − 128 Avg Trim]
Figure 5.27: L2 ITLB sharing with pipelined composition of most sensitive code on AMD Server.
0
100
200
300
400
500
Number of JMP instructions executed by the interfering workload
Figure 5.28: L2 ITLB sharing with pipelined composition of most sensitive code on AMD Server – performance events.
counters (Figure 5.28) show an increase of the L1 ITLB MISS AND L2 ITLB MISS:4K PAGE FETCHES events, it does not however reach 1 miss per access. This could mean that the replacement policy of the L2 ITLB is not true LRU. The number of the INSTRUCTION CACHE MISSES events is not zero, and increases with interference for similar reason as in the previous DTLB experiment. Note that the as in the previous experiment, the performance counters on both platforms may be showing somewhat higher values due to measurement overhead which here cannot be reduced by repeated execution. Effect Summary The overhead can be visible in workloads with very poor locality of instruction references to virtual pages that fit in the address translation buffer when executed alone. The translation buffer miss can c Q-ImPrESS Consortium
Dissemination Level: public
Page 53 / 210
Project Deliverable D3.3: Resource Usage Modeling
Version: 2.0
Last change: February 3, 2009
be repeated only as many times as there are the address translation buffer entries, the overhead will therefore only be significant in workloads where the number of instruction accesses per invocation is comparable to the size of the buffer.
5.2.5 Parallel Composition Translation lookaside buffers are never shared, however, accessing the same virtual addresses from multiple processors causes translation entries to be replicated. In the parallel composition scenario, the effects of replicating the translation entries can be exhibited as follows: •
Assume components that change the mapping between virtual and physical addresses. A change of the mapping causes the corresponding translation entries to be invalidated, penalizing all other components that rely on them. The effect of invalidating a translation entry can be further amplified due to limited selectivity of the invalidation operation. Rather than invalidating the particular translation entry, all translation entries in the same address space can be impacted. Similarly, rather than delivering the invalidation request to the processors holding the particular translation entry, all processors mapping the same address space can be impacted.
5.2.6 Artificial Experiments A component can change the mapping between virtual and physical addresses by invoking an operating system function that modifies its address space. Among such functions that invalidate translation entries on the experimental platforms are mprotect, mremap and munmap. The experiment to determine the overhead associated with the address space modification uses a component that keeps modifying the address space using the mmap and munmap functions from Listing 5.8 as the interfering workload, and a component that performs the random pointer walk from Listing 5.1 and 5.5 as the measured workload. Listing 5.8: Address space modification. 1 2 3 4 5 6 7
// Workload generation while (true) { // Map a page void *pPage = mmap(NULL, 4096, PROT_READ | PROT_WRITE, MAP_ANONYMOUS | MAP_PRIVATE, -1, 0);
8
// Access the page to create the translation entry *((char *) pPage) = 0;
9 10 11
// Unmap the page munmap(pPage, 4096);
12 13 14
} Due to limited selectivity, the interfering workload invalidates the entire address translation buffer on all processors that map its address space. The invalidation involves sending an interrupt to all the processors that map the address space. The processors invalidating their entire address translation buffer on receiving the interrupt. This behavior is specific to the operating system of the experimental platforms [28]. 5.2.6.1 Experiment: Translation Buffer Invalidation Overhead
Purpose Determine the maximum overhead associated with intensive address space modifications that trigger translation buffer invalidations. c Q-ImPrESS Consortium
Dissemination Level: public
Page 54 / 210
Project Deliverable D3.3: Resource Usage Modeling
20
25
30
35
Last change: February 3, 2009
15
Duration of single access [cycles − 1000 Avg]
Version: 2.0
0
1
2
3
4
5
6
7
Number of interfering processors
Figure 5.29: Translation buffer invalidation overhead on Intel Server.
Measured Parameters
Time to perform a single memory access in random pointer walk from Listing 5.1 and 5.5. Intel Server Allocated: 512 KB; accessed: 512 KB; stride: 4 KB.
AMD Server Allocated: 256 KB; accessed: 256 KB; stride: 4 KB. Interference
Address space modification from Listing 5.8. Processors: 0-7.
Expected Results The measured workload is configured to access different pages in an address range that fits into the cache, each access therefore uses a different translation entry. Invalidating the entire address translation buffer should impose the data TLB miss penalty on the entire cycle of accesses by the measured workload. Measured Results On Platform Intel Server, the time to perform a single memory access in random pointer walk is shown on Figure 5.29. The figure indicates that running the interfering workload on one processor extends the average time for a single access in the measured workload from 16 cycles to 28 cycles. When running the interfering workload on more than one processor, the average time for a single access settles between 18 and 20 cycles. The values of the data TLB miss counter on Platform Intel Server on Figure 5.33 show a maximum miss rate of 33 %, observed when the interfering workload executes on one processor. When the interfering workload executes on more than one processor, the miss rate drops below 5 %. On Platform AMD Server, the time to perform a single memory access in random pointer walk is shown on Figure 5.31. The figure indicates that running the interfering workload on one processor extends the average time for a single access in the measured workload from 18 cycles to 48 cycles. When running the interfering workload on more than one processor, the average time for a single access settles between 20 and 21 cycles. The values of the data TLB miss counter on Platform AMD Server on Figure 5.33 show a maximum miss rate of 29 %, observed when the interfering workload executes on one processor. When the interfering workload executes on more than one processor, the miss rate drops below 3 %. The reason for the drop in the miss rate when running the interfering workload on more than one processor is the synchronization in the operating system. Figure 5.33 shows the duration of the syscalls on Platform Intel Server increasing from an average of 12100 cycles when running on one processor to 99500 cycles when running on two processors. Figure 5.34 shows the duration of the syscalls on Platform AMD Server increasing from an average of 10700 cycles when running on one processor to 118700 cycles when running on two processors. With more processors, the duration of the syscalls grows almost linearly. c Q-ImPrESS Consortium
Dissemination Level: public
Page 55 / 210
Project Deliverable D3.3: Resource Usage Modeling
0.1
0.2
0.3
0.4
Last change: February 3, 2009
0.0
Counts of DTLB_MISSES.ANY [events − 10000 Avg]
Version: 2.0
0
1
2
3
4
5
6
7
Number of interfering processors
60 50 40 30 20
Duration of single access [cycles − 1000 Avg]
Figure 5.30: Address translation miss counter per access on Intel Server.
0
1
2
3
4
5
6
7
Number of interfering processors
Figure 5.31: Translation buffer invalidation overhead on AMD Server.
On Platform Intel Server, Experiment 5.2.2.2 estimates the penalty for data TLB miss to 9 cycles, with a miss rate of 33 % this would make the penalty 3 cycles on average. On Platform AMD Server, Experiment 5.2.2.4 estimates the penalty for data TLB miss to 40 cycles, with a miss rate of 29 % this would make the penalty 12 cycles on average. The increase in the average time for a single access from 16 cycles to 28 cycles on Platform Intel Server and from 18 to 48 cycles on Platform AMD Server is therefore not entirely due to data TLB misses. Part of the increase is due to handling the interrupt used to invalidate the address translation buffer. Effect Summary The overhead can be visible in workloads with very poor locality of data references to virtual pages that fit in the address translation buffer, when combined with workloads that frequently modify its address space.
c Q-ImPrESS Consortium
Dissemination Level: public
Page 56 / 210
Project Deliverable D3.3: Resource Usage Modeling
0.05
0.10
0.15
0.20
0.25
0.30
0.35
Last change: February 3, 2009
0.00
Counts of L1_DTLB_AND_L2_DTLB_MISS.ALL [events − 10000 Avg]
Version: 2.0
0
1
2
3
4
5
6
7
Number of interfering processors
6e+05 4e+05 2e+05 0e+00
Duration of single syscall sequence [cycles]
Figure 5.32: Address translation miss counter per access on AMD Server.
1
2
3
4
5
6
7
8
Number of processors executing syscalls
Figure 5.33: Duration of interfering workload cycle on Intel Server.
c Q-ImPrESS Consortium
Dissemination Level: public
Page 57 / 210
Project Deliverable D3.3: Resource Usage Modeling
Last change: February 3, 2009
4e+05 3e+05 2e+05 1e+05 0e+00
Duration of single syscall sequence [cycles]
5e+05
Version: 2.0
1
2
3
4
5
6
7
8
Number of processors executing syscalls
Figure 5.34: Duration of interfering workload cycle on AMD Server.
5.2.7 Modeling Notes For the address translation buffer resource, two sources of overhead were investigated by the experiments: Overhead due to competition for capacity in the pipelined composition scenario. When the number of different pages accessed by the workload increases, the likelihood of the addresses missing in the translation caches also increases. The miss introduces an overhead due to the need to perform a page walk, and, possibly also an overhead due to the page walk missing in the memory content caches. Modeling this effect therefore requires modeling the number of different pages accessed by the workload, and modeling the overhead of the page walk. Overhead due to loss of cached content in the parallel composition scenario. When the content of the translation caches is lost, the addresses miss in the translation caches. Both the associated overhead and the modeling requirements are similar to the previous effect. The existing work on performance evaluation of address translation buffers agrees that certain workloads exhibit overhead due to sharing of the translation caches [39, 41]. The overhead of misses in the translation caches is generally considered similar enough to the overhead of misses in the memory caches to warrant modeling the two caches together [40]. Given the requirements of the Q-ImPrESS project and the state of the related work, it is likely that the overhead of sharing the address translation buffers can be modeled in a manner similar to the overhead of sharing the memory content caches. It is also worth considering whether a potential for incurring a resource sharing overhead due to loss of cached content could be detected by identifying components that change the mapping between virtual and physical addresses and therefore trigger the loss of cached content.
5.3 Resource: Memory Content Caches Memory content cache is a shared resource that provides fast access to a subset of data or instructions in the main memory for all components running on the same processor core or the same processor. Whenever a component reads data from memory, the processor searches the memory caches for the data. If the data is present, it is fetched from the cache rather than directly from memory, speeding up the read. The cache is c Q-ImPrESS Consortium
Dissemination Level: public
Page 58 / 210
Project Deliverable D3.3: Resource Usage Modeling
Version: 2.0
Last change: February 3, 2009
said to hit. If the data is not present, it is fetched directly from memory and copied into the cache. The cache is said to miss. What happens when a component writes data to memory depends on whether the cache is a write-back cache or a write-through cache. With a write-back cache, the processor stores the data into the cache, speeding up the write. With a write-through cache, the processor stores the data directly in memory. Since instructions and data tend to occupy unrelated addresses, separate caches can be used for instructions and data. An access to a cache is different from an access to memory in the way data is looked up. A memory entry holds only data – there are as many memory entries as there are different addresses and given an address, the entry holding the data at that address is selected directly. A cache entry holds both data and address – there are fewer cache entries than there are different addresses and given an address, the entry holding the data at that address is found by searching multiple entries. Since circuits that search for an address are more complex and therefore slower than circuits that select based on an address, a compromise is between the two is often implemented in the form of a limited associativity cache. A limited associativity cache is organized in sets of entries. Given an address, the limited associativity cache first selects a single set that can hold the data at that address, and then searches only this set for the data at that address. The cache is said to have as many ways as there are entries in a set, a fully associative cache can be viewed as having an equal number of sets and entries. Both virtual and physical addresses can be used when searching for data. Since the virtual address is available sooner than the physical address, faster caches are more likely to be indexed using virtual addresses, while slower caches are more likely to be indexed using physical addresses. As a general rule, larger caches tend to be slower and smaller caches tend to be faster. The conflict between size and speed leads to the construction of memory architectures with multiple levels of caches. The cache levels are searched from the smallest and fastest to the largest and slowest, the higher level cache only accessed when the lower level cache misses, and the memory only accessed when the last level cache misses. The cache levels are numbered in the search order. The separation into caches for instructions and data, as well as cache sharing, may vary with the cache level. Typically, there is a separate L1 instruction cache and L1 data cache for each processor core. In contrast, the L2 cache tends to be unified, storing both instructions and data, and shared by multiple processor cores. The same goes for the L3 cache, if present. With multiple levels of caches, an inclusion policy defines how multiple levels share data. In strictly inclusive caches, the data present in a lower level must always be present in the higher level. In strictly exclusive caches, the data present in one level must never be present in another level. A mostly inclusive cache stores the data in all levels that have missed when handling a miss, but the data can later be evicted from higher levels while staying in lower levels. Rather than operating with individual bytes, caches handle data in fixed size blocks, called cache lines – a typical cache line is 64 bytes long and aligned at 64 bytes boundary. Since a cache line cannot be filled partially, a write of less than an entire cache line requires a read of the cache line. Only entire cache lines are transferred between cache levels and between cache and memory. The bus transaction that transfers a cache line from memory takes several bus cycles, each cycle transferring part of the cache line. Rather than waiting for the entire cache line to be transferred, the accessed data is delivered as soon as it arrives, with the rest of the cache line filled afterwards. With a memory subsystem implementation that transfers the cache line linearly, this would mean that the access latency depends on the position of the accessed data within the cache line. To avoid the dependency, memory subsystem implementations can transfer the cache line starting with the accessed data, employing what is called a critical word first policy. Coherency between multiple caches is enforced using various coherency protocols. A common choice is the MESI protocol, in which each cache tracks the state of each cache line by snooping the activity of the other caches. A cache that reads a line is notified by the other caches whether it is the only cache holding the particular line. A cache that writes a line notifies the other caches that it must be the only cache holding the particular line. A cache that holds a modified line flushes the line on access from other caches. c Q-ImPrESS Consortium
Dissemination Level: public
Page 59 / 210
Project Deliverable D3.3: Resource Usage Modeling
Version: 2.0
Last change: February 3, 2009
5.3.1 Platform Details 5.3.1.1 Platform Intel Server
Cache details. The memory caches are organized in a hierarchy of two levels, with dedicated L1 instruction and data caches in each processor core, and two unified L2 caches, each shared by a pair of processor cores. •
Both L1 caches are 32 KB large and 8-way associative.
•
Both L1 caches are virtually indexed and physically tagged [1, page 8-30].
•
The caches are write-back and non-inclusive [1, page 2-13] and also not exclusive (Experiment 5.3.3.6).
•
The cache line size is 64 bytes for all caches [5, page 10-5].
•
A cache miss always causes the entire line to be transfered [5, page 10-5]. Under certain circumstances (see Hardware prefetching), two cache lines can be transfered at once. The critical word first protocol [8, page 16] is used (Experiment 5.3.3.5).
•
The measured L1 data cache latency is 3 cycles and penalty for a miss is 11 cycles (Experiment 5.3.3.5), which confirms the L1 latency of 3 cycles and L2 latency of 14 cycles in [1, page 2-19].
•
The measured L1 instruction cache penalty is approximately 30 cycles including the penalty of branch misprediction (Experiment 5.3.3.5).
•
The L2 cache is 4 MB large with 16-way associativity. It is physically indexed and tagged [1, page 8-30].
•
In experiments 5.3.3.6 and 5.3.3.8 we observed a L2 cache miss penalty of 256-286 cycles beyond the L1 data cache miss penalty, including penalty of a DTLB miss and one L1 cache miss during page walk. The penalty differs with the cache line set where misses occur.
•
The penalties of TLB misses and cache misses simply add up according to experiments 5.3.3.5 and 5.3.3.6.
An important observation related to the exact parameters of the cache hierarchy is that a collision due to limited associativity does not depend on virtual addresses but only on the addresses of the physical pages allocated by the operating system. The possibility of aliasing with 256 KB strides, mentioned in [1, page 3-61], therefore only applies to operating systems that support deterministic page allocation techniques such as page coloring [15], which is currently not the case of the experimental platforms. Cache coherency. To maintain cache coherency, the processor employs the MESI protocol [5, Section 10-4]. An important feature of the MESI protocol is that transfer of modified lines between caches only happens through main memory. In particular, modified lines from L1 caches are transferred through main memory even between processors that share an L2 cache. Accessing modified lines from L1 caches of other cores is therefore similar in performance to accessing main memory [1, page 8-21]. Hardware prefetching. The mechanism which tries to detect data access patterns and prefetch them from main memory to either L1 or L2 cache automatically is described in [1, pages 2-15, 3-73 and 7-3]. There are two L1 prefetchers. •
The DCU prefetcher (also known as streaming prefetcher) detects ascending data access and fetches the following cache line.
•
The IP-based strided prefetcher detects regular forward and backwards strides (up to 2 KB) of individual load instructions by their IP.
•
The prefetches are not performed under certain conditions, including when many other load misses are in progress. There are also two L2 prefetchers.
c Q-ImPrESS Consortium
Dissemination Level: public
Page 60 / 210
Project Deliverable D3.3: Resource Usage Modeling
Version: 2.0
Last change: February 3, 2009
•
The Streamer prefetcher causes an L2 miss to fetch not only the line that missed, but the whole 128-byte aligned block of two lines.
•
The DPL (Data Prefetch Logic) prefetcher tracks regular patterns of requests that are coming from the L1 data cache.
•
It supports 12 ascending and 4 descending streams (entries of different cores are handled separately) and strides exceeding the cache line size, but within 4 KB memory pages.
•
The prefetching can get up to 8 lines ahead, depending on the available memory bus bandwidth.
•
The prefetches are not guaranteed to be performed if the memory bus is very busy. Results of experiment 5.3.8.4 indicate that prefetches are discarded also when the L2 cache itself is busy.
5.3.1.2 Platform AMD Server
Cache details. The memory caches are organized in a hierarchy of three levels, with dedicated L1 instruction and data caches, unified L2 caches, and an unified L3 cache. •
The cache line size is 64 bytes for all of the caches [13, page 189].
•
Both L1 caches are 64 KB large, 2-way associative with LRU replacement policy [13, page 223] and virtually indexed (Experiment 5.3.3.3).
•
The L1 data cache has a 3 cycles latency and an L1 miss that hits in the L2 cache incurs an 9 cycles penalty according to the vendor documentation [13, page 223]. In our experiments 5.3.3.5 and 5.3.3.7 we however observed 12 cycles penalty when missing in random cache line set and 27-40 cycles penalty when when frequent misses occur in a single cache line set.
•
The L1 instruction cache miss incurs a penalty of 20 cycles when missing in random cache line set, including partial penalty of branch misprediction and L1 ITLB miss (Experiment 5.3.3.7). Repeated misses in a single cache line set incur 25 cycles penalty each, including partial penalty of branch misprediction (Experiment 5.3.3.5).
•
The L2 and L3 caches are physically indexed according to Experiment 5.3.3.3.
•
The L2 unified cache is 512 KB large with 16-way associativity according to CPUID [12, page 291] and is an exclusive victim cache, i.e. stores only cache lines evicted from the L1 caches [13, page 223].
•
For misses in random L2 cache line sets, we observed 32 cycles penalty (including a penalty of 0.7 L1 DTLB misses) beyond the L1 miss penalty, with additional up to 3 cycles depending on the access offset in a cache line (Experiment 5.3.3.7).
•
The observed penalty when repeatedly missing in a single L2 cache line set is 16-63 cycles beyond the L1 miss penalty (Experiment 5.3.3.6).
•
The size of unified L3 cache is 2 MB, 32-way associative [12, page 291] and is a non-inclusive victim cache, i.e. stores cache lines evicted from the L2 caches. It is however not always exclusive – on hits, a copy of the data can be kept in the L3 cache if it is likely to be requested also by other cores [13, page 223] (with no further details on how this is determined).
•
For misses in random L3 cache line sets, we observed 208 cycles penalty (including a penalty of L2 DTLB miss) beyond the L2 miss penalty (Experiment 5.3.3.9).
•
The observed penalty when repeatedly missing in a single L3 cache line set is 159-211 cycles beyond the L2 miss penalty (Experiment 5.3.3.9).
Cache coherency. To maintain cache coherency, the processor employs the MOESI protocol [10, Section 7.3]. The important difference between the MOESI protocol and the MESI protocol is that transfer of modified lines c Q-ImPrESS Consortium
Dissemination Level: public
Page 61 / 210
Project Deliverable D3.3: Resource Usage Modeling
Version: 2.0
Last change: February 3, 2009
between caches happens directly rather than through main memory. In particular, modified lines are transferred directly even between processors that do not share a package, using a direct processor interconnect bus. Hardware prefetching. •
The L1 instruction cache miss triggers prefetch of the next sequential line along with the requested line [13, page 223].
•
The L1 data cache has a unit-stride prefetcher, triggered by two consecutive L1 cache line misses, initially prefetching fixed number of lines ahead. Further accesses with the same stride increase the number of lines the prefetcher gets ahead [13, page 100].
5.3.2 Sharing Effects The effects that can influence the quality attributes when multiple components share a memory cache include: •
Components compete for the cache capacity. This is evidenced both in increased overhead, when data that would normally be cached for a component are evicted due to activity of another, and decreased overhead, when data that would normally be flushed by a component are flushed due to activity of another. Competition for cache capacity can be emphasized when associativity sets are not used evenly by the components. Since the choice of associativity sets is often made incidentally during data allocation, the effect of competition for cache capacity can change each data allocation.
•
Components compete for the cache bandwidth. This is evidenced in increased overhead in workloads that do not compensate the sharing effects by parallel execution, and in workloads that employ prefetching.
Even when memory caches are not shared by multiple processors, workload influence can still occur due to cache coherency protocols. Accessing the same data from multiple processors causes data that would normally reside in exclusively owned cache lines to reside in shared cache lines. This can have performance impact: •
Writes to a shared cache line are slower than writes to what would otherwise be an exclusively owned cache line. The writer has to announce the write on the memory bus and thus invalidate the other copies of the shared cache line first.
•
Subsequent reads from an invalidated cache line are slower than reads from what would otherwise be an exclusively owned cache line.
•
On some architectures, a read from a cache line invalidated by a remote write also causes the remote modifications to be flushed to memory. This can cause apparent performance changes on the remote node since flushing would otherwise be done synchronously with other operations of the remote node.
•
On some architectures, a read from a cache line invalidated by a remote write fetches data from the remote node rather than from the memory bus.
5.3.3 Platform Investigation Experiments in this section are performed to determine or validate our understanding of both quantitative aspects of memory caches and various details affecting their operation, in order to determine how sharing might affect the caches and what performance impact we can expect. In particular, we are interested in the following properties: Cache line size Determines what amount of data needs to be transferred as a result of a single cache miss. We also need to know it to set the right access stride in the later experiments. Although the line size is specified in the vendor documentation, the adjacent line prefetch feature may result in different perceived cache line size, as our experiment shows. c Q-ImPrESS Consortium
Dissemination Level: public
Page 62 / 210
Project Deliverable D3.3: Resource Usage Modeling
Version: 2.0
Last change: February 3, 2009
Cache set indexing Caches line sets may be indexed using either virtual or physical addresses. This knowledge is needed for experiments based on repeated accesses in the same cache line set. It is not always specified in the vendor documentation. Cache miss penalty Determines the maximum theoretical slowdown of a single memory access due to cache sharing. It is not specified for all caches in the vendor documentation, in some cases it is specified using a combination of processor and memory bus cycles. The penalty may also depend on the offset of the access in a cache line, if critical word first protocol is not used, which is also not definitely specified. Cache associativity Determines the number of cache lines with addresses of a particular fixed stride, that may simultaneously reside in the cache. It is generally well specified, our experiments that determine the miss penalty also confirm these specifications. Inclusion policy Determines whether the cache sizes effectively add up, as well as their associativity. It is not always specified in the vendor documentation. 5.3.3.1 Experiment: Cache line sizes
The first experiment determines the cache line size of all available caches. It does so by an interleaved execution of a measured workload that randomly accesses half of the cache lines with an interfering workload that randomly accesses all cache lines, using code from Listing 5.1 and 5.5 for data caches and 5.7 and 5.5 for instruction caches. The measured workload uses the lowest possible access stride, which is 8 B for 64 bit aligned data reads and 16 B to fit the jump instruction opcode. The interfering workload varies its access stride. When the stride exceeds the cache line size, the interference should stop accessing some cache lines, which should be observed as a decrease in the measured workload duration, compared to the situation when the interfering workload accesses all cache lines. Purpose
Determine or confirm the cache line sizes of all memory caches in the processor.
Measured Time to perform a single memory access in random pointer walk from Listing 5.1 and 5.5 for the data caches and unified caches. Time to execute a jump instruction in random jump instruction chain from Listing 5.7 and 5.5 for the L1 instruction cache. Parameters Intel Server Allocated: 16 KB, 2 MB; accessed: 16 KB (code and data), 2 MB (data only); stride: 8 B data, 16 B code. AMD Server Allocated: 32 KB, 320 KB, 1600 KB; accessed: 32 KB (code and data), 320 KB, 1600 KB (data only); stride: 8 B data, 16 B code. Interference The same as the measured workload. Intel Server Allocated: 32 KB, 4 MB; accessed: 32 KB, 4 MB; stride: 8 B (16 B for code) to 512 B (exponential step). AMD Server Allocated: 64 KB, 576 KB, 2624 KB; accessed: 64 KB, 576 KB, 2624 KB; stride: 8 B (16 B for code) to 512 B (exponential step). Expected Results The memory range sizes (16 KB and 2 MB on Platform Intel Server, 32 KB, 576 KB and 2624 KB on Platform AMD Server) for the measured pointer walk are set so that they fit in a half of the L1, L2 and L3 (on Platform AMD Server) cache, respectively. The range sizes for the interfering code are set so that they evict the whole L1, L2 and L3 cache (although not entirely due to associativity). Note that on the Platform AMD Server we add up cache sizes of all lower levels to the cache size of a given level due to the exclusive policy. The interfering code should therefore evict the data accessed by the measured code as long as its access stride is lower or equal to the cache line size and the measured code should be affected the same. When the access stride of the interfering pointer walk exceeds the cache line size, some lines will not be evicted and we should see an increased performance of the measured code. Measured Results The results with 16 KB measured / 32 KB interfering memory ranges accessed by the data variant on Platform Intel Server (Figure 5.35) show a decrease in memory access duration in the measured c Q-ImPrESS Consortium
Dissemination Level: public
Page 63 / 210
Project Deliverable D3.3: Resource Usage Modeling
5.5
6.0
6.5
Last change: February 3, 2009
5.0
Duration of access [clocks − 2048 Avg]
Version: 2.0
8
16
32
64
128
256
Interfering workload access stride [bytes]
Figure 5.35: The effect of interfering workload access stride on the L1 data cache eviction on Intel Server.
0.12 0.06
0.08
0.10
L1D_REPL L2_LD:SELF:MESI
0.04
Event counts [events − 2048 Avg Trim]
Event counters
10
20
50
100
200
Interfering workload access stride [bytes]
Figure 5.36: The effect of interfering workload access stride on the L1 data cache eviction on Intel Server – related performance events.
code when the access stride of the interfering code is 128 B or more. The L1 miss and L2 hit event counters (Figure 5.36) show a similar decrease, the number of L2 misses and all prefetch counters are always zero. We can conclude that the line size of the L1 data cache is 64 B, as the vendor documentation states [1, page 2-13]. The results of the instruction cache variant (Figure 5.37) show a decrease of the L1 instruction cache misses with 128 B and higher stride of the interfering code and thus also confirm the 64 B cache line size. The results with 2 MB / 4 MB memory ranges on Platform Intel Server (Figure 5.38) indicate that the cache line size of the L2 cache is 128 B, which should not be the case according the vendor documentation. The reason for the results is the Streamer prefetcher [1, page 3-73] which causes the interfering code to fetch two lines to the L2 cache in case of a miss, even though the second line is not being accessed. This therefore c Q-ImPrESS Consortium
Dissemination Level: public
Page 64 / 210
Project Deliverable D3.3: Resource Usage Modeling
0.10
0.15
0.20
0.25
0.30
0.35
Last change: February 3, 2009
0.05
Counts of L1I_MISSES [events − 1024 Avg]
Version: 2.0
16
32
64
128
256
Interfering workload access stride [bytes]
40 38 36 34 32 30 28
Duration of access [cycles − 256K Avg]
42
Figure 5.37: The effect of interfering workload access stride on the L1 instruction cache eviction on Intel Server.
8
16
32
64
128
256
Interfering workload access stride [bytes]
Figure 5.38: The effect of interfering workload access stride on the L2 cache eviction on Intel Server.
causes two cache lines occupied by the measured code to be evicted, which is the same effect as an interference with 64 B stride. The L2 LINES IN:PREFETCH event counter values obtained during the interfering code execution rather than the measured code execution (Figure 5.39) also confirm that L2 cache misses triggered by prefetches occur. The results from Platform AMD Server for all cache levels and types show a decrease in memory access duration in the measured code when access stride of the interfering code is 128 B or more. The changes in access duration and performance counters are similar to those in Figure 5.35 from Platform Intel Server. We can conclude that the line size is 64 B for all cache levels, as the vendor documentation states [13, page 189], and that there is no adjacent line prefetch as on Platform Intel Server. c Q-ImPrESS Consortium
Dissemination Level: public
Page 65 / 210
Project Deliverable D3.3: Resource Usage Modeling
0.2
0.3
0.4
0.5
Last change: February 3, 2009
0.1
Counts of L2_LINES_IN:PREFETCH [events − 256K Avg]
Version: 2.0
8
16
32
64
128
256
Interfering workload access stride [bytes]
Figure 5.39: Streamer prefetches triggered by the interfering workload during the L2 cache eviction on Intel Server.
5.3.3.2 Experiment: Streamer prefetcher, Intel Server
To examine the behavior of the Streamer prefetcher and to verify that the Streamer prefetcher could indeed account for the results of Experiment 5.3.3.1, we have performed a slightly modified experiment to determine which two lines are fetched together. Purpose Determine whether the L2 cache Streamer prefetcher on Intel Server fetches always the cache line that forms a 128 B aligned pair with the requested line. Measured Parameters Interference
Time to perform a single memory access in random pointer walk from Listing 5.1 and 5.5. Allocated: 4 MB; accessed: 4 MB; stride: 256 B; offset: 0 B Random pointer walk: Allocated: 4 MB; accessed: 4 MB; stride: 256 B; offset: 0, 64, 128, 192 B
Expected Results Depending on the offset that the interfering workload uses, its accesses either map to the same associativity set as the measured workload, or not. The offset of 0 B should always evict lines accessed by the measured code, the offset of 128 B should always avoid these lines. If the Streamer prefetcher always fetches lines a 128 B aligned pair of cache lines, using the 64 B offset should also evict lines of the measured code, and the 192 B offset should avoid them. Measured Results The results (Figure 5.40 and 5.41) show that with 128 B and 192 B offsets the interfering code does not evict lines of the measured code while with 0 B and 64 B offsets it does. This indicates that the Streamer prefetch does always fetch 128 B aligned pair cache lines. Note that the relatively small difference between 0 B and 64 B offsets does not contradict this. Setting a 64 B the offset to the measured code (instead of 0 B) just exchanges the results of 0 B and 64 B interfering code offsets, not affecting the 128 B and 192 B offsets. The difference can be instead explained by the fact that the Streamer prefetch is triggered only by a L2 miss and because the interfering code does not always miss with these parameters, there are less accesses (and thus less evictions) in the pair line than to the requested line. When the memory accessed by the interfering workload is increased to 8 MB and its number of L2 misses approaches 1 miss per access, the difference between 0 B and 64 B offset diminishes. The presence of the Streamer prefetcher on Intel Server poses a problem for selecting the right access stride for the random pointer walk (Listing 5.5). c Q-ImPrESS Consortium
Dissemination Level: public
Page 66 / 210
Project Deliverable D3.3: Resource Usage Modeling
150
200
Last change: February 3, 2009
100
Duration of access [cycles − 16K Avg]
Version: 2.0
0
64
128
192
Interfering workload offset [bytes]
0.8 0.6 0.4 0.2
Counts of L2_LINES_IN:SELF [events − 16K Avg]
Figure 5.40: The effect of access offset on the L2 streamer prefetch, Intel Server.
0
64
128
192
Interfering workload offset [bytes]
Figure 5.41: The effect of access offset on the L2 streamer prefetch - L2 cache misses, Intel Server.
Using a stride of 64 B could cause additional lines to be fetched to the cache in case the parameters are set so that only a subset of the allocated memory is accessed. It is however no issue when the parameters are set to access all cache lines in the allocated memory. Using a 128 B stride would cause only even lines to be fetched to the L1 cache, which does not use this kind of prefetcher. It also does not guarantee the pair line to be fetched to the L2 in case the line being accessed does not miss, or the prefetch is discarded. A universal solution would be to use a stride of 128 B to work with the whole pair, but access both lines in the pair to ensure that both are fetched in both cases. This would however trigger the stride-based prefetcher and access additional cache lines. We will therefore use the 64 B access stride in most of the experiments, keeping in mind the extra accesses this might cause. c Q-ImPrESS Consortium
Dissemination Level: public
Page 67 / 210
Project Deliverable D3.3: Resource Usage Modeling
Version: 2.0
Last change: February 3, 2009
5.3.3.3 Experiment: Cache set indexing
The following experiments test whether the caches are virtually or physically indexed. We need to know this information for the later experiments that determine cache miss penalties by triggering cache misses in a single cache line set by accesses with a particular stride. On physically indexed caches however the cache line set is determined by a physical frame number rather than a virtual address. This is a problem on our experimental platforms where the operating system does not assign physical frames in a deterministic or directly controllable way. To work around this limitation, we have developed a special memory allocation function based on page coloring [15], which assigns virtual colors to both virtual pages and physical frames and ensures that each virtual page is mapped to a physical frame with the same color. The color is determined by the least significant bits in the virtual page or physical frame number, the number of colors is selected so that cache lines in pages with the same color map to the same cache line sets in the particular cache. For example, the L2 cache on Platform Intel Server is 4 MB large with 16-way associativity, which yields a stride of 256 KB needed to be mapped to the same cache line set [1, page 3-61]. With 4 KB page size, this yields 64 different colors, i.e. the 6 least significant bits in the page or frame number determine the color. Although the operating system on our experimental platforms does not support page coloring or other deterministic physical frame allocation, recent Linux kernel versions provide a way for the executed program to determine its current mapping by reading the special /proc/self/pagemap file. Our page color aware allocator thus uses this information together with the mremap function to (1) allocate a continuous virtual memory area, (2) determine its mapping and (3) remap the allocated pages one by one to a different virtual memory area with the target virtual addresses having the same color as the determined physical frame numbers. This way the allocator construct a continuous virtual memory area with virtual pages having the same color as the page frames being mapped to. Note that (1) this is possible thanks to the mremap keeping the same physical frame and (2) the memory area we allocate in the first step provides enough physical frames of each color. In our experiments, allocating twice the needed memory in the first step showed to be sufficient. This allocator is used in the following experiment to determine which caches are virtually or physically indexed, and in all experiments that rely on stride of accesses to a physically indexed cache. Note that we do not have to perform this experiment for the L1 caches on Platform Intel Server – the 32 KB size and 8-way associativity mean that all pages map to the same cache line sets. Purpose
Determine whether the caches are virtually or physically indexed.
Measured Time to perform a single memory access in set collision pointer walk from Listing 5.1 and 5.6 for the data caches and unified caches. Time to execute a jump instruction in set collision jump instruction chain from Listing 5.7 and 5.5 for the L1 instruction cache. The buffer for the experiment using either standard allocator or page coloring allocator. The number of allocated and accessed pages is selected so that it exceeds the cache associativity. Parameters Intel Server, L2 Pages allocated: 32; access stride: 64 pages (4 MB L2 cache size divided by 16 ways); pages accessed: 1-32; page colors: none / 64. AMD Server, L1 and L2 Pages allocated: 32; access stride: 8 pages (64 KB L1 cache size divided by 2 ways and 512 MB L2 cache size divided by 16 ways); pages accessed: 1-32; page colors: none / 8. Expected Results If a particular cache is virtually indexed, the results should show an increase in access duration when the number of accesses exceeds the associativity both when using and not using page coloring aware allocation. If the cache is physically indexed and page color based allocation is not used, there should be no such increase in access duration because the stride in virtual addresses does not imply the same stride in physical addresses. Measured Results The results from Platform Intel Server (Figure 5.42) show that page color based allocation is needed to trigger L2 cache misses – the L2 cache is therefore physically indexed. We can also see that 32 accesses in one cache line set are not enough to achieve 100 % L2 cache misses, probably due to a c Q-ImPrESS Consortium
Dissemination Level: public
Page 68 / 210
Project Deliverable D3.3: Resource Usage Modeling
Last change: February 3, 2009
200
Page colors
50
100
150
0 64
0
Duration of access [cycles − 1000 walks Avg Trim]
Version: 2.0
0
5
10
15
20
25
30
Number of accesses mapping to the same L2 cache set
100
Page colors
20
40
60
80
None 8
0
Duration of access [cycles − 1000 walks Avg Trim]
Figure 5.42: Dependency of associativity misses in L2 cache on page coloring on Intel Server.
0
5
10
15
20
25
30
Number of accesses mapping to the same L1/L2 cache set
Figure 5.43: Dependency of associativity misses in L1 data and L2 cache on page coloring on AMD Server.
replacement policy not being close to LRU enough – the experiment measuring its miss penalty will therefore access 128 pages. The results from Platform AMD Server (Figure 5.43) also show that page coloring is needed to trigger L2 cache misses with 19 and more accesses. Page coloring also seems to make some difference for the L1 data cache, but values of the events counters (Figure 5.44) show that L1 data cache misses occur both with and without page coloring and the difference in the observed duration is therefore caused by something else. The L1 data cache is therefore virtually indexed and the L2 cache is physically indexed, which implies that the L3 cache is also physically indexed. The results of code fetching variant yield similar results for the L1 instruction cache as for the data cache, it is therefore also virtually indexed. c Q-ImPrESS Consortium
Dissemination Level: public
Page 69 / 210
Project Deliverable D3.3: Resource Usage Modeling
2.0
Last change: February 3, 2009
Event counters
0.5
1.0
1.5
DATA_CACHE_MISSES DATA_CACHE_MISSES (page coloring) L2_CACHE_MISS:DATA L2_CACHE_MISS:DATA (page coloring)
0.0
Event counter values [events − 1000 walks Avg Trim]
Version: 2.0
0
5
10
15
20
25
30
Number of accesses mapping to the same L1/L2 cache set
Figure 5.44: Dependency of associativity misses in L1 data and L2 cache on page coloring on AMD Server – performance counters.
5.3.3.4 Miss Penalties
The following experiments determine the penalties of misses in all levels of the cache hierarchy and their possible dependency on the offset of accesses triggering the misses. We again use the pointer walk (Listing 5.1) for the measured workload and create the access pattern so that all accesses map to the same cache line set. For this we can reuse the same pointer walk initialization code as for the TLB experiments (Listing 5.6) because the stride we need (cache size divided by number of ways) is always a multiple of the 4 KB page size on all of our platforms. The difference here is that we do not use the offset randomization because we need the same cache line offset in a page. Some experiments however set a fixed non-zero offset to determine whether it influences the miss penalty. 5.3.3.5 Experiment: L1 cache miss penalty
Purpose Determine the cache miss penalty in L1 instruction and L1 data caches and whether it depends on the offset of the accessed word in the cache line. Measured Time to perform a single memory access in set collision pointer walk from Listing 5.1 and 5.6 for the data caches and unified caches. Time to execute a jump instruction in set collision jump instruction chain from Listing 5.7 and 5.5 for the L1 instruction cache. Parameters Intel Server Pages allocated: 32; access pattern stride: 1 page (32 KB cache size divided by 8 ways). Miss penalty Pages accessed: 1-32; access offset: 0. Offset dependency Pages accessed: 10; access offset: 0-128 B (8 B step). AMD Server Pages allocated: 32; access pattern stride: 8 pages (64 KB cache size divided by 2 ways). Miss penalty Pages accessed: 1-32; access offset: 0. Offset dependency Pages accessed: 1-4; access offset: 0-64 B (8 B step). Expected Results The accesses should not cause L1 cache misses until the number of accessed pages reaches the number of associativity ways, and then start causing L1 cache misses. The exact behavior depends on how the replacement policy behaves with our access pattern. c Q-ImPrESS Consortium
Dissemination Level: public
Page 70 / 210
Project Deliverable D3.3: Resource Usage Modeling
10
15
Last change: February 3, 2009
5
Duration of access [cycles − 1000 walks Avg]
Version: 2.0
1
3
5
7
9
11
13
15
17
19
21
23
25
27
29
31
Number of accesses mapping to the same L1 cache set
1.0 0.8
Event counters
0.2
0.4
0.6
DTLB_MISSES:L0_MISS_LD L1D_ALL_REF L1D_REPL L2_LINES_IN:SELF L2_LD:SELF:MESI
0.0
Number of events per access [events − 1000 walks Avg Trim]
Figure 5.45: L1 data cache miss penalty on Intel Server.
0
5
10
15
20
25
30
Number of accesses mapping to the same L1 cache set
Figure 5.46: Performance event counters related to L1 data cache miss penalty on Intel Server.
Measured Results The results of the data access variant from Platform Intel Server (Figure 5.45) show an increase from 3 to 14 cycles between 8 and 10 accesses. The fact that this increase is not immediate between 8 and 9 accesses suggests that the replacement policy is probably not a true LRU. The L1D REPL (L1 data cache misses) event counter (Figure 5.46) increases from 0 to 1 as well as the L2 LD (L2 cache loads) event counter and there are no L2 cache miss events (L2 LINES IN). The L1 cache miss penalty is thus 11 cycles. The subsequent increase from 14 to 16 cycles per access is caused by DTLB0 misses (unavoidable due to its limited size, as the respective event counter shows), which means the DTLB0 miss penalty of 2 cycles (see Experiment 5.2.2.3) adds up to the L1 data cache miss penalty. As Figure 5.47 shows, the penalty does not depend on the access offset. The results of the code access variant (Figure 5.48) show an increase from approximately 3 cycles per jump c Q-ImPrESS Consortium
Dissemination Level: public
Page 71 / 210
Project Deliverable D3.3: Resource Usage Modeling
13.0
13.5
14.0
14.5
15.0
15.5
16.0
Last change: February 3, 2009
12.5
Duration of access [cycles − 1000 walks Avg]
Version: 2.0
0
8
16
24
32
40
48
56
64
72
80
88
96
104
120
Offset of access in a cache line [bytes]
40 30 20 10 0
Duration of access [cycles − 1024 walks Avg]
Figure 5.47: Dependency of L1 data cache miss penalty on access offset in a cache line on Intel Server.
1
3
5
7
9
11
13
15
17
19
21
23
25
27
29
31
Number of accesses mapping to the same L1 instruction cache line set
Figure 5.48: L1 instruction cache miss penalty on Intel Server.
instruction to 33 cycles between 6 and 11 jump instructions. The performance counters (Figure 5.49) show that this is caused by L1 instruction cache misses and also mispredicted branches. The penalty of the L1 miss with the misprediction is thus approximately 30 clock cycles. The results of the data access from Platform AMD Server (Figure 5.50) show an increase in access duration from 3 to 43 cycles between 2 and 3 accesses which confirms the 2-way associativity. The 3 cycles latency for an L1 cache hit confirms the vendor documentation [13, page 223]. The performance counters (Figure 5.51) confirm that 3 and more accesses cause L1 misses and no L2 misses. The penalty is however excessively high for an L1 miss – the vendor documentation states a 9 cycles L2 access latency [13, page 223]. The duration per access then decreases at 4 accesses, after which it remains approximately at 30 cycles. Note that in Experiment 5.3.3.3 we saw that this decrease does not occur when page color allocation is used. The c Q-ImPrESS Consortium
Dissemination Level: public
Page 72 / 210
Project Deliverable D3.3: Resource Usage Modeling
Last change: February 3, 2009
Event counters
0.5
1.0
1.5
L1I_MISSES BR_IND_MISSP_EXEC
0.0
Counts of events [events − 1024 walks Avg Trim]
Version: 2.0
0
5
10
15
20
25
30
Number of accesses mapping to the same L1 instruction cache line set
40 30 20 10 0
Duration of access [cycles − 1000 walks Avg]
Figure 5.49: Performance event counters related to L1 instruction cache miss penalty on Intel Server.
1
3
5
7
9
11
13
15
17
19
21
23
25
27
29
31
Number of accesses mapping to the same L1 cache set
Figure 5.50: L1 data cache miss penalty when accessing a single cache line set on AMD Server.
DISPATCH STALL FOR LS FULL event counter (Figure 5.52) indicates what causes these penalties and as Experiment 5.3.3.7 shows, the penalty is not so high if the misses are not concentrated in a single cache line set. Another unexpected results is that the REQUESTS TO L2:DATA event counter shows 2 L2 cache accesses per one pointer access for 3 accesses. For this platform we will therefore keep using the single cache line set access pattern to confirm number of associativity ways and to determine the upper limit of the cache miss penalty, and a lower bound of the cache miss penalty will be determined by accessing random cache line sets instead of a single one. Note that we observed no dependency of the penalty on the access offset when accessing a single cache line set, however as it could be masked by the anomaly, we will also measure it in Experiment 5.3.3.7. The result of instruction fetch variant on Platform AMD Server (Figure 5.53) show an increase from 5 to 30 c Q-ImPrESS Consortium
Dissemination Level: public
Page 73 / 210
Project Deliverable D3.3: Resource Usage Modeling
2.0
Last change: February 3, 2009
Event counters
0.5
1.0
1.5
DATA_CACHE_MISSES L2_CACHE_MISS:DATA REQUESTS_TO_L2:DATA
0.0
Counts of events [events − 1000 walks Avg Trim]
Version: 2.0
0
5
10
15
20
25
30
Number of accesses mapping to the same L1 cache set
40 30 20 10 0
Counts of DISPATCH_STALL_FOR_LS_FULL [events − 100 walks Avg]
Figure 5.51: Performance event counters related to L1 data cache misses when accessing a single cache line set on AMD Server.
1
3
5
7
9
11
13
15
17
19
21
23
25
27
29
31
Number of accesses mapping to the same L1 cache set
Figure 5.52: Dispatch Stall for LS Full events when accessing a single cache line set on AMD Server.
c Q-ImPrESS Consortium
Dissemination Level: public
Page 74 / 210
Project Deliverable D3.3: Resource Usage Modeling
10
20
30
40
50
Last change: February 3, 2009
0
Duration of access [cycles − 1024 walks Avg]
Version: 2.0
1
3
5
7
9
11
13
15
17
19
21
23
25
27
29
31
Number of accesses mapping to the same L1 instruction cache line set
Event counters
0.5
1.0
1.5
INSTRUCTION_CACHE_MISSES RETIRED_MISPREDICTED_BRANCH_INSTRUCTIONS
0.0
Counts of events [events − 1024 walks Avg Trim]
Figure 5.53: L1 instruction cache miss penalty when accessing a single cache line set on AMD Server.
0
5
10
15
20
25
30
Number of accesses mapping to the same L1 instruction cache line set
Figure 5.54: Performance event counters related to L1 instruction cache miss penalty when accessing a single cache line set on Intel Server.
cycles at 3 jump instructions, confirming the 2-way associativity of the L1 instruction cache. The performance counters (Figure 5.54) show that instruction cache misses occur along with some amount of mispredicted branch predictions. Note that the INSTRUCTION CACHE MISSES event counter shows somewhat higher values than expected, which could be caused by speculative execution. The penalty of L1 instruction miss (when accessing a single cache line set) is 25 cycles including the mispredicted branch prediction penalty. Open Issues The exact reason why cache misses in a single L1 cache line set cause significantly higher penalties than misses spreading over multiple sets remains an open question. c Q-ImPrESS Consortium
Dissemination Level: public
Page 75 / 210
Project Deliverable D3.3: Resource Usage Modeling
Version: 2.0
Last change: February 3, 2009
5.3.3.6 Experiment: L2 cache miss penalty
Purpose Determine the L2 cache miss penalty and whether it depends on the offset of the accessed word in the cache line. Measured
Time to perform a single memory access in set collision pointer walk from Listing 5.1 and 5.6.
Parameters Intel Server Pages allocated: 128; access stride: 64 pages (4 MB cache size divided by 16 ways); page colors: 64. Miss penalty Pages accessed: 1-128; access offset: 0 B. Offset dependency Pages accessed: 128; access offset: 0-128 B (8 B step). AMD Server Pages allocated: 32; access stride: 8 pages (512 KB cache size divided by 16 ways); page colors: 8. Miss penalty Pages accessed: 1-32; access offset: 0 B. Offset dependency Pages accessed: 18-20; access offset: 0-128 B (8 B step). Expected Results The accesses should not cause L2 cache misses until the number of accessed pages reaches the number of associativity ways, and then start causing cache misses. Because the stride needed to map into the same L2 cache line set is the same as for the L1 DTLB on Platform Intel Server (see Experiment 5.2.2.2), we should also observe L1 DTLB misses and will have to subtract their already known penalty to obtain the L2 cache miss penalty. On Platform Intel Server the fully associative L1 DTLB with its 48 entries should be able to hold translations for all 32 accesses at once. Measured Results The results from Platform Intel Server (Figure 5.55) show an increase from 3 to 12 cycles at 5 accesses due to the DTLB misses (event counters in Figure 5.56), matching the results of Experiment 5.2.2.2. Between 8 and 10 accesses, the duration per access increases to 23 cycles due to the L1 data cache misses, which thus add up to the DTLB misses. Starting from 17 accesses we can see a rapid increase in access duration, matched by the L2 LINES IN:SELF (L2 cache misses) event counter. This confirms the 16-way associativity of the L2 cache and that the policy is not exclusive, otherwise the number of ways in the L1 and L2 would effectively add up. The change from zero misses per access to one miss per access is however not immediate, which suggests that the replacement policy is not true LRU. Aside from the L2 cache misses, the access latency is further increased by the L1 data cache misses caused by page walks, as the L1D REPL and PAGE WALKS:CYCLES (Figure 5.57) event counters show. At around 80 accesses we see another sudden increase in latency up to 300 cycles per access. However, no performance event counter related to caches explains this change. The results of the cache line offset dependency (Figure 5.58) show that the L2 cache miss penalty does not depend on the offset of the access inside one cache line. However, the results hint at a possible dependency of the L2 miss penalty on the cache line set used. This is further investigated in the next experiment. The results from Platform AMD Server (Figure 5.59) again exhibit unusually high durations as in Experiment 5.3.3.5. We can see again an increase from 3 to 43 cycles when the number of L1 cache ways is exceeded. Between 18 and 19 accessed pages we see an increase from 43 to 106 cycles followed by a decrease to around 59 cycles, which is the penalty of extra 16-63 cycles for misses in a single cache line set. The performance event counters (Figure 5.60) show that the increase is caused by L2 cache misses, but strangely reports 2 per access misses for 19 accesses. The fact that the increase occurs between 18 and 19 accessed pages confirms the 16-way associativity and the exclusive policy, where the effective cache sizes of caches at different levels add up. We observed no dependency of the penalty on the access offset with 18 and 19 accessed pages, there is however some interesting dependency with 20 accessed pages. As Figure 5.61 shows, the duration of access varies between 54 and 59 cycles depending on the offset. Open Issues The exact reason why cache misses in a single L2 cache line set cause significantly higher penalties than misses spreading over multiple sets remains open, as well as the reported 2 misses per access for 19 accesses. c Q-ImPrESS Consortium
Dissemination Level: public
Page 76 / 210
Project Deliverable D3.3: Resource Usage Modeling
50
100
150
200
250
300
Last change: February 3, 2009
0
Duration of access [cycles − 1000 walks Avg]
Version: 2.0
1 6 12
19
26
33
40
47
54
61
68
75
82
89
96
104
113
122
Number of accesses mapping to the same L2 cache line set
2.0 1.5 1.0 0.5
Event counters DTLB_MISSES:ANY L1D_ALL_REF L1D_REPL L2_LINES_IN:SELF
0.0
Counts of events [events − 1000 walks Avg Trim]
Figure 5.55: L2 cache miss penalty on Intel Server.
0
20
40
60
80
100
120
Number of accesses mapping to the same L2 cache line set
Figure 5.56: Performance events related to L2 cache miss penalty on Intel Server.
5.3.3.7 Experiment: L1 and L2 cache random miss penalty, AMD Server
Purpose Determine the L1 and L2 cache miss penalty when accessing random cache line sets, and whether it depends on the offset of the accessed word in the cache line on Platform AMD Server Measured Time to perform a single memory access in random pointer walk from Listing 5.1 and 5.5 for the data caches and unified caches. Time to execute a jump instruction in random jump instruction chain from Listing 5.7 and 5.5 for the L1 instruction cache. Parameters
L1 Miss penalty Allocated: 128 KB; accessed: 16-128 KB (16 KB step); stride: 64 B.
L1 Offset dependency Allocated: 128 KB; accessed: 128 KB; stride: 64 B; access offset: 0-56 B (8 B step). L2 Miss penalty Allocated: 640 KB; accessed: 64-640 KB (32 KB step); stride: 64 B. c Q-ImPrESS Consortium
Dissemination Level: public
Page 77 / 210
Project Deliverable D3.3: Resource Usage Modeling
5
10
15
20
Last change: February 3, 2009
0
Counts of PAGE_WALKS:CYCLES [events − 1000 walks Avg]
Version: 2.0
1 6 12
19
26
33
40
47
54
61
68
75
82
89
96
104
113
122
Number of accesses mapping to the same L2 cache line set
295 290 285 280 275 270
Duration of access [cycles − 1000 Walks Avg]
300
Figure 5.57: Cycles spent by page walks when accessing a single L2 cache line set on Intel Server.
0
8
16
24
32
40
48
56
64
72
80
88
96 104
120
Offset of access in 3 adjacent cache line sets [bytes]
Figure 5.58: Dependency of L2 cache miss penalty on access offset in a cache line in two adjacent cache line sets on Intel Server.
c Q-ImPrESS Consortium
Dissemination Level: public
Page 78 / 210
Project Deliverable D3.3: Resource Usage Modeling
20
40
60
80
100
Last change: February 3, 2009
0
Duration of access [cycles − 1000 walks Avg]
Version: 2.0
1
3
5
7
9
11
13
15
17
19
21
23
25
27
29
31
Number of accesses mapping to the same L2 cache set
2.0
Event counters
0.5
1.0
1.5
DATA_CACHE_MISSES L1_DTLB_MISS_AND_L2_DTLB_HIT: L2_4K_TLB_HIT L2_CACHE_MISS:DATA
0.0
Counts of events [events − 1000 walks Avg Trim]
Figure 5.59: L2 cache miss penalty when accessing a single cache line set on AMD Server.
0
5
10
15
20
25
30
Number of accesses mapping to the same L2 cache set
Figure 5.60: Performance event counters related to L2 cache misses when accessing a single cache line set on AMD Server.
c Q-ImPrESS Consortium
Dissemination Level: public
Page 79 / 210
Project Deliverable D3.3: Resource Usage Modeling
54
56
58
60
Last change: February 3, 2009
52
Duration of access [cycles − 1000 walks Avg]
Version: 2.0
0
8
16
24
32
40
48
56
64
72
80
88
96 104
120
Offset of access in 3 adjacent cache line sets [bytes]
Figure 5.61: Dependency of L2 cache miss penalty on access offset in a cache line in two adjacent cache line sets, when accessing 20 cache lines in the same set on AMD Server.
L2 Offset dependency Allocated: 640 KB; accessed: 640 KB; stride: 64 B; access offset: 0-56 B (8 B step). Expected Results The amount of allocated memory is selected to exceed the L1 cache size but fit in the L2 cache size or to exceed the L1 + L2 cache size but fit in the L3 cache size, respectively. As we increase the amount of accessed cache lines, the ratio of L1 or L2 cache misses and thus the duration per one access should increase. Accessing the whole allocated memory buffer should cause 100 % L1 or L2 cache misses. After subtracting the 3 cycles duration per L1 data cache hit that we observed in the previous experiment, we should obtain the L1 data cache miss penalty for accesses to random cache lines. Similarly we obtain the L2 cache miss penalty. Measured Results The results for the L1 data cache (Figure 5.62) show an expected increase of duration per access as the number of accesses increases. Values of related performance event counters (Figure 5.63) confirm that we observe L1 data cache misses, L2 cache hits and no L1 DTLB misses. Accessing the whole memory buffer causes an L1 miss for each access and costs 15 cycles, which yields a penalty of 12 cycles. Note that this is still somewhat higher than the 9 cycles stated in vendor documentation [13, page 223]. The results for the L1 instruction cache (Figure 5.64) show a gradual increase up to 25 cycles per access. Values of related performance event counters (Figure 5.65) show that it is caused by L1 instruction cache misses and partially also mispredicted branch instructions and L1 ITLB misses. The penalty of the L1 miss is thus 20 cycles when accessing random cache line sets, including the overhead of the partial ITLB misses and branch mispredictions. The results for the L2 cache (Figure 5.66) show an increase to 47 cycles per access when accessing the whole 640 KB of allocated buffer. The performance event counters (Figure 5.67) show that it is caused by L2 cache misses as expected but also by 0.7 L1 DTLB misses in average. One L1 DTLB miss per access could theoretically add 5 cycles to the penalty (Experiment 5.2.2.2). The L1 DTLB misses are inevitable when accessing such amount of memory, the L2 DTLB is however sufficient. The penalty of the L2 cache miss including the L1 DTLB miss overhead is therefore 32 cycles in addition to the L1 cache miss. The L1 miss penalty does not depend on the access offset. We however observed a small dependency on the access offset in a L2 cache line (Figure 5.68). The access duration increases with each 16 B of the offset and can add almost 3 cycles to the L2 miss penalty. c Q-ImPrESS Consortium
Dissemination Level: public
Page 80 / 210
Project Deliverable D3.3: Resource Usage Modeling
Last change: February 3, 2009
14 12 10 8 6 4
Duration of access [cycles − 1 walk Avg]
16
Version: 2.0
16384
32768
49152
65536
81920
98304
114688
131072
Amount of data accessed [bytes]
0.2
0.4
0.6
0.8
Event counters DATA_CACHE_MISSES L2_CACHE_MISS:DATA REQUESTS_TO_L2:DATA
0.0
Counts of events [events − 1 walk Avg Trim]
1.0
Figure 5.62: L1 data cache miss penalty when accessing random cache line sets on AMD Server.
20000
40000
60000
80000
100000
120000
Amount of data accessed [bytes]
Figure 5.63: Performance event counters related to L1 data cache misses when accessing random cache line sets on AMD Server.
c Q-ImPrESS Consortium
Dissemination Level: public
Page 81 / 210
Project Deliverable D3.3: Resource Usage Modeling
Last change: February 3, 2009
20 15 10 5
Duration of access [cycles − 1 walk Avg]
25
Version: 2.0
16384
32768
49152
65536
81920
98304
114688
131072
Amount of code executed [bytes]
0.4
0.6
0.8
1.0
1.2
Event counters L1_ITLB_MISS_AND_L2_ITLB_HIT INSTRUCTION_CACHE_MISSES RETIRED_MISPREDICTED_BRANCH_INSTRUCTIONS
0.2
Counts of events [events − 1 walk Avg Trim]
1.4
Figure 5.64: L1 instruction cache miss penalty when accessing random cache line sets on AMD Server.
20000
40000
60000
80000
100000
120000
Amount of code executed [bytes]
Figure 5.65: Performance event counters related to L1 instruction cache misses when accessing random cache line sets on AMD Server.
c Q-ImPrESS Consortium
Dissemination Level: public
Page 82 / 210
Project Deliverable D3.3: Resource Usage Modeling
Last change: February 3, 2009
40 30 20 10
Duration of access [cycles − 1 walk Avg]
50
Version: 2.0
65536
131072
229376
327680
425984
524288
622592
Amount of data accessed [bytes]
0.8 0.6 0.2
0.4
Event counters DATA_CACHE_MISSES L1_DTLB_MISS_AND_L2_DTLB_HIT:L2_4K_TLB_HIT L1_DTLB_AND_L2_DTLB_MISS:4K_TLB_RELOAD L2_CACHE_MISS:DATA
0.0
Counts of events [events − 1 walk Avg Trim]
1.0
Figure 5.66: L2 data cache miss penalty when accessing random cache line sets on AMD Server.
1e+05
2e+05
3e+05
4e+05
5e+05
6e+05
Amount of data accessed [bytes]
Figure 5.67: Performance event counters related to L2 data cache misses when accessing random cache line sets on AMD Server.
c Q-ImPrESS Consortium
Dissemination Level: public
Page 83 / 210
Project Deliverable D3.3: Resource Usage Modeling
Last change: February 3, 2009
49.0 48.5 48.0 47.5 47.0 46.5
Duration of access [cycles − 10K Avg]
49.5
Version: 2.0
0
8
16
24
32
40
48
56
Offset of access in a cache line [bytes]
Figure 5.68: Dependency of L2 cache miss penalty on access offset in a cache line when accessing random cache line sets on AMD Server.
5.3.3.8 Experiment: L2 cache miss penalty dependency on cache line set, Intel Server
In Experiment 5.3.3.6, we saw that the penalty of the L2 miss when accessing a single L2 cache line set on Platform Intel Server may differ depending on the cache line set used for the experiment. The following experiment aims to further explore this dependency. It repeats Experiment 5.3.3.6 on (1) all cache line sets that have a fixed page color of 0 and (2) cache lines sets with different page color and a fixed offset in the page. This is done by varying the offset of accesses relatively to the memory buffer, which is aligned to the beginning of a page with color 0. Purpose Determine the dependency of a L2 cache miss penalty on the cache line set being accessed on Platform Intel Server. Measured
Time to perform a single memory access in set collision pointer walk from Listing 5.1 and 5.6.
Parameters Pages allocated: 128; access pattern stride: 64 pages (4 MB cache size divided by 16 ways); pages accessed: 16-128 (exponential step); page colors: 64. One page color (0) Access offset: 0-4096 B (64 B step). Different page colors Access offset: 256-258304 B (4 KB step). Expected Results There might be some differences on access duration depending on the cache line set due to some cache line sets getting additional accesses other then accesses caused by the pointer walk itself, which cause more evictions in that set. A possible cause are the page walk accesses due to DTLB misses the pointer walk causes on such number of accessed pages. Other differences may be caused by memory bus, controller, or the system memory itself, because each L2 cache miss results in a system memory access. Measured Results The results of varying cache line offset when accessing pages with color 0 show that for 16 accessed pages, accesses with offsets that are multiples of 512 B are slightly slower than others (Figure 5.69). This is accompanied by increases in L1 data cache misses and page walk cycles and can be explained by the DTLB misses causing page table lookups. Since there are 64 page colors and we access pages with color 0, the address translation reads page directory entries with numbers being also multiple of 64 in a page directory. Since the entries are 8 B large offsets of the entries being read are therefore multiple of 512 B. With 32 accessed pages (Figure 5.71) this effect on access duration diminishes (although the performance counters still show the difference). Instead, we see that accesses to odd cache lines are approximately c Q-ImPrESS Consortium
Dissemination Level: public
Page 84 / 210
Project Deliverable D3.3: Resource Usage Modeling
Last change: February 3, 2009
26 25 24 23
Duration of access [cycles − 1000 walks Avg]
27
Version: 2.0
0
256
576
896
1216
1600
1984
2368
2752
3136
3520
3904
Offset of access in a page [bytes]
Event counters
2
3
4
5
6
PAGE_WALKS:CYCLES L1D_REPL
1
Counts of events [events − 1000 walks Avg Trim]
Figure 5.69: Dependency of L2 cache miss penalty on accessed cache line sets with page color 0 and 16 accesses on Intel Server.
0
1000
2000
3000
4000
Offset of access in a page [bytes]
Figure 5.70: Performance event counters related to L2 cache misses on accessed cache line sets with page color 0 and 16 accesses on Intel Server.
6 cycles slower than accesses to even cache lines. Interestingly, this effect is reversed when we further increase the number of accessed pages – accesses to even cache lines are slower than to the odd lines. Finally at 128 accessed pages we see that accesses to the even cache lines take 300 cycles, which is 30 cycles slower than the 270 cycles for odd cache lines. The L2 miss penalty is thus 256-286 cycles beyond L1 cache miss. This includes the penalty DTLB miss and L1 data cache miss during page walk, as described in Experiment 5.3.3.6 – these events are hard to avoid when accessing memory range so large to not fit in the L2 cache. The experiment variant with different color pages uses 256 B offset in a page to avoid the abovementioned collisions with page table entries. The results showed no dependency on the page color. c Q-ImPrESS Consortium
Dissemination Level: public
Page 85 / 210
Project Deliverable D3.3: Resource Usage Modeling
Last change: February 3, 2009
test_pages
240
260
280
32 64 128
220
Duration of access [cycles − 1000 walks Avg]
300
Version: 2.0
0
1000
2000
3000
4000
Offset of access in a page [bytes]
Figure 5.71: Dependency of L2 cache miss penalty on accessed cache line sets with page color 0 and 32-128 accesses on Intel Server.
We can conclude that there seems to be difference only between odd and even cache line sets. No event counter that we sampled would however explain this difference, which indicates that this might be a property of parts of the memory subsystem beyond the processor caches. 5.3.3.9 Experiment: L3 cache miss penalty, AMD Server
Purpose Determine the miss penalty of the L3 cache (only present on Platform AMD Server) both when accessing a single cache line set and random cache line sets. Also determine whether it depends on the offset of the accessed word in the cache line. Measured
Time to perform a single memory access in set collision pointer walk from Listing 5.1.
Parameters Single set Pages allocated: 64; access stride: 16 pages (2 MB L3 cache size divided by 32 ways); page colors: 16; pattern: set collision (Listing 5.6). Miss penalty Pages accessed: 1-64; access offset: 0. Offset dependency Pages accessed: 48-64; access offset: 0-128 B (8 B step). Random sets Allocated: 4096 KB; stride: 64 B; page colors: 16; pattern: random (Listing 5.5) Miss penalty Accessed: 256-4096 KB (256 KB step); access offset: 0. Offset dependency Accessed: 4096 KB; access offset: 0-56 B (8 B step). Expected Results When accessing a single cache line set, we should see L3 cache misses as we exceed the number of ways in all 3 levels due to the exclusive policy. When accessing random cache line sets, we should see L3 cache misses as the amount of accessed memory increases. Measured Results The results when accessing a single cache line set (Figure 5.72) show an increase in access duration from 60 to 80 cycles at 49 accesses. With 51 and more accesses, we observe a duration of 265-270 cycles. The performance event counters (Figure 5.73) show that the first increase in duration is caused by L2 DTLB misses that are inevitable with that many accesses. The second increase in duration is accompanied by an increase from 0 to 1 of the DRAM ACCESSES PAGE:ALL event count which confirms system memory accesses due to L3 cache misses. The L3 CACHE MISSES:ALL event counter however shows less than 0.5 c Q-ImPrESS Consortium
Dissemination Level: public
Page 86 / 210
Project Deliverable D3.3: Resource Usage Modeling
Last change: February 3, 2009
250 200 150 100 50 0
Duration of access [cycles − 1000 walks Avg]
300
Version: 2.0
1
4
7 10
14
18
22
26
30
34
38
42
46
50
54
58
62
Number of accesses mapping to the same L3 cache line set
1.0
Event counters
0.2
0.4
0.6
0.8
L1_DTLB_MISS_AND_L2_DTLB_HIT:L2_4K_TLB_HIT L1_DTLB_AND_L2_DTLB_MISS:4K_TLB_RELOAD L3_CACHE_MISSES:ALL DRAM_ACCESSES_PAGE:ALL
0.0
Counts of events [events − 1000 walks Avg Trim]
Figure 5.72: L3 cache miss penalty when accessing a single cache line set on AMD Server.
0
10
20
30
40
50
60
Number of accesses mapping to the same L3 cache line set
Figure 5.73: Performance event counters related to L3 cache misses when accessing a single cache line set on AMD Server.
misses per access in average, which could be an implementation error. The fact that the increase occurs at 51 accesses confirms the 32 ways in the L3 cache and its exclusivity. When determining the offset dependency, with 48 accessed pages we observed similar results as in Experiment 5.3.3.7 – in both cases there are just L2 cache misses involved. There is however no dependency with 49 and 50 accessed pages, the additional overhead of L2 DTLB misses probably hides it. We also observed no dependency for 51 and more accessed pages, where the L3 cache misses occur. The results when accessing random cache line sets (Figure 5.74) show a gradual increase of access duration up to 255 cycles. The DRAM ACCESSES PAGE:ALL event counter (Figure 5.75) confirms that this is caused by system memory accesses and the L3 CACHE MISSES:ALL shows unexpectedly low values c Q-ImPrESS Consortium
Dissemination Level: public
Page 87 / 210
Project Deliverable D3.3: Resource Usage Modeling
100
150
200
250
Last change: February 3, 2009
50
Duration of access [cycles − 1 walk Avg]
Version: 2.0
262144
786432
1310720 1835008 2359296 2883584 3407872 3932160 Amount of data accessed [bytes]
0.2
0.4
0.6
0.8
Event counters L1_DTLB_MISS_AND_L2_DTLB_HIT:L2_4K_TLB_HIT L1_DTLB_AND_L2_DTLB_MISS:4K_TLB_RELOAD L3_CACHE_MISSES:ALL DRAM_ACCESSES_PAGE:ALL
0.0
Counts of events [events − 1 walk Avg Trim]
1.0
Figure 5.74: L3 cache miss penalty when accessing random cache line sets on AMD Server.
1e+06
2e+06
3e+06
4e+06
Amount of data accessed [bytes]
Figure 5.75: Performance event counters related to L3 cache misses when accessing random cache line sets on AMD Server.
again. We can also see that almost each access results in L1 or L2 DTLB miss – this is inevitable when accessing in such memory range. The penalty of an L3 miss including the L2 DTLB miss is thus 208 cycles beyond the L2 miss penalty, when accessing random cache line sets. We observed no dependency of the penalty on the access offset in a cache line when accessing random cache line sets.
5.3.4 Pipelined Composition Code most sensitive to pipelined sharing of memory content caches includes: c Q-ImPrESS Consortium
Dissemination Level: public
Page 88 / 210
Project Deliverable D3.3: Resource Usage Modeling
Version: 2.0
Last change: February 3, 2009
•
Accesses to memory where addresses belonging to the same cache line are accessed only once in a pattern that does not trigger prefetching, and where the accessed data would fit into the processor cache in the isolated scenario.
•
A mix of reads and writes where modifications would not be flushed to memory by the end of each cycle in the isolated scenario.
5.3.5 Artificial Experiments The following experiments resemble the pipelined sharing scenario with the most sensitive code. Executions of two workloads are interleaved and thus the interfering workload evicts code or data of the measured workload from the caches during its execution. For data caches, the measured workload accesses data in a memory buffer so that each access uses an address in a different cache line. This is done by executing the random pointer walk code in Listing 5.1 and 5.5 with stride set to the cache line size. The memory buffer size is set to fit in the particular cache. The interfering workload is the same as the measured workload, but accessing a different memory buffer in order to evict the data or code of the measured workload. The amount of memory accessed by the interfering workload varies from none to an amount that guarantees full eviction of the measured workload. For data caches, the interfering workload uses either read accesses or write accesses in order to determine the overhead of dirty cache lines write-back in the measured workload. 5.3.5.1 Experiment: L1 data cache sharing
Purpose
Determine the impact of L1 data cache sharing on the most sensitive code.
Measured Parameters
Time to perform a single memory access in random pointer walk from Listing 5.1 and 5.5. Intel Server Allocated: 32 KB; accessed: 32 KB; stride: 64 bytes.
AMD Server Allocated: 64 KB; accessed: 64 KB; stride: 64 bytes. Interference The same as the measured workload. Allocated: 128 KB; accessed: 0-128 KB (8 KB step); stride: 64 B; access type: read-only, write. Expected Results The measured workload should fit in the L1 data cache and therefore hit on each access when executed with no interference. The interfering workload should increasingly evict the data of the measured workload until the whole buffer is evicted and the measured workload should miss the L1 data cache on each access. Measured Results The results confirm the expected slowdown due to the interfering workload. On Platform Intel Server, the average duration of a memory access in the measured workload increases from 5.5 cycles to 14 cycles with read-only interference and 14.5 cycles with write interference (Figure 5.76). With 512 L1 cache lines the total overhead is approximately 4350 and 4600 cycles, respectively. On Platform AMD Server we observed no difference between read-only and write interference, due to the exclusive caches. The average duration increases from 3 to 15 cycles due to the sharing, see Figure 5.77 for results of the read-only variant. With 1024 cache lines this means an overhead of 12300 cycles.
Effect Summary The overhead can be visible in workloads with very good locality of data references that fit in the L1 data cache when executed alone. The cache miss can be repeated only as many times as there are the L1 data cache entries, the overhead will therefore only be significant in workloads where the number of data accesses per invocation is comparable to the size of the L1 data cache.
c Q-ImPrESS Consortium
Dissemination Level: public
Page 89 / 210
Project Deliverable D3.3: Resource Usage Modeling
8
10
12
14
Last change: February 3, 2009
Interfering accesses read write
6
Duration of access [cycles − 512 Avg Trim]
Version: 2.0
0
20000
40000
60000
80000
100000
120000
Amount of memory accessed by the interfering workload [bytes]
14 12 10 8 6 4
Duration of access [cycles − 1024 Avg]
16
Figure 5.76: L1 data cache sharing impact on code accessing random cache lines on Intel Server.
0 8192
24576
40960
57344
73728
90112
106496
122880
Amount of memory accessed by the interfering workload [bytes]
Figure 5.77: L1 data cache sharing impact on code accessing random cache lines on AMD Server.
5.3.5.2 Experiment: L2 cache sharing
Purpose
Determine the impact of L2 cache sharing on the most sensitive code.
Measured Parameters
Time to perform a single memory access in random pointer walk from Listing 5.1 and 5.5. Intel Server Allocated: 4 MB; accessed: 4 MB; stride: 128 bytes.
AMD Server Allocated: 512 KB; accessed: 512 KB; stride: 64 bytes. Interference The same as the measured workload. Access type: read-only, write. Intel Server Allocated: 16 MB; accessed: 0-16 MB (1 MB step); stride: 128 B; AMD Server Allocated: 1024 KB; accessed: 0-1024 KB (64 KB step); stride: 64 B. c Q-ImPrESS Consortium
Dissemination Level: public
Page 90 / 210
Project Deliverable D3.3: Resource Usage Modeling
Interfering accesses read write
150
200
250
Last change: February 3, 2009
100
Duration of access [cycles − 32K Avg Trim]
Version: 2.0
0.0e+00
5.0e+06
1.0e+07
1.5e+07
Amount of memory accessed by the interfering workload [bytes]
Figure 5.78: L2 cache sharing impact on code accessing random cache lines on Intel Server.
Expected Results The measured workload should fit in the L2 cache and therefore hit on each access when executed with no interference, except for the associativity misses due to the physical indexing. The interfering workload should increasingly evict the data of the measured workload until the whole buffer is evicted and the measured workload should miss the L2 cache on each access. Measured Results On Platform Intel Server, the average duration of memory access in the measured workload increases from 80 cycles to 247 cycles, resp. 258 cycles with write interference (Figure 5.78). With all 32768 accessed pairs of L2 cache entries, the total overhead is 5.5, resp. 5.8 millions of cycles. On Platform AMD Server we again saw no difference between the read-only and write interference. The average duration of memory access in the measured workload increases from 26 cycles to 47 cycles (Figure 5.79 for the read-only variant). With all 8192 accessed L2 cache entries, the total overhead is 172000 cycles. Effect Summary The overhead can be visible in workloads with very good locality of data references that fit in the L2 cache when executed alone. The cache miss can be repeated only as many times as there are the L2 cache entries (or pairs of entries on platform with adjacent line prefetch), the overhead will therefore only be significant in workloads where the number of data accesses per invocation is comparable to the size of the L2 cache.
5.3.5.3 Experiment: L3 cache sharing, AMD Server
Purpose
Determine the impact of L3 cache sharing on the most sensitive code on Platform AMD Server
Measured Parameters
Time to perform a single memory access in random pointer walk from Listing 5.1 and 5.5. Allocated: 2 MB; accessed: 2 MB; stride: 64 B.
Interference The same as the measured workload. Allocated: 4 MB; accessed: 0-4 MB (256 KB step); stride: 64 B; access type: read-only, write. Expected Results The only difference from the previous experiments is that the write interference should make some difference on this platform – only dirty cache lines have to be written back to the system memory upon eviction. c Q-ImPrESS Consortium
Dissemination Level: public
Page 91 / 210
Project Deliverable D3.3: Resource Usage Modeling
25
30
35
40
45
Last change: February 3, 2009
20
Duration of access [cycles − 8192 Avg]
Version: 2.0
0
131072
262144
393216
524288
655360
786432
917504 1048576
Amount of memory accessed by the interfering workload [bytes]
Figure 5.79: L2 cache sharing impact on code accessing random cache lines on AMD Server.
150
200
read write
100
Duration of access [cycles − 32K Avg Trim]
Interfering accesses
0e+00
1e+06
2e+06
3e+06
4e+06
Amount of memory accessed by the interfering workload [bytes]
Figure 5.80: L3 cache sharing impact on code accessing random cache lines on AMD Server.
Measured Results The results (Figure 5.80) show that the expected difference between read-only and write interference exists but is very small. The average duration of memory access in the measured workload increases from 59 to 238, resp. 240 cycles. With all 32768 L3 cache entries accessed, the total overhead is approximately 5.9 millions of cycles.
Effect Summary The overhead can be visible in workloads with very good locality of data references that fit in the L3 cache when executed alone. The cache miss can be repeated only as many times as there are the L3 cache entries, the overhead will therefore only be significant in workloads where the number of data accesses per invocation is comparable to the size of the L3 cache.
c Q-ImPrESS Consortium
Dissemination Level: public
Page 92 / 210
Project Deliverable D3.3: Resource Usage Modeling
Last change: February 3, 2009
25 20 15 10 5
Duration of access [cycles − 512 Avg]
30
Version: 2.0
0 8192
24576
40960
57344
73728
90112
106496
122880
Amount of code executed [bytes]
Figure 5.81: L1 instruction cache sharing impact on code that jumps between random cache lines on Intel Server.
5.3.5.4 Experiment: L1 instruction cache sharing
The L1 instruction cache sharing experiment is similar to the L1 data cache one except for executing chains of jump instruction from Listing 5.7 as both measured and interfering workload. Purpose
Determine the impact of L1 instruction cache sharing on the most sensitive code.
Measured Parameters
Time to execute a jump instruction in random jump instruction chain from Listing 5.7 and 5.5. Intel Server Allocated: 32 KB; accessed: 32 KB; stride: 64 bytes.
AMD Server Allocated: 64 KB; accessed: 64 KB; stride: 64 bytes. Interference The same as the measured workload. Allocated: 128 KB; accessed: 0 KB-128 KB (8 KB step); stride: 64 B. Expected Results The measured workload should fit in the L1 instruction cache and therefore hit on each jump instruction when executed with no interference. The interfering workload should increasingly evict the code of the measured workload until it is all evicted and the measured workload should miss the L1 instruction cache in each executed jump instruction. Measured Results The results confirm the expected slowdown due to the interfering workload. On Platform Intel Server, the average duration of one jump instruction in the measured workload increases from 5 to 28 cycles (Figure 5.81). With 512 L1 cache lines the total overhead is approximately 11800 cycles. On Platform AMD Server, the average duration of one jump instruction in the measured workload increases from 9 to 21 cycles (Figure 5.82). With 1024 L1 cache lines the total overhead is approximately 12300 cycles. Effect Summary The overhead can be visible in workloads that perform many jumps and branches and that fit in the L1 instruction cache when executed alone. The cache miss can be repeated only as many times as there are the L1 instruction cache entries, the overhead will therefore only be significant in workloads where the number of executed branch instructions per invocation is comparable to the size of the L1 instruction cache.
c Q-ImPrESS Consortium
Dissemination Level: public
Page 93 / 210
Project Deliverable D3.3: Resource Usage Modeling
Last change: February 3, 2009
20 15 10
Duration of access [cycles − 1024 Avg]
25
Version: 2.0
0 8192
24576
40960
57344
73728
90112
106496
122880
Amount of code executed [bytes]
Figure 5.82: L1 instruction cache sharing impact on code that jumps between random cache lines on AMD Server.
5.3.6 Real Workload Experiments: Fourier Transform A Fast Fourier Transform implementation takes a memory buffer filled with input data as its input and transforms it either in-place or with a separate memory buffer for the output. It is an example of a memory intensive operation and might be therefore affected by the data cache sharing. Specifically in the pipelined scenario, the performance of a component performing the FFT transformation might be affected by the amount of the input data being cached upon the components invocation. If another memory intensive component is executed in the pipeline between a component that fills the buffer from e.g. disk, network or by a previous processing, and the FFT component, the input data is evicted from the cache. The following experiments model this scenario by repeated execution of sequence of the following operations – buffer initialization, data cache eviction and the in-place FFT calculation, whose duration is measured. A slightly different variant of the experiment invokes FFT calculation with separate input and output buffers interleaved with the data cache eviction. In this scenario, the buffer is initialized only once before the experiment. We use FFTW 3.1.2 [27] as the FFT implementation. For the data eviction we execute the pointer walk code (Listing 5.1) accessing random cache lines (Listing 5.5) using both read-only and write access variants. 5.3.6.1 Experiment: FFT sharing data caches
Purpose
Determine the impact of data cache sharing on performance of the FFT calculation.
Measured Parameters step)
Duration of a FFT calculation with varying input buffer size. FFT method: FFTW in-place, FFTW separate buffers; FFT buffer size: 4-8192 KB (exponential
Interference Pointer walk (Listing 5.1) accessing random cache lines (Listing 5.5). Allocated: 16 MB; accessed: 0-16 MB (1 MB step); access stride: 64 B; access type: read-only, write. Expected Results Increasing the amount of data accessed by the cache eviction should increase the duration of the FFT transformation due to more cache misses. The effect should diminish as the FFT buffer size exceeds the size of the last-level cache, because the FFT calculation is already causing capacity misses during its operation. The effect should be stronger in some configurations, when the interfering code is performing memory writes, due to the write-back of dirty cache lines. c Q-ImPrESS Consortium
Dissemination Level: public
Page 94 / 210
Project Deliverable D3.3: Resource Usage Modeling
Version: 2.0
Last change: February 3, 2009
250 50
100
150
200
4 KB 8 KB 16 KB 32 KB 64 KB 128 KB 256 KB 512 KB 1 MB 2 MB 4 MB 8 MB
0
Slowdown of FFT calculation [% − Trim]
FFT buffer size
0.0e+00
5.0e+06
1.0e+07
1.5e+07
Amount of memory read by interfering workload [bytes]
FFT buffer size
50
100
150
200
250
4 KB 8 KB 16 KB 32 KB 64 KB 128 KB 256 KB 512 KB 1 MB 2 MB 4 MB 8 MB
0
Slowdown of FFT calculation [% − Trim]
300
Figure 5.83: In-place FFT slowdown by data cache sharing with read-only interference on Intel Server.
0.0e+00
5.0e+06
1.0e+07
1.5e+07
Amount of memory written by interfering workload [bytes]
Figure 5.84: In-place FFT slowdown by data cache sharing with write interference on Intel Server.
Measured Results The results from Platform Intel Server show a significant slowdown due to cache eviction in all cases where the FFT buffer (or the two separate buffers) fit in half of the L2 memory cache. Write interference and using separate buffers both generally increase the slowdown. See Figures 5.83 and 5.84 for the in-place variant, 5.85 and 5.86 for the separate-buffers variant. The slowdown diminishes with 4 MB and larger in-place buffer or two 2 MB input and output buffers. The largest slowdown occurs with 8 KB buffer – almost 260 % with read-only interference and almost 300 % with write interference in the in-place variant, 400 % and 500 % in the separate-buffers variant. In the variant with separate buffers and buffer sizes that do not fit in the L2 cache we also observed a situation where the read-only interfering workload improves, albeit slightly, the perceived performance of the FFT calculation (Figure 5.87). This is a case where the calculation leaves dirty cache lines in the caches c Q-ImPrESS Consortium
Dissemination Level: public
Page 95 / 210
Project Deliverable D3.3: Resource Usage Modeling
Version: 2.0
Last change: February 3, 2009
100
200
300
400
4 KB 8 KB 16 KB 32 KB 64 KB 128 KB 256 KB 512 KB 1 MB 2 MB 4 MB 8 MB
0
Slowdown of FFT calculation [% − Trim]
FFT buffer size
0.0e+00
5.0e+06
1.0e+07
1.5e+07
Amount of memory read by interfering workload [bytes]
FFT buffer size
100
200
300
400
4 KB 8 KB 16 KB 32 KB 64 KB 128 KB 256 KB 512 KB 1 MB 2 MB 4 MB 8 MB
0
Slowdown of FFT calculation [% − Trim]
500
Figure 5.85: FFT with separate buffers slowdown by data cache sharing with read-only interference on Intel Server.
0.0e+00
5.0e+06
1.0e+07
1.5e+07
Amount of memory written by interfering workload [bytes]
Figure 5.86: FFT with separate buffers slowdown by data cache sharing with write interference on Intel Server.
c Q-ImPrESS Consortium
Dissemination Level: public
Page 96 / 210
Project Deliverable D3.3: Resource Usage Modeling
68500000
69500000
Last change: February 3, 2009
67500000
Duration of FFT calculation [cycles]
Version: 2.0
0
2097152
5242880
8388608
11534336
14680064
Amount of memory read by interfering workload [bytes]
FFT buffer size
50
100
150
200
4 KB 8 KB 16 KB 32 KB 64 KB 128 KB 256 KB 512 KB 1 MB 2 MB 4 MB 8 MB
0
Slowdown of FFT calculation [% − Trim]
250
Figure 5.87: FFT with separate buffers speedup thanks to dirty lines eviction by read-only interference with 8 MB buffers on Intel Server.
0.0e+00
5.0e+06
1.0e+07
1.5e+07
Amount of memory read by interfering workload [bytes]
Figure 5.88: In-place FFT slowdown by data cache sharing with read-only interference on AMD Server.
when it finishes, but accesses some different memory when it is executed again. The read-only interference evicts these dirty cache lines and replaces them with clean cache lines, which decreases the perceived cache miss penalty in the FFT calculation. This effect naturally does not occur with write interference. The results from Platform AMD Server are similar, with less significant effect of write interference and generally smaller relative slowdown. The most significant slowdown observed with in-place transformation is 250 % and 270 % with 8 KB FFT buffer using read-only and write interference, respectively. With separate buffers, 4 KB FFT buffer yields the most significant slowdown – up to 300 %, respectively 350 %. Similarly to the results from Platform Intel Server, we also observed very small speedup with separate 8 MB buffers and read-only interference, which does not occur with write interference (Figure 5.92).
c Q-ImPrESS Consortium
Dissemination Level: public
Page 97 / 210
Project Deliverable D3.3: Resource Usage Modeling
Version: 2.0
Last change: February 3, 2009
50
100
150
200
250
4 KB 8 KB 16 KB 32 KB 64 KB 128 KB 256 KB 512 KB 1 MB 2 MB 4 MB 8 MB
0
Slowdown of FFT calculation [% − Trim]
FFT buffer size
0.0e+00
5.0e+06
1.0e+07
1.5e+07
Amount of memory written by interfering workload [bytes]
FFT buffer size
50
100
150
200
250
4 KB 8 KB 16 KB 32 KB 64 KB 128 KB 256 KB 512 KB 1 MB 2 MB 4 MB 8 MB
0
Slowdown of FFT calculation [% − Trim]
300
Figure 5.89: In-place FFT slowdown by data cache sharing with write interference on AMD Server.
0.0e+00
5.0e+06
1.0e+07
1.5e+07
Amount of memory read by interfering workload [bytes]
Figure 5.90: FFT with separate buffers slowdown by data cache sharing with read-only interference on AMD Server.
c Q-ImPrESS Consortium
Dissemination Level: public
Page 98 / 210
Project Deliverable D3.3: Resource Usage Modeling
Last change: February 3, 2009
FFT buffer size
50
100
150
200
250
300
4 KB 8 KB 16 KB 32 KB 64 KB 128 KB 256 KB 512 KB 1 MB 2 MB 4 MB 8 MB
0
Slowdown of FFT calculation [% − Trim]
350
Version: 2.0
0.0e+00
5.0e+06
1.0e+07
1.5e+07
Amount of memory written by interfering workload [bytes]
87500000 86500000 85500000
Duration of FFT calculation [cycles]
Figure 5.91: FFT with separate buffers slowdown by data cache sharing with write interference on AMD Server.
0
2097152
5242880
8388608
11534336
14680064
Amount of memory read by interfering workload [bytes]
Figure 5.92: FFT with separate buffers speedup thanks to dirty lines eviction by read-only interference with 8 MB buffers on AMD Server.
c Q-ImPrESS Consortium
Dissemination Level: public
Page 99 / 210
Project Deliverable D3.3: Resource Usage Modeling
Version: 2.0
Last change: February 3, 2009
Listing 5.9: Shared variable overhead experiment. 1 2 3 4 5 6 7 8 9
// Workload generation while (true) { asm volatile ( "lock incl (%0)" : "=r" (pShared) : "r" (pShared) : ); }
Effect Summary The overhead is visible in FFT as a real workload representative. The overhead depends on the size of the buffer submitted to FFT. In some cases, the interfering workload can flush modified data, yielding apparently negative overhead of the measured workload.
5.3.7 Parallel Composition Code most sensitive to parallel sharing of memory content caches includes: •
Accesses to memory where accessed data would just fit into the memory cache in the isolated scenario and where the access pattern does not trigger prefetching.
•
Accesses to shared memory where the access pattern triggers flushing of modified data.
•
Assume components that transfer data at rates close to the memory cache bandwidth. A parallel composition of such components will reduce the memory cache bandwidth available to each component, increasing the memory access latencies.
•
Assume components that benefit from prefetching at rates close to the memory cache bandwidth. A parallel composition of such components will reduce the memory cache bandwidth available for prefetching, unmasking the memory access latencies.
5.3.8 Artificial Experiments 5.3.8.1 Experiment: Shared variable overhead
The experiment to determine the overhead associated with sharing a variable performs an atomic increment operation on a variable shared by multiple processors, with the standard cache coherency and memory ordering rules in effect. The workload is common in the implementation of synchronization primitives and synchronized structures. To determine the overhead associated with sharing the variable, the same workload is also executed on a variable local to each processor. Purpose
Determine the overhead associated with sharing a variable.
Measured Parameters
Time to perform a single atomic increment operation from Listing 5.9. Different pairs of processors used, local and shared variables used.
Expected Results Operations on the shared variable should exhibit an overhead compared to the operations on the local variable. The overhead can differ between configurations with shared L2 caches and separate L2 caches, but it should be present in both configurations since L1 caches are always separate and cache coherency needs to be enforced. c Q-ImPrESS Consortium
Dissemination Level: public
Page 100 / 210
Project Deliverable D3.3: Resource Usage Modeling
40
60
80
100
120
Last change: February 3, 2009
20
Duration of single access [cycles − 100 Avg]
Version: 2.0
0
1 Memory sharing [boolean]
120 100 80 60 40 20
Duration of single access [cycles − 100 Avg]
Figure 5.93: Shared variable overhead with shared L2 cache on Intel Server.
0
1 Memory sharing [boolean]
Figure 5.94: Shared variable overhead with separate L2 cache and shared package on Intel Server.
Measured Results For a configuration where the two processors share an L2 cache, the results on Figure 5.93 show that a shared access takes an average of 95 cycles, compared to the 23 cycles of the local access. For a configuration where the two processors do not share an L2 cache but share a package, the results on Figure 5.94 show that a shared access takes an average of 113 cycles, compared to the 23 cycles of the local access. Finally, for a configuration where the two processors share neither the L2 cache nor the package, the results on Figure 5.95 show that a shared access takes an average of 55 cycles, compared to the 23 cycles of the local access. Also notable is the fact that the more tightly coupled the two processors are, the more likely it is that the accesses are strictly interleaved and thus always exacting the maximum variable sharing penalty. Effect Summary
The overhead can be visible in workloads with frequent blind access to a shared variable.
c Q-ImPrESS Consortium
Dissemination Level: public
Page 101 / 210
Project Deliverable D3.3: Resource Usage Modeling
40
60
80
100
Last change: February 3, 2009
20
Duration of single access [cycles − 100 Avg]
Version: 2.0
0
1 Memory sharing [boolean]
Figure 5.95: Shared variable overhead with separate L2 cache and separate package on Intel Server.
5.3.8.2 Experiment: Cache bandwidth limit
The experiment to determine the bandwidth limit associated with shared caches performs the random multipointer walk from Listing 5.2 and 5.5 as the measured workload and the random multipointer walk with delays from Listing 5.3 and 5.5 as the interfering workload. The measured workload is configured to access the shared cache at maximum speed over a range of addresses that is likely to hit in the cache. The interfering workload is configured to access the shared cache at varying speeds in two experiment configurations, one over a range of addresses that is likely to hit in the cache and one over a range of addresses that is likely to miss in the cache. Purpose
Determine the bandwidth limit associated with shared caches.
Measured Parameters Interference
Time to perform a single memory access in random multipointer walk from Listing 5.2 and 5.5. Allocated: 128 KB; accessed: 128 KB; stride: 64 B; pointers: 8. Random multipointer walk with delays from Listing 5.3 and 5.5.
Allocated: 128 KB, 4MB; accessed: 128 KB, 4MB; pointers: 8; delay: 0-512 K operations. Expected Results If there is a competition for the shared cache access bandwidth between the measured workload and the interfering workload, the time to perform a single memory access will change with the interfering workload delay. Depending on the cache architecture, the interfering workload that causes mostly cache hits might behave differently from the interfering workload that causes mostly cache misses. Measured Results Considering Platform Intel Server. When both workloads stay in the cache, the competition for the shared cache access bandwidth is visible as an increase in the average access time from 6.2 to 7 cycles on Figure 5.96. When the measured workload stays in the cache but the interfering workload misses in the cache, the competition is visible as an increase in the average access time from 6.2 to 7.4 cycles on Figure 5.97. Figures 5.98 and 5.99 serve to estimate how close the workload is to the shared cache access bandwidth. The figures show the values of the cache idle counter, suggesting that the workload utilizes the cache very close to the bandwidth limit. Effect Summary The limit can be visible in workloads with high cache bandwidth requirements and workloads where cache access latency is not masked by concurrent processing.
c Q-ImPrESS Consortium
Dissemination Level: public
Page 102 / 210
Project Deliverable D3.3: Resource Usage Modeling
Last change: February 3, 2009
7.2 7.0 6.8 6.6 6.4 6.2 6.0
Duration of single access [cycles − 100 Avg]
7.4
Version: 2.0
0
1
2
4
8
16
64
256
1024
4096
16384 65536
524288
Idle length [number of NOP instructions]
8.0 7.5 7.0 6.5 6.0
Duration of single access [cycles − 100 Avg]
Figure 5.96: Shared cache bandwidth limit where interfering workload hits in the shared cache on Intel Server.
0
1
2
4
8
16
64
256
1024
4096
16384 65536
524288
Idle length [number of NOP instructions]
Figure 5.97: Shared cache bandwidth limit where interfering workload misses in the shared cache on Intel Server.
c Q-ImPrESS Consortium
Dissemination Level: public
Page 103 / 210
Project Deliverable D3.3: Resource Usage Modeling
1
2
3
4
5
6
7
Last change: February 3, 2009
0
Count of L2_NO_REQ.BOTH_CORES [events − 1000 Avg]
Version: 2.0
0
1
2
4
8
16
64
256
1024
4096
16384 65536
524288
Idle length [number of NOP instructions]
6.0 5.5 5.0 4.5 4.0
Count of L2_NO_REQ.BOTH_CORES [events − 1000 Avg]
Figure 5.98: Shared cache idle counter per access where interfering workload hits in the cache on Intel Server.
0
1
2
4
8
16
64
256
1024
4096
16384 65536
524288
Idle length [number of NOP instructions]
Figure 5.99: Shared cache idle counter per access where interfering workload misses in the cache on Intel Server.
c Q-ImPrESS Consortium
Dissemination Level: public
Page 104 / 210
Project Deliverable D3.3: Resource Usage Modeling
Version: 2.0
Last change: February 3, 2009
5.3.8.3 Experiment: Cache bandwidth sharing
The experiment that determines the impact of sharing cache bandwidth by multiple parallel requests executes the random multipointer walk from Listings 5.2 and 5.5 as the measured workload. The workload is configured to access the shared cache over a range of addresses that is large enough to miss in all private caches, yet small enough to likely hit in the shared cache. There are two variants of the interfering workload, one that hits and one that misses in the shared cache: •
The variant that hits uses the random multipointer walk over a range of addresses that is likely to hit in the shared cache. With this variant, both workloads compete for the number of requests the cache can handle simultaneously when only hits occur.
•
The variant that misses uses the set collision multipointer walk from Listings 5.2 and 5.6, configured so that each pointer accesses cache lines from a different randomly selected associativity set, over a range of addresses that is large enough to miss in the selected sets. With this variant, both workloads compete for the number of requests the cache can handle simultaneously when both hits and misses occur.
In both variants, the interfering workload evicts only a small portion of the shared cache, making it possible to assess the impact of sharing cache bandwidth without competing for the shared cache capacity. Both workloads vary the number of pointers, which determines the number of simultaneous requests to the shared cache. Purpose
Determine the impact of sharing cache bandwidth.
Measured
Time to perform a single memory access in random multipointer walk from Listing 5.2 and 5.5.
Parameters Allocated and accessed: 256 KB, 8 MB (Intel Server), 1 MB, 8 MB (AMD Server); stride: 64 B; pointers: 1-64 (exponential step). Interference
Random multipointer walk from Listing 5.2 and 5.5 to hit in the shared cache.
Allocated and accessed: 64 KB (Intel Server), 768 KB (AMD Server); stride: 64 B; pointers: 1-64 (exponential step). Set collision multipointer walk from Listing 5.2 and 5.6 to miss in the shared cache. Pages allocated and accessed: 64; access stride: 64 pages (4 MB L2 cache size divided by 16 ways); page colors: 64; pointers: 1-64 (exponential step) on Intel Server. Pages allocated and accessed: 64; access stride: 16 pages (2 MB L3 cache size divided by 32 ways); page colors: 16; pointers: 1-64 (exponential step) on AMD Server. Expected Results If there is a competition for the shared cache bandwidth between the measured workload and the interfering workload, the time to perform a single memory access should increase with the number of pointers used by the interfering workload. Depending on the cache architecture, the measured workload that causes mostly cache hits might be affected differently than the workload that causes mostly cache misses. Similarly, the interfering workload that causes mostly shared cache hits might have different impact than the workload that causes mostly shared cache misses. Measured Results Considering Platform Intel Server. All workload variants show slowdown of the measured workload due to sharing, depending on the number of pointers used by the interfering workload (in figures, results for different number of pointers used by the measured workload are plotted as different lines). The results for the variant where both workloads hit in the shared L2 cache are illustrated on Figure 5.100. In general, increasing the number of pointers in the interfering workload increases the performance impact. The event counter for outstanding L1 data cache misses at any cycle (L1D PEND MISS) also increases with the number of interfering workload pointers, confirming that the slowdown is caused by a busy shared L2 cache. For the measured workload with one pointer, the slowdown is less than 2 %. With four or more c Q-ImPrESS Consortium
Dissemination Level: public
Page 105 / 210
Project Deliverable D3.3: Resource Usage Modeling
Version: 2.0
Last change: February 3, 2009
5
10
15
1 4 8 16 32 64
0
Slowdown of accesses [% − 100 Avg Trim]
Measured workload pointers
0
1
2
4
8
16
32
64
Interfering workload pointers [pointers]
Figure 5.100: Slowdown of random multipointer walk in the parallel cache sharing scenario where both measured and interfering workload hit in the shared cache on Intel Server.
pointers used by both workloads, the slowdown is above 10%. The maximum observed slowdown is 16 %. Results with two pointers were too unstable to be presented. When the measured workload misses and the interfering workload hits in the shared cache, the results with one pointer yield more significant slowdown than the previous variant – up to 13 %, as evidenced in Figure 5.101. The impact, however, decreases as the number of pointers in the measured workload increases The slowdown caused by the shared cache bandwidth sharing is thus less significant compared to the penalty caused by the L2 cache misses. Note that the observed L2 miss rates increase slightly with the number of pointers in the interfering workload – the workloads also compete for cache capacity and the observed slowdown can be partially attributed to these extra L2 cache misses. Finally, the variant where the measured workload hits and the interfering workload misses in the shared cache is illustrated on Figure 5.102. Here, we observe the most significant slowdown – up to 107% when the measured workload uses four pointers. The pending misses block concurrent hits in the shared L2 cache. Considering Platform AMD Server. The results of the variant where both workloads hit in the shared L3 cache are illustrated on Figure 5.103 for one pointer in the measured workload, which yields 5 % slowdown. Results with more pointers were too unstable to be presented. When the measured workload misses and the interfering workload hits in the shared cache, the results show no measurable slowdown on this platform. Finally, the variant where the measured workload hits and the interfering workload misses in the shared cache is illustrated on Figure 5.104. The maximum observed slowdown is 49 % with four pointers in the measured workload. We could not, however, verify whether the interfering workload causes L3 cache misses in the measured workload due to problems with the L3 CACHE MISSES event counter, which reported the same results regardless of the processor core mask setting. It is therefore possible that some of the overhead should be attributed to the L3 cache misses caused by the interfering workload, not just to to the cache being busy. Open Issues The problem with the L3 CACHE MISSES even counter on AMD Server prevented confirming that the observed overhead is not due to L3 cache misses.
c Q-ImPrESS Consortium
Dissemination Level: public
Page 106 / 210
Project Deliverable D3.3: Resource Usage Modeling
Last change: February 3, 2009
Measured workload pointers
5
10
1 4 8 16 32 64
0
Slowdown of accesses [% − 100 Avg Trim]
15
Version: 2.0
0
1
2
4
8
16
32
64
Interfering workload pointers [pointers]
Measured workload pointers
20
40
60
80
100
1 4 8 16 32 64
0
Slowdown of accesses [% − 100 Avg Trim]
120
Figure 5.101: Slowdown of random multipointer walk in the parallel cache sharing scenario where the measured workload misses in the shared cache on Intel Server.
0
1
2
4
8
16
32
64
Interfering workload pointers [pointers]
Figure 5.102: Slowdown of random multipointer walk in the parallel cache sharing scenario where the interfering workload misses in the shared cache on Intel Server.
c Q-ImPrESS Consortium
Dissemination Level: public
Page 107 / 210
Project Deliverable D3.3: Resource Usage Modeling
Last change: February 3, 2009
57 56 55 54 53 52
Access duration [cycles − 100 Avg]
58
59
Version: 2.0
0
1
2
4
8
16
32
64
Interfering workload pointers [pointers]
Figure 5.103: Slowdown of random pointer walk in the parallel cache sharing scenario where both measured and interfering workload hit in the shared cache on AMD Server.
10
20
30
40
50
1 2 4 8 16 32 64
0
Slowdown of accesses [% − 100 Avg Median]
Measured workload pointers
0
1
2
4
8
16
32
64
Interfering workload pointers [pointers]
Figure 5.104: Slowdown of random multipointer walk in the parallel cache sharing scenario where the interfering workload misses in the shared cache on AMD Server.
c Q-ImPrESS Consortium
Dissemination Level: public
Page 108 / 210
Project Deliverable D3.3: Resource Usage Modeling
Version: 2.0
Last change: February 3, 2009
Effect Summary The impact can be visible in workloads with many pending requests to the shared cache, where cache access latency is not masked by concurrent processing. The impact is significantly larger when one of the workloads misses in the shared cache.
5.3.8.4 Experiment: Shared cache prefetching
The experiment with shared cache prefetching is similar to the experiment with cache bandwidth sharing (Experiment 5.3.8.3) in that it configures the measured and interfering workloads to hit or miss in the shared cache without competing for its capacity. The difference is that the measured workload uses the linear multipointer walk from Listing 5.2 and 5.4, which benefits from prefetching. The interfering workload may disrupt prefetching by making the shared cache busy. Purpose
Determine the impact of shared cache prefetching.
Measured
Time to perform a single memory access in linear multipointer walk from Listing 5.2 and 5.4.
Parameters Allocated and accessed: 256 KB, 8 MB (Intel Server), 1 MB, 8 MB (AMD Server); stride: 64 B; pointers: 1-64 (exponential step). Interference
Random multipointer walk from Listing 5.2 and 5.5 to hit in the shared cache.
Allocated and accessed: 64 KB (Intel Server), 768 KB (AMD Server); stride: 64 B; pointers: 1-64 (exponential step). Set collision multipointer walk from Listing 5.2 and 5.6 to miss in the shared cache. Pages allocated and accessed: 64; access stride: 64 pages (4 MB L2 cache size divided by 16 ways); page colors: 64; pointers: 1-64 (exponential step) on Intel Server. Pages allocated and accessed: 64; access stride: 16 pages (2 MB L3 cache size divided by 32 ways); page colors: 16; pointers: 1-64 (exponential step) on AMD Server. Expected Results The memory accesses of the measured linear walk workload should trigger and benefit from prefetches into the L1 cache. If the L1 prefetches are discarded due to demand requests of the interfering workload, the linear walk should be affected more than the random walk in Experiment 5.3.8.3, which is used as a reference. We should also be able to verify this effect by examining the L1 prefetch event counter. When the accessed memory range of the measured workload exceeds the shared cache capacity, the linear pattern should also trigger and benefit from prefetches from the system memory into the shared cache. The interfering workload may cause some of these prefetches to be discarded, increasing the number of cache misses due to demand requests and introducing the associated penalty in the measured workload, without competing for the cache capacity. Measured Results Considering Platform Intel Server. The results of the variant where both workloads hit in the shared cache, illustrated on Figure 5.105, show only a slightly larger slowdown than that of the random walk workload on Figure 5.100, with the maximum observed slowdown being 16 %. The counter of L1 data cache prefetch events (L1D PREFETCH:REQUESTS) shows that prefetches occur only when the measured workload uses one pointer, at a rate of one prefetch event per data access, regardless of the number of pointers used by the interfering workload. The slowdown when the interfering workload misses in the shared cache, illustrated on Figure 5.106, is also only slightly larger than that of the random walk workload in Figure 5.102. Using four pointers in the measured workload again yields the maximum slowdown, up to 108 %. There is, however, a visible difference with one pointer used in the measured workload and eight or more pointers used in the interfering workload. The results of the L1D PREFETCH:REQUESTS event counter (Figure 5.107) reveal that almost half of the prefetches to the L1 cache are discarded when the interfering workload uses eight or more pointers, which interestingly does not occur when it hits in the shared cache. c Q-ImPrESS Consortium
Dissemination Level: public
Page 109 / 210
Project Deliverable D3.3: Resource Usage Modeling
Version: 2.0
Last change: February 3, 2009
5
10
15
1 4 8 16 32 64
0
Slowdown of accesses [% − 100 Avg Trim]
Measured workload pointers
0
1
2
4
8
16
32
64
Interfering workload pointers [pointers]
Figure 5.105: Slowdown of linear multipointer walk in the parallel cache sharing scenario where both measured and interfering workload hit in the shared cache on Intel Server.
The slowdown when the memory range accessed by the measured workload exceeds the shared cache capacity is illustrated on Figure 5.108. The counts of the L2 cache demand request misses (L2 LINES IN:SELF) and the prefetch request misses (L2 LINES IN:SELF:PREFETCH) show that when the measured workload uses 16 or less pointers and there is no interference, the L2 cache misses occur mostly during prefetching and the demand requests thus mostly hit. The prefetches are discarded as the number of pointers in the interfering workload increases, causing the accesses of the measured workload to miss. This slowdown is most significant with 16 pointers in the measured workload, up to 63 %. Figures 5.109 and 5.110 illustrate the changes of the prefetch and demand request misses in the L2 cache, respectively. Using 32 or more pointers in the measured workload seems to exceed the number of prefetch streams the shared cache is able to track, the measured workload thus misses on each access and the interfering workload does not add any significant slowdown. Considering Platform AMD Server. The results of the variant where both workloads hit in the shared cache, illustrated on Figure 5.111, show very unexpected results, where the interfering workload actually seems to speed up the measured workload with two or more pointers, in some cases very significantly. This could not be explained by any of the related event counters. In some cases, we have observed an increase of the prefetch requests to the L2 cache, as illustrated on Figure 5.112 for 16 pointers in the measured workload. This is accompanied by a decrease of the L1 cache misses. It is not, however, clear why sharing the L3 cache would affect prefetches from the private L2 cache to the private L1 cache. This increase of prefetches and decrease of L1 misses also disappears when 32 or more pointers are used by the measured workload, as illustrated on Figure 5.113 for 32 pointers, when some speedup still remains. The results of the variant where the measured workload exceeds the shared cache capacity also show an unexpected speedup similar to the previous variant, as illustrated on Figure 5.114. Finally, the impact of interfering workload missing in the shared cache is illustrated on Figure 5.115. These results also exhibit the unexpected speedup due to the interfering workload, as seen in the previous variants. The speedup, however, diminishes or even changes to slowdown as the number of pointers in the interfering workload increases, similarly to the random multipointer walk in Experiment 5.3.8.3 on Figure 5.104. This suggest that there are two different effects influencing the results in opposite directions. Open Issues The unexpected speedup caused by the interfering workload on Platform AMD Server remains an open issue. c Q-ImPrESS Consortium
Dissemination Level: public
Page 110 / 210
Project Deliverable D3.3: Resource Usage Modeling
Last change: February 3, 2009
Measured workload pointers
20
40
60
80
100
1 4 8 16 32 64
0
Slowdown of accesses [% − 100 Avg Trim]
120
Version: 2.0
0
1
2
4
8
16
32
64
Interfering workload pointers [pointers]
1.0 0.9 0.8 0.7 0.6 0.5 0.4
L1D_PREFETCH:REQUESTS per access [events − 1000 Avg]
Figure 5.106: Slowdown of linear multipointer walk in the parallel cache sharing scenario where interfering workload misses in the shared cache on Intel Server.
0
1
2
4
8
16
32
64
Interfering workload pointers [pointers]
Figure 5.107: Decrease of L1 prefetch events per memory access in the parallel cache sharing scenario where interfering workload misses in the shared cache on Intel Server.
c Q-ImPrESS Consortium
Dissemination Level: public
Page 111 / 210
Project Deliverable D3.3: Resource Usage Modeling
Version: 2.0
Last change: February 3, 2009
20
40
60
1 4 8 16 32 64
0
Slowdown of accesses [% − 100 Avg Trim]
Measured workload pointers
0
1
2
4
8
16
32
64
Interfering workload pointers [pointers]
0.7 0.6 0.5 0.4 0.3 0.2 0.1
L2_LINES_IN:SELF:PREFETCH per access [events − 1000 Avg]
Figure 5.108: Slowdown of linear multipointer walk in the parallel cache sharing scenario where measured workload exceeds the cache capacity on Intel Server.
0
1
2
4
8
16
32
64
Interfering workload pointers [pointers]
Figure 5.109: Decrease of L2 prefetch request misses per memory access in the parallel cache sharing scenario where measured workload with 16 pointers exceeds the cache capacity on Intel Server.
c Q-ImPrESS Consortium
Dissemination Level: public
Page 112 / 210
Project Deliverable D3.3: Resource Usage Modeling
0.3
0.4
0.5
0.6
0.7
0.8
Last change: February 3, 2009
0.2
L2_LINES_IN:SELF per access [events − 1000 Avg]
Version: 2.0
0
1
2
4
8
16
32
64
Interfering workload pointers [pointers]
0 −10 −20
1 2 4 8 16 32 64
−40
−30
Measured workload pointers
−50
Slowdown of accesses [% − 100 Avg Median]
10
Figure 5.110: Increase of L2 demand misses per memory access in the parallel cache sharing scenario where measured workload with 16 pointers exceeds the cache capacity on Intel Server.
0
1
2
4
8
16
32
64
Interfering workload pointers [pointers]
Figure 5.111: Unexpected speedup of linear multipointer walk in the parallel cache sharing scenario where both measured and interfering workload hit in the shared cache on AMD Server.
c Q-ImPrESS Consortium
Dissemination Level: public
Page 113 / 210
Project Deliverable D3.3: Resource Usage Modeling
0.5
0.6
0.7
Last change: February 3, 2009
0.4
REQUESTS_TO_L2.HW_PREFETCH_FROM_DC per access [events − 1000 Avg]
Version: 2.0
0
1
2
4
8
16
32
64
Interfering workload pointers [pointers]
0.03 0.02 0.01 0.00
REQUESTS_TO_L2.HW_PREFETCH_FROM_DC per access [events − 1000 Avg]
Figure 5.112: Increase of prefetch requests to L2 cache per access in linear multipointer walk with 16 pointers in the parallel cache sharing scenario where both measured and interfering workload hit in the shared cache on AMD Server.
0
1
2
4
8
16
32
64
Interfering workload pointers [pointers]
Figure 5.113: Negligible change of requests to L2 cache per access in linear multipointer walk with 32 pointers in the parallel cache sharing scenario where both measured and interfering workload hit in the shared cache on AMD Server.
c Q-ImPrESS Consortium
Dissemination Level: public
Page 114 / 210
Project Deliverable D3.3: Resource Usage Modeling
1 2 4 8 16 32 64
−60
−40
−20
0
20
Last change: February 3, 2009
Measured workload pointers
−80
Slowdown of accesses [% − 100 Avg Median]
Version: 2.0
0
1
2
4
8
16
32
64
Interfering workload pointers [pointers]
Figure 5.114: Unexpected speedup of linear multipointer walk in the parallel cache sharing scenario where the measured workload exceeds the cache capacity on AMD Server.
40 −10
0
10
20
30
1 2 4 8 16 32 64
−20
Slowdown of accesses [% − 100 Avg Median]
Measured workload pointers
0
1
2
4
8
16
32
64
Interfering workload pointers [pointers]
Figure 5.115: Slowdown and speedup of linear multipointer walk in the parallel cache sharing scenario where the interfering workload misses in the shared cache on AMD Server.
c Q-ImPrESS Consortium
Dissemination Level: public
Page 115 / 210
Project Deliverable D3.3: Resource Usage Modeling
Version: 2.0
Last change: February 3, 2009
Effect Summary The impact can be visible in workloads with working sets that do not fit in the shared cache, but employ hardware prefetching to prevent demand request misses. Prefetching can be disrupted by demand requests of the interfering workload, even if those requests do not miss in the shared cache.
5.3.9 Real Workload Experiments: Fourier Transform The following experiment uses the FFT workload described in Section 5.3.6 and measures the slowdown of the FFT workload when sharing caches in parallel composition. Both the in-place variant and the variant with separate input and output buffers are used, with varying buffer sizes. The interfering workload is the same as in the artificial experiments with cache bandwidth sharing and shared cache prefetching (Experiments 5.3.8.3 and 5.3.8.4), namely the random multipointer walk from Listing 5.2 and 5.5 that hits in the shared cache, and the set collision multipointer walk from Listing 5.2 and 5.6 that misses in the shared cache. The number of pointers used by the interfering workload varies. 5.3.9.1 Experiment: FFT sharing data caches
Purpose
Determine the impact of data cache sharing on performance of the FFT calculation.
Measured
Duration of a FFT calculation with varying input buffer size.
Parameters FFT method: FFTW in-place, FFTW separate buffers; FFT buffer size: 128 KB-16 MB (exponential step). Interference
Random multipointer walk from Listing 5.2 and 5.5 to hit in the shared cache.
Allocated and accessed: 64 KB (Intel Server), 768 KB (AMD Server); stride: 64 B; pointers: 1-64 (exponential step). Set collision multipointer walk from Listing 5.2 and 5.6 to miss in the shared cache. Pages allocated and accessed: 64; access stride: 64 pages (4 MB L2 cache size divided by 16 ways); page colors: 64; pointers: 1-64 (exponential step) on Intel Server. Pages allocated and accessed: 64; access stride: 16 pages (2 MB L3 cache size divided by 32 ways); page colors: 16; pointers: 1-64 (exponential step) on AMD Server. Expected Results In general, increasing the number of pointers in the interfering workload should yield a larger slowdown. The slowdown should be similar or lower than the one observed in the artificial experiments (Experiments 5.3.8.3 and 5.3.8.4), depending on how intensively FFT accesses the shared L2 cache and how much it benefits from prefetching. Measured Results Considering Platform Intel Server. All workload variants show slowdown of the FFT calculation due to sharing, depending on the number of pointers used by the interfering workload. The results where the interfering workload hits in the shared cache are illustrated on Figure 5.116 for the in-place variant and on Figure 5.117 for the separate-buffers variant. The observed slowdown is below the slowdown observed in Experiments 5.3.8.3 and 5.3.8.4 and does not significantly depend on the FFT buffer size, except for the 2 MB and larger buffer sizes. The maximum observed slowdown with the smaller buffer sizes is 10 % with one 128 KB buffer and 6 % with two 128 KB buffers. The difference between the results with smaller buffers and the results with the 2 MB and larger buffer sizes is that the latter causes L2 cache misses even with no interference, which means that the workload does not fit in the L2 cache. The number of the L2 cache demand request misses also increases with the number of pointers in the interfering workload. This is because the interfering workload causes L2 prefetches to be discarded, similar to Experiment 5.3.8.4. This is illustrated by figures 5.118 and 5.119 for the variant with one 4 MB buffer, which yields the most significant slowdown – 27 % for the in-place variant and 43 % for the separate-buffers variant. c Q-ImPrESS Consortium
Dissemination Level: public
Page 116 / 210
Project Deliverable D3.3: Resource Usage Modeling
Last change: February 3, 2009
FFT buffer size
5
10
15
20
25
128 KB 256 KB 512 KB 1 MB 2 MB 4 MB 8 MB 16 MB
0
Slowdown of FFT calculation [% − Trim]
30
Version: 2.0
0
1
2
4
8
16
32
64
Interfering workload pointers [pointers]
FFT buffer size
10
20
30
40
128 KB 256 KB 512 KB 1 MB 2 MB 4 MB 8 MB 16 MB
0
Slowdown of FFT calculation [% − Trim]
50
Figure 5.116: In-place FFT slowdown in the parallel cache sharing scenario where the interfering workload hits in the shared cache on Intel Server.
0
1
2
4
8
16
32
64
Interfering workload pointers [pointers]
Figure 5.117: FFT with separate buffers slowdown in the parallel cache sharing scenario where the interfering workload hits in the shared cache on Intel Server.
c Q-ImPrESS Consortium
Dissemination Level: public
Page 117 / 210
Project Deliverable D3.3: Resource Usage Modeling
4e+04
6e+04
8e+04
1e+05
Last change: February 3, 2009
2e+04
L2_LINES_IN:SELF events during FFT calculation [events]
Version: 2.0
0
1
2
4
8
16
32
64
Interfering workload pointers [pointers]
120000 100000 80000 60000
L2_LINES_IN:SELF:PREFETCH events during FFT calculation [events]
Figure 5.118: Increase of L2 demand misses in the parallel cache sharing scenario during FFT with one 4 MB buffer on Intel Server.
0
1
2
4
8
16
32
64
Interfering workload pointers [pointers]
Figure 5.119: Decrease of L2 prefetch misses in the parallel cache sharing scenario during FFT with one 4 MB buffer on Intel Server.
c Q-ImPrESS Consortium
Dissemination Level: public
Page 118 / 210
Project Deliverable D3.3: Resource Usage Modeling
Last change: February 3, 2009
FFT buffer size
50
100
128 KB 256 KB 512 KB 1 MB 2 MB 4 MB 8 MB 16 MB
0
Slowdown of FFT calculation [% − Trim]
150
Version: 2.0
0
1
2
4
8
16
32
64
Interfering workload pointers [pointers]
Figure 5.120: In-place FFT slowdown in the parallel cache sharing scenario where the interfering workload misses in the shared cache on Intel Server.
50
100
150
128 KB 256 KB 512 KB 1 MB 2 MB 4 MB 8 MB 16 MB
0
Slowdown of FFT calculation [% − Trim]
FFT buffer size
0
1
2
4
8
16
32
64
Interfering workload pointers [pointers]
Figure 5.121: FFT with separate buffers slowdown in the parallel cache sharing scenario where the interfering workload misses in the shared cache on Intel Server.
The results where the interfering workload misses in the shared are illustrated on Figures 5.120 and 5.121. The observed slowdown for 1 MB and smaller FFT buffer sizes is not considerably lower than for the artificial workload with 8 or more pointers in Experiments 5.3.8.3 and 5.3.8.4, with negligible dependency on the FFT buffer size. The maximum observed slowdown is 63 % with one 512 KB FFT buffer and 70 % with two 256 KB buffers. With 2 MB or larger buffer sizes, the FFT calculation again does not fit in the L2 cache even without interference, it therefore competes for the memory bus as well as for the shared cache and the observed slowdown is larger. Again, the number of L2 prefetch requests and misses decreases and thus the number of L2 demand misses increases with the number of pointers in the interfering workload. The maximum observed slowdown c Q-ImPrESS Consortium
Dissemination Level: public
Page 119 / 210
Project Deliverable D3.3: Resource Usage Modeling
Last change: February 3, 2009
4.2e+07 4.0e+07 3.8e+07
FFT duration [cycles]
4.4e+07
Version: 2.0
0
1
2
4
8
16
32
64
Interfering workload pointers [pointers]
Figure 5.122: In-place FFT slowdown in the parallel cache sharing scenario during FFT with one 4 MB buffer on AMD Server.
−2
0
2
4
6
512 KB 1 MB 2 MB 8 MB
−4
Slowdown of FFT calculation [% − Median]
FFT buffer size
0
1
2
4
8
16
32
64
Interfering workload pointers [pointers]
Figure 5.123: In-place FFT slowdown in the parallel cache sharing scenario where the interfering workload misses in the shared cache on AMD Server.
is 133 % with one 4 MB FFT buffer and 148 % with two 4 MB buffers. Considering Platform AMD Server. The results where the interfering workload hits in the shared L3 cache were generally unstable, the highest slowdown among the stable results was 6 % observed with one 4 MB buffer, illustrated on Figure 5.122. The results where the interfering workload misses in the shared cache are illustrated on Figures 5.123 and 5.124, with the maximum observed slowdown being 6 %. However, we have also observed up to 13 % speedup, similar to the speedup observed in Experiment 5.3.8.4. Open Issues
The reasons of the speedup on Platform AMD Server, observed also in Experiment 5.3.8.4, remain
c Q-ImPrESS Consortium
Dissemination Level: public
Page 120 / 210
Project Deliverable D3.3: Resource Usage Modeling
Version: 2.0
Last change: February 3, 2009
−10
−5
0
5
512 KB 1 MB 2 MB 4 MB 8 MB
−15
Slowdown of FFT calculation [% − Median]
FFT buffer size
0
1
2
4
8
16
32
64
Interfering workload pointers [pointers]
Figure 5.124: FFT with separate buffers slowdown in the parallel cache sharing scenario where the interfering workload misses in the shared cache on AMD Server.
an open question. Effect Summary The overhead is visible in FFT as a real workload representative. The overhead is smaller when FFT fits in the shared cache and the interfering workload hits, and larger when FFT does not fit in the shared cache or the interfering workload misses.
5.3.10 Real Workload Experiments: SPEC CPU2006 SPEC CPU2006 [30] is an industry-standard benchmark suite that comprises of a spectrum of processor intensive and memory intensive workloads based on real applications. The following experiment measures the slowdown of the SPEC CPU2006 workloads when sharing caches in parallel composition. As the measured workload, the SPEC CPU2006 suite version 1.1 is executed via the included runspec tool, which measures the median execution time of each workload from 10 runs. Due to time constraints, we only run the benchmarks with the base tuning and the test input data, an eventual confirmation of the results with the ref input data should be performed. The execution of the measured workload has been pinned to a single core using the taskset utility. The interfering workload runs on a single core that shares the cache with the measured workload, and is the same as the interfering workload in Experiments 5.3.8.3 and 5.3.8.4. Namely, the experiments use the random multipointer walk from Listings 5.2 and 5.5 to cause hits in the shared cache, and the set collision multipointer walk from Listings 5.2 and 5.6 to cause misses in the shared cache. The number of pointers used by the interfering workload is set to the value that caused the largest slowdown in the artificial experiments. 5.3.10.1 Experiment: SPEC CPU2006 sharing data caches
Purpose
Determine the impact of data cache sharing on performance of the SPEC CPU2006 workloads.
Measured Parameters Interference
Median execution time of the SPEC CPU2006 workloads. Runs: 10; tuning: base; input size: test. Random multipointer walk from Listing 5.2 and 5.5 to hit in the shared cache.
c Q-ImPrESS Consortium
Dissemination Level: public
Page 121 / 210
Project Deliverable D3.3: Resource Usage Modeling
Version: 2.0
CINT2006 benchmark 400.perlbench 401.bzip2 403.gcc 429.mcf 445.gobmk 456.hmmer 458.sjeng 462.libquantum 464.h264ref 471.omnetpp 473.astar 483.xalancbmk CINT2006 geomean
Isolated [s] 3.89 9.67 1.85 5.72 26.9 6.27 5.96 0.0753 22.0 0.599 12.6 0.111
Last change: February 3, 2009
Hit [s] 3.95 10.5 2.07 6.19 28.0 6.28 6.07 0.0768 23.2 0.65 12.7 0.120
Slowdown 1.5 % 8.6 % 12 % 8.2 % 4.1 % 0.2 % 1.8 % 2.0 % 5.5 % 7.7 % 0.8 % 8.1 % 5.0 %
Miss [s] 4.16 13.1 2.32 10.1 36.4 6.38 6.54 0.0788 23.8 0.664 14.9 0.152
Slowdown 6.9 % 35 % 25 % 77 % 35 % 1.8 % 9.7 % 4.6 % 8.2 % 11 % 18 % 37 % 21 %
Table 5.1: Slowdown of the SPEC CPU2006 integer benchmarks (CINT2006) in the parallel cache sharing scenario where the interfering workload hits or misses in the shared cache on Intel Server.
Allocated and accessed: 64 KB (Intel Server), 768 KB (AMD Server); stride: 64 B; pointers: 64 (Intel Server), 32 (AMD Server).. Set collision multipointer walk from Listing 5.2 and 5.6 to miss in the shared cache. Pages allocated and accessed: 64; access stride: 64 pages (4 MB L2 cache size divided by 16 ways); page colors: 64; pointers: 64 on Intel Server. Pages allocated and accessed: 64; access stride: 16 pages (2 MB L3 cache size divided by 32 ways); page colors: 16; pointers: 32 on AMD Server. Expected Results The slowdown should be similar to but lower than the slowdown observed in Experiments 5.3.8.3 and 5.3.8.4, depending on how intensively the workloads access the shared cache and how much they benefit from prefetching. Measured Results Considering Platform Intel Server. The observed median durations of the workloads when run in isolation and when run with the two variants of parallel cache sharing are presented in Table 5.1 for the integer benchmarks and Table 5.2 for the floating point benchmarks, along with the relative slowdown. The sensitivity to cache sharing varies greatly from workload to workload, the interfering workload that misses in the shared cache has a significantly higher impact than the interfering workload that hits. The slowdown due to the interfering workload hitting in the shared cache ranges from 0.2 % (456.hmmer) to 26 % (437.leslie3d). The interfering workload missing in the shared cache causes slowdown ranging from 1.8 % (456.hmmer) to 90 % (459.GemsFDTD). Considering Platform AMD Server. The results, summarized in Tables 5.3 and 5.4, show that the interference can result in a slight slowdown (up to 9.4 % for 470.lbm and missing interference), but also in a significant speedup (up to 21 % for 464.h264ref). The speedup has already been observed for the linear multipointer workload in Experiment 5.3.8.4. The difference between the two experiments is that here, the speedup is only manifested in cases when the interfering workload misses in the shared cache. Open Issues The reasons of the speedup on Platform AMD Server, observed also in the artificial experiments with linear multipointer walk, remain an open question. Effect Summary The overhead is visible in both the integer and floating point workloads. The overhead varies greatly from benchmark to benchmark, an interfering workload that misses in the shared cache has a larger impact than an interfering workload that hits.
c Q-ImPrESS Consortium
Dissemination Level: public
Page 122 / 210
Project Deliverable D3.3: Resource Usage Modeling
Version: 2.0
CFP2006 benchmark 410.bwaves 416.gamess 433.milc 434.zeusmp 435.gromacs 436.cactusADM 437.leslie3d 444.namd 447.dealII 450.soplex 453.povray 454.calculix 459.GemsFDTD 465.tonto 470.lbm 481.wrf 482.sphinx3 CFP2006 geomean
Isolated [s] 35.2 0.546 15.8 26.3 2.11 5.29 27.0 18.4 25.2 0.0252 0.910 0.0613 4.22 1.39 16.0 7.73 3.08
Last change: February 3, 2009
Hit [s] 40.1 0.582 17.7 28.4 2.22 5.50 33.9 18.5 27.3 0.0265 0.940 0.0657 4.73 1.44 17.3 8.36 3.40
Slowdown 14 % 6.6 % 12 % 8.0 % 5.2 % 4.0 % 26 % 0.5 % 8.3 % 5.2 % 3.3 % 7.2 % 12 % 3.6 % 8.1 % 8.2 % 10 % 8.2 %
Miss [s] 46.0 0.630 24.5 38.4 2.38 6.91 45.4 20.2 29.5 0.0307 1.10 0.0675 8.03 1.48 28.8 9.48 4.17
Slowdown 31 % 15 % 55 % 46 % 13 % 31 % 68 % 10 % 17 % 22 % 21 % 10 % 90 % 6.5 % 80 % 23 % 35 % 32 %
Table 5.2: Slowdown of the SPEC CPU2006 floating point benchmarks (CFP2006) in the parallel cache sharing scenario where the interfering workload hits or misses in the shared cache on Intel Server.
CINT2006 benchmark 400.perlbench 401.bzip2 403.gcc 429.mcf 445.gobmk 456.hmmer 458.sjeng 462.libquantum 464.h264ref 471.omnetpp 473.astar 483.xalancbmk CINT2006 geomean
Isolated [s] 4.08 12.3 2.29 11.0 29.9 5.61 7.59 0.0684 30.9 0.627 13.9 0.141
Hit [s] 4.11 12.8 2.35 11.2 30.7 5.62 7.65 0.0685 30.7 0.638 13.9 0.145
Slowdown 0.7 % 4.1 % 2.6 % 1.8 % 2.7 % 0.2 % 0.8 % 0.1 % -0.6 % 1.8 % 0.0 % 2.8 % 1.4 %
Miss [s] 3.97 12.1 1.98 10.9 27.0 5.59 6.70 0.0677 24.5 0.602 13.8 0.126
Slowdown -2.7 % -1.6 % -14 % -0.9 % -9.7 % -0.4 % -12 % -1.0 % -21 % -4.0 % -0.7 % -11 % -6.7 %
Table 5.3: Slowdown of the SPEC CPU2006 integer benchmarks (CINT2006) in the parallel cache sharing scenario where the interfering workload hits or misses in the shared cache on AMD Server.
c Q-ImPrESS Consortium
Dissemination Level: public
Page 123 / 210
Project Deliverable D3.3: Resource Usage Modeling
Version: 2.0
CFP2006 benchmark 410.bwaves 416.gamess 433.milc 434.zeusmp 435.gromacs 436.cactusADM 437.leslie3d 444.namd 447.dealII 450.soplex 453.povray 454.calculix 459.GemsFDTD 465.tonto 470.lbm 481.wrf 482.sphinx3 CFP2006 geomean
Isolated [s] 50.3 0.955 26.0 42.3 2.08 8.05 33.4 36.4 37.2 0.0297 1.08 0.0767 4.85 1.52 7.63 7.99 3.97
Last change: February 3, 2009
Hit [s] 50.5 0.989 26.3 42.5 2.14 8.04 33.7 36.9 38.2 0.0303 1.1 0.0780 4.88 1.53 7.72 8.02 3.99
Slowdown 0.4 % 3.6 % 1.2 % 0.5 % 2.9 % -0.1 % 0.9 % 1.4 % 2.7 % 2.0 % 1.9 % 1.7 % 0.6 % 0.7 % 1.2 % 0.4 % 0.5 % 1.3 %
Miss [s] 50.5 0.886 28.1 38.0 1.87 6.18 34.1 32.6 34.8 0.0282 1.07 0.0728 5.05 1.51 8.35 7.81 4.05
Slowdown 0.4 % -7.2 % 8.1 % -10 % -10 % -23 % 2.1 % -10 % -6.5 % -5.1 % -0.9 % -5.1 % 4.1 % -0.7 % 9.4 % -2.3 % 2.0 % -3.6 %
Table 5.4: Slowdown of the SPEC CPU2006 floating point benchmarks (CFP2006) in the parallel cache sharing scenario where the interfering workload hits or misses in the shared cache on AMD Server.
5.4 Resource: Memory Buses In the system memory architecture, the memory bus connects the processors with caches to the memory controllers with memory modules. Typically, multiple agents are connected to the bus and an arbitration protocol is used to determine ownership. An agent that owns the bus can initiate bus transactions, which are either atomic or split into requests and replies. To avoid the memory bus becoming a bottleneck, architectures with multiple memory buses can be introduced.
5.4.1 Platform Details 5.4.1.1 Platform Intel Server
The two processor packages are connected to a shared memory controller hub by separate front side busses running at 333 MHz. Each front side contains 36 bit wide address bus and 64 bit wide data bus. The address bus can transfer two addresses per cycle, but the address bus strobe signal is only sampled once every two cycles, yielding a theoretical limit of 166 M addresses per second. The data bus can transfer four words per cycle, yielding a theoretical throughput of 1.33 G transfers per second or 10.7 GB per second. Split transactions are used [8, Section 5.1]. 5.4.1.2 Platform AMD Server
Each of the two processor packages is equipped with an integrated dual-channel DDR2 memory controller, shared by all four processor cores of the package. Each of the two channels is 64 bit wide, 72 bit wide with ECC. The channels can operate either independently, or as a single 128 bit wide channel, for a theoretical throughput of 10.7 GB per second with DDR2-667 memory [13, page 230]. The two processors are also connected by a HyperTransport 3.0 link with the theoretical throughput of up to 7.2 GB per second in each direction [14]. Each processor is connected to dedicated memory and the HyperTransport link between the processors is used when code running on one processor wants to access memory connected to the other processor. c Q-ImPrESS Consortium
Dissemination Level: public
Page 124 / 210
Project Deliverable D3.3: Resource Usage Modeling
Version: 2.0
Last change: February 3, 2009
5.4.2 Sharing Effects When a memory bus is shared, memory access is necessarily serialized. When multiple components share a memory bus, they compete for its capacity. The effects that can influence the quality attributes therefore resemble the effects of sharing a server in a queueing system, except for the ability of the components to compensate the memory bus effects by prefetching and parallel execution. Rather than investigating the effects of sharing a memory bus in more detail, we limit ourselves to determining the combined memory access bandwidth, which includes the memory bus bandwidth, memory controller bandwidth and memory modules bandwidth. This allows us to estimate whether further investigation within the scope of the Q-ImPrESS project is warranted.
5.4.3 Parallel Composition In the parallel composition scenario, the effects of sharing the memory bus can be exhibited as follows: •
Assume components that transfer data at rates close to the memory bus bandwidth. A parallel composition of such components will reduce the memory bus bandwidth available to each component, increasing the memory access latencies.
•
Assume components that benefit from prefetching at rates close to the memory bus bandwidth. A parallel composition of such components will reduce the memory bus bandwidth available for prefetching, unmasking the memory access latencies.
5.4.4 Artificial Experiments 5.4.4.1 Experiment: Memory bus bandwidth limit
The experiment to determine the bandwidth limit associated with shared memory bus performs a pointer walk from Listing 5.1. Multiple configurations of the experiment initialize the pointer chain by linear initialization code (Listing 5.4) and random initialization code (Listing 5.5). One or two processors perform the workload to see whether the bandwidth limit associated with shared memory bus has been exceeded. Purpose Measured
Determine the bandwidth limit associated with shared memory bus. Time to perform a single memory access in pointer walk from Listing 5.1.
Parameters Allocated: 64 MB; accessed: 64 MB; pattern: linear (Listing 5.4), random (Listing 5.5); stride: 64 B; processors: 1, 2. Expected Results Assuming that there is a limit on the shared memory bus access bandwidth that the workload exceeds, the average time to perform a single memory access will be halved from the one processor configuration to the two processors configuration. Measured Results For Platform Intel Server, Figure 5.125 shows an access time of 50 cycles per cache line for linear workload running on one processor and 76 cycles per cache line on two processors. The corresponding figures for random workload are 261 and 289 cycles per cache line, see Figure 5.126. The values suggest that while the linear workload approaches the memory bus capacity with rates of 3920 MB/s, the random workload does not nearly approach the same rates. 5.4.4.2 Experiment: Memory bus bandwidth limit
Since the experiment to determine the bandwidth limit associated with shared memory bus reveals that the random pointer walk from Listing 5.1 and 5.5 does not saturate the shared memory bus, another experiment is performed where the pointer walk code (Listing 5.1 has been replaced with multipointer walk code (Listing 5.2) and more processors have been added. Purpose
Determine the bandwidth limit associated with shared memory bus.
c Q-ImPrESS Consortium
Dissemination Level: public
Page 125 / 210
Project Deliverable D3.3: Resource Usage Modeling
50
60
70
80
90
Last change: February 3, 2009
40
Duration of single access [cycles − 100 Avg]
Version: 2.0
1
2
Number of processors generating workload
310 300 290 280 270 260 250
Duration of single access [cycles − 100 Avg]
Figure 5.125: Memory bus bandwidth limit in linear workload on Intel Server.
1
2
Number of processors generating workload
Figure 5.126: Memory bus bandwidth limit in random workload on Intel Server.
Measured Parameters
Time to perform a single memory access in random pointer walk from Listing 5.2 and 5.5. Allocated: 64 MB; accessed: 64 MB; stride: 64 B; pointers: 1-16; processors: 4, 8.
Expected Results Assuming that there is a limit on the shared memory bus access bandwidth that the workload exceeds, the average time to perform a single memory access will be halved from the four processor configuration to the eight processors configuration. Measured Results For Platform Intel Server and 16 pointers, Figure 5.127 shows an access time of 111 cycles per cache line for the workload running on four processors and 203 cycles per cache line on eight processors. The values suggest that the workload approaches the memory bus capacity with rates of 5880 MB/s. The c Q-ImPrESS Consortium
Dissemination Level: public
Page 126 / 210
Project Deliverable D3.3: Resource Usage Modeling
500
Last change: February 3, 2009
200
300
400
4 processors 8 processors
100
Duration of single access [cycles − 100 Avg Trim]
Version: 2.0
1
2
4
8
16
Number of pointers
Figure 5.127: Memory bus bandwidth limit in random workload on Intel Server.
access times for 8 and 16 pointers differ by less than one percent, indicating that an individual processor does not issue more than 8 outstanding accesses to independent addresses. Effect Summary The limit can be visible in workloads with high memory bandwidth requirements and workloads where memory access latency is not masked by concurrent processing.
c Q-ImPrESS Consortium
Dissemination Level: public
Page 127 / 210
Project Deliverable D3.3: Resource Usage Modeling
Version: 2.0
Last change: February 3, 2009
Chapter 6
Operating System When considering the shared resources associated with an operating system, we assume a common operating system with threads and processes and a device driver layer supporting the file system and the network stack. Examples of such operating systems include Linux and Windows.
6.1 Resource: File Systems The file system is a shared resource that creates the abstraction of directories and files over a disk resource consisting of equal sized and directly addressable blocks. The essential functions provided by the file system to the components are reading and writing of files. Whenever a component reads a file, the file system locates the blocks containing the data, after which the data is read and returned to the component. Whenever a component writes a file, the file system locates a block available for writing the data, after which the block is assigned to the file and the data is written. By virtue of its position above the disk resource, the file system can be viewed as a resource that transforms requests to read and write files into requests to read and write blocks. To separate the complexity of modeling the file system from the complexity of modeling the disk, it is therefore helpful to quantify the behavior of the file system in terms of disk operation counts rather than in terms of file operation times. This separation also makes it possible to use models of various disk configurations (single disks, disk arrays, solid state disks) with the same model of the file system. Models of disks that allow calculating the disk operation times are readily available. Important operations recognized by the models of disks include seeking to a particular block, reading of a block and writing of a block. Both reading and writing can be subject to queueing and reordering that minimizes seeking. While reading is necessarily synchronous, writing can be asynchronous with buffering. The operations recognized by the models of disks are the operations that the models of the file system must use to quantify the behavior of the file system. Reading of a file is synchronous, reading of multiple files therefore requires seeking between the blocks where the files are stored. Seeking can also be required when reading a single file, either to read data spanning multiple blocks or to read metadata associated with the file. Data blocks belonging to a single file are usually allocated in a way that minimizes seeking during sequential reading. Writing of a file can be asynchronous, writing of multiple files therefore does not necessarily require seeking. Writing of multiple files can interfere with the allocation of data blocks belonging to a single file, causing fragmentation that increases seeking during sequential reading.
6.1.1 Platform Details This section describes platform dependent details of the operating systems used in the experiments for platforms introduced in Section 3.2. 6.1.1.1 Platform RAID Server
The operating system uses the standard file system configuration. c Q-ImPrESS Consortium
Dissemination Level: public
Page 128 / 210
Project Deliverable D3.3: Resource Usage Modeling
Version: 2.0
Last change: February 3, 2009
6.1.2 Sharing Effects The effects that can influence the quality attributes when multiple components share a file system include: Directory structure Components share the directory structure. The dimensions of the directory structure can influence the efficiency of locating a file. Read fragmentation Reading multiple files can introduce additional seeking operations into otherwise mostly sequential workload. Seeking is inherently slow and therefore even a small number of additional seeking operations degrades performance. Write fragmentation Writing multiple files can introduce fragmentation into otherwise compact allocation. Fragmentation introduces seeking both in writing and in reading, a fragmented file is therefore not only slower to write, but also slower to read.
6.1.3 General Composition The effects of sharing the file system can be exhibited as follows: •
A composition of components that read files will introduce additional seeking operations, which bring significant overhead especially if each component alone would read its files sequentially.
•
A composition of components that write files will introduce fragmentation, which will in turn introduce additional seeking operations both in writing and in reading.
6.1.4 Artificial Experiments In general, the artificial experiments for file system sharing first create and write a number of files using the POSIX functions open and write. The number of files and their size is varied. The files are created and written either one after another (we will refer to this method as individual writing), or concurrently. In the second case, all files are created upfront and writes to the individual files are interleaved using a fixed order — a segment of data is written to the first file, then to the second file, and after the last file another segment is appended to the first file and so on. The segment size for this concurrent writing is given as a parameter. We will call this method as concurrent writing. Note that concurrent writing where the segment size equals the file size would be identical to the individual writing. When all files have been written, the sync function is called to flush all delayed writes to the disk, and the file buffers are dropped from the system memory by writing to the drop caches pseudo-file in the proc kernel interface. This ensures that subsequent reads are not cached. The whole file are then read using the read function. Similarly to writing, reading is also done either individually or concurrently, with an analogous read segment size parameter. Durations of read operations and block IO traces are collected. Experiment results In all subsequent experiments, the experiment results show ratio between measurements from two benchmarks, one of which is considered to represent the baseline. Each benchmark consists of a set of measurements corresponding to workload configuration from benchmark parameter space. Each measurement in turn contains values of multiple attributes. The pairing between workload configurations is determined by a particular experiment. Benchmark parameter space Each workload in a benchmark is determined by a set of parameters that describe the activity the workload generator should perform. The set of allowed variations in those parameters determines the benchmark parameter space. One run of a benchmark iterates over all possible states in benchmark parameter space. Considering the description of the artificial experiments, each workload configuration has the following parameters: •
file count, fc The number of files written (and read).
c Q-ImPrESS Consortium
Dissemination Level: public
Page 129 / 210
Project Deliverable D3.3: Resource Usage Modeling
Version: 2.0
Last change: February 3, 2009
•
file size, fs The size of files written (and read).
•
write segment size, wss The number of bytes written to a single file before switching to another file in concurrent workloads.
•
concurrent write, cw Determines whether the files are written concurrently (cw=1) or individually (cw=0).
•
read segment size, rss The number of bytes read from a single file before switching to another file in concurrent workloads.
•
concurrent read, rss Determines whether the files are read concurrently (cr=1) or individually (cr=0).
•
random read, rr Determines whether the files are read sequentially (rr=0) or randomly (rr=1).
The results of each experiment are summarized in a table, which captures part of the experiment parameter space. For each experiment, there is a set of configuration parameters that are common to both compared benchmarks. Then for each column of the table, there is a parameter tuple which is unique for each table column and which captures the variability of the workloads. Finally, there is typically a single parameter that is common for the baseline workloads but different for the other workloads. Measured attributes For each workload configuration, a set of attributes is directly measured or indirectly derived from collected data. In many benchmarks, the measured quantity corresponds to time, either in seconds or processor clocks, event counts, etc. In case of file system workloads, time provides only limited amount of information, such as duration of the entire workload or parts of it. This is useful for quick comparison of statistical summaries or histograms, but it does not help with prediction of performance on a different device. Since the file system is a resource that basically translates file system workload to disk device workload, we need a way to capture the properties of the workload imposed by file system on a device. There are many ways to characterize disk workload and we have opted to use attributes that have been successfully used [42] to characterize workloads for performance prediction using an analytic model for disk drives with read-ahead and request reordering. Shriver et al. define [42] two main attribute classes and an auxiliary class for attributes from neither class. The first class contains temporal locality measures, the second class contains spatial locality measures, and the third class contains other measures. Temporal locality measures Besides the usual temporal description of incoming requests in terms of arrival process and request rate is burstiness of the incoming requests, which is commonly present in many workloads. A burst is a group of consecutive requests with short interarrival times, typically such that there are still requests pending to be processed by the device while a request arrives. In many cases, mean device service time may serve as the minimum interarrival time for which requests are considered to belong in the same burst. The specification of burstiness then specifies the fraction of all requests arriving in bursts as well as mean number of requests in a burst. •
request rate, requests/second Rate at which requests arrive at the storage device.
•
request per burst, requests Size of a burst.
•
burst f raction, 0-1 Fraction of all requests that occur in a burst.
c Q-ImPrESS Consortium
Dissemination Level: public
Page 130 / 210
Project Deliverable D3.3: Resource Usage Modeling
Version: 2.0
Last change: February 3, 2009
Spatial locality measures Another class of attributes captures spatial locality of the workload. The principal concept here is a run, which captures the notion of sequentiality of the workload, which allows eliminating positioning time and process consecutive requests faster, possibly using read-ahead cache to service the requests. Similar to burst, a run is a group of requests, but in this case the requests have to be spatially contiguous. Such a run is described by stride, which is the mean distance between the starting sectors of consecutive runs, and locality fraction, which determines the fraction of requests that are part of a run. Since purely contiguous runs are relatively rare, it makes sense to allow small (incremental) gaps between the individual requests. Such a run is then called sparse and has similar attributes. Besides number of requests in a sparse run and fraction of requests that are part of sparse runs, we also characterize the mean length of a run in terms of sectors serviced within the span of the run. •
data span, sectors Span (range) of data accessed during the workload.
•
request size, sectors Length of a host read or host write request.
•
run length, sectors Length of a run, a contiguous set of requests.
•
run stride, sectors Distance between the start points of two consecutive runs.
•
locality f raction, 0-1 Fraction of requests that occur in a run.
•
requests per sparse run, requests Number of requests in a sparse run.
•
sparse run length, sectors Number of sectors serviced within the span of a sparse run.
•
sparse run f raction, 0-1 Fraction of requests that are in sparse runs.
Other measures Besides temporal and spatial measures, there are other attributes that we may want to use to characterize a workload. Typically, such an attribute would be fraction of read or write requests, but since our benchmarks are targeted at reading performance, we have omitted such an attribute. However, for simple comparison of results on the same platform, we use a time span attribute which allows us to determine how long a workload took to finish. • time span, seconds Time the measured system took to finish the workload.
6.1.4.1 Sequential access
This group of experiments assesses impact of sharing when each individual file is accessed sequentially and multiple files are written and/or read either individually or concurrently. The quantitative parameters are the same for all these experiments. The number of files that is written and read is two, three or four, the size of each file being 64 MB, 128 MB or 256 MB. The write and read functions are called on a single 256 KB memory buffer, initialized with random data for writing. For concurrent writes and or/reads, the respective segment size is set to 256 KB, 1 MB or 16 MB. c Q-ImPrESS Consortium
Dissemination Level: public
Page 131 / 210
Project Deliverable D3.3: Resource Usage Modeling
fs=64MB rss=16MB cr=1
fs=128MB rss=256KB cr=1
fs=128MB rss=1MB cr=1
fs=128MB rss=16MB cr=1
fs=256MB rss=256KB cr=1
fs=256MB rss=1MB cr=1
fs=256MB rss=16MB cr=1
request rate bursty f raction requests per burst data span request size requests per run run length run stride locality f raction requests per sparse run sparse run length sparse run f raction time span
fs=64MB rss=1MB cr=1
Baseline only: cr=0
Last change: February 3, 2009
fs=64MB rss=256KB cr=1
Version: 2.0
0.57±0.06 3.51±1.31 1.04±0.03 6.87±12.8 1.32±0.14 0.60±0.06 0.80±0.01 122±11.4 0.85±0.01 0.01±0.00 0.01±0.00 1.39±0.30 1.32±0.11
0.93±0.12 1.12±0.36 1.02±0.05 4.49±8.97 1.00±0.13 0.97±0.13 0.98±0.02 11.6±10.5 0.99±0.00 0.18±0.04 0.18±0.03 1.34±0.29 1.07±0.10
0.46±0.05 3.32±1.47 0.96±0.03 7.80±13.9 1.34±0.14 0.46±0.05 0.35±0.01 78.4±182 0.04±0.00 0.00±0.00 0.00±0.00 0.26±0.10 1.62±0.12
0.61±0.05 3.16±0.82 1.03±0.02 1.39±1.73 1.32±0.11 0.60±0.05 0.81±0.01 241±4.24 0.85±0.01 0.01±0.00 0.01±0.00 1.18±0.06 1.24±0.05
0.95±0.10 1.11±0.15 1.00±0.03 1.50±1.79 1.01±0.10 0.97±0.10 0.98±0.01 17±5.23 1.00±0.00 0.14±0.02 0.14±0.01 1.15±0.05 1.04±0.05
0.50±0.05 3.21±0.73 0.95±0.02 2.46±3.51 1.35±0.11 0.45±0.04 0.35±0.01 194±50.4 0.04±0.00 0.00±0.00 0.00±0.00 0.22±0.04 1.47±0.07
0.68±0.16 2.51±1.48 1.00±0.06 1.31±2.23 1.19±0.16 0.68±0.08 0.81±0.03 59.5±3.39 0.87±0.02 NA±NA NA±NA 1.94±1.34 1.23±0.20
0.97±0.21 1.10±0.64 1.00±0.07 0.69±1.04 1.00±0.10 0.98±0.11 0.99±0.04 3.99±0.13 0.99±0.01 NA±NA NA±NA 1.74±1.21 1.03±0.18
0.50±0.10 3.64±2.53 0.94±0.07 0.85±1.19 1.33±0.14 NA±NA NA±NA NA±NA 0.01±0.01 NA±NA NA±NA 0.34±0.31 1.49±0.22
fs=64MB rss=16MB cr=1
fs=128MB rss=256KB cr=1
fs=128MB rss=1MB cr=1
fs=128MB rss=16MB cr=1
fs=256MB rss=256KB cr=1
fs=256MB rss=1MB cr=1
fs=256MB rss=16MB cr=1
request rate bursty f raction requests per burst data span request size requests per run run length run stride locality f raction requests per sparse run sparse run length sparse run f raction time span
fs=64MB rss=1MB cr=1
Baseline only: cr=0
fs=64MB rss=256KB cr=1
Table 6.1: Slowdown of concurrent vs. individual sequential reading of 2 individually written files. Common parameters: fc=2, wss=256KB, cw=0, rr=0
0.60±0.07 3.39±1.45 1.02±0.03 1.42±1.80 1.32±0.14 0.61±0.06 0.81±0.01 226±127 0.85±0.01 0.01±0.00 0.01±0.00 1.11±0.07 1.25±0.07
0.96±0.14 1.10±0.24 1.00±0.03 1.52±1.85 1.01±0.15 0.97±0.15 0.98±0.01 13.4±9.67 1.00±0.00 0.14±0.03 0.14±0.03 1.07±0.06 1.03±0.06
0.51±0.06 3.38±1.04 0.95±0.02 1.52±1.85 1.35±0.13 0.46±0.05 0.36±0.01 59.6±30.1 0.03±0.01 0.00±0.00 0.00±0.00 0.20±0.05 1.44±0.08
0.61±0.02 3.35±0.77 1.03±0.02 2.42±3.70 1.33±0.04 0.60±0.02 0.80±0.01 303±34.5 0.85±0.00 0.01±0.00 0.01±0.00 1.04±0.03 1.24±0.03
0.94±0.05 1.20±0.20 1.00±0.02 4.11±7.39 1.02±0.05 0.96±0.04 0.98±0.01 19.6±2.22 0.99±0.00 0.13±0.02 0.13±0.02 1.02±0.03 1.04±0.03
0.50±0.02 3.37±0.74 0.94±0.02 2.10±3.35 1.36±0.04 0.45±0.01 0.35±0.00 299±83.8 0.04±0.01 0.00±0.00 0.00±0.00 0.20±0.03 1.48±0.05
0.57±0.07 3.53±1.19 1.00±0.05 4.76±9.49 1.31±0.14 0.61±0.07 0.82±0.02 81.1±3.20 0.84±0.02 NA±NA NA±NA 1.39±0.42 1.34±0.14
0.93±0.14 1.02±0.38 1.01±0.06 2.33±4.33 1.00±0.14 0.98±0.15 0.99±0.02 5.86±1.83 0.99±0.00 NA±NA NA±NA 1.28±0.40 1.08±0.13
0.47±0.06 3.58±1.08 0.92±0.04 5.13±10.3 1.35±0.13 NA±NA NA±NA NA±NA 0.01±0.01 NA±NA NA±NA 0.25±0.09 1.56±0.18
Table 6.2: Effect of concurrent vs. individual sequential reading of 3 individually written files. Common parameters: fc=3, wss=256KB, cw=0, rr=0
6.1.4.2 Experiment: Concurrent reading of individually written files
Purpose Measured
Determine the effect of concurrent reading compared to individual reading of files. Individual and concurrent sequential reading of individually written sequential files.
Parameters file count: 2-4; file size: 64MB, 128MB, 256MB; writing: individual; read segment size: 256KB, 1MB, 16MB; reading: individual, separate Expected Results Concurrent reading should be slower than individual reading, because the buffer cache in the system memory and the disk cache are shared, and the disk needs to seek between the files. Read-ahead buffering could reduce these seeks, because individual files are read sequentially. Lower segment sizes should result in more rapid seeking and thus yield more significant slowdown. Increasing the number and size of files extends the area occupied on the disk, which can prolong the latency of seeks. Buffers for more files and larger sizes also occupy more memory and therefore can reduce the read-ahead buffering. Measured Results The results of the experiment are shown in tables 6.1, 6.2, and 6.3 for 2, 3, and 4 files, respectively. Looking at the time span attribute we can see that the most significant slowdown occurs for 16 MB read segment size, while only a negligible overhead occurs for 1 MB. While this is somewhat counterintuitive, it corresponds e.g. to the values of the locality f raction attribute, which shows almost no locality compared to baseline benchmark. This is reflected in other attributes as well. As for the 1 MB read segment size, we can observe increased locality, shorter data span, longer run length, reduced burstiness, and other attributes compared to other read segment sizes. c Q-ImPrESS Consortium
Dissemination Level: public
Page 132 / 210
Project Deliverable D3.3: Resource Usage Modeling
fs=64MB rss=16MB cr=1
fs=128MB rss=256KB cr=1
fs=128MB rss=1MB cr=1
fs=128MB rss=16MB cr=1
fs=256MB rss=256KB cr=1
fs=256MB rss=1MB cr=1
fs=256MB rss=16MB cr=1
request rate bursty f raction requests per burst data span request size requests per run run length run stride locality f raction requests per sparse run sparse run length sparse run f raction time span
fs=64MB rss=1MB cr=1
Baseline only: cr=0
Last change: February 3, 2009
fs=64MB rss=256KB cr=1
Version: 2.0
0.60±0.03 3.08±0.80 1.01±0.03 1.79±2.27 1.33±0.06 0.60±0.03 0.81±0.01 180±2.60 0.86±0.01 0.01±0.00 0.01±0.01 1.11±0.12 1.26±0.05
0.96±0.07 0.97±0.20 0.98±0.04 1.79±2.27 1.01±0.08 0.98±0.08 0.98±0.01 15±8.68 1.00±0.01 0.17±0.08 0.17±0.08 1.09±0.12 1.04±0.04
0.50±0.03 3.04±0.81 0.94±0.03 1.79±2.27 1.35±0.06 0.46±0.02 0.35±0.01 240±104 0.04±0.01 0.00±0.00 0.00±0.00 0.21±0.04 1.48±0.07
0.61±0.03 3.34±0.81 1.03±0.02 2.92±3.37 1.32±0.04 0.60±0.02 0.80±0.01 304±99.1 0.85±0.01 0.01±0.00 0.01±0.00 1.06±0.06 1.23±0.03
0.94±0.04 1.17±0.18 1.00±0.02 2.64±3.19 1.02±0.04 0.97±0.04 0.98±0.00 24.4±12.8 1.00±0.00 0.13±0.02 0.13±0.02 1.05±0.06 1.05±0.03
0.51±0.03 3.52±0.76 0.95±0.02 2.73±3.36 1.35±0.04 0.45±0.01 0.35±0.00 381±155 0.05±0.01 0.00±0.00 0.00±0.00 0.21±0.04 1.46±0.06
0.61±0.07 3.13±1.30 1.01±0.04 0.93±1.33 1.32±0.10 0.61±0.05 0.81±0.01 101±23.2 0.85±0.01 0.01±0.00 0.01±0.00 1.24±0.28 1.24±0.10
0.98±0.14 1.09±0.30 1.02±0.06 0.78±1.12 1.01±0.12 0.97±0.12 0.98±0.02 15.5±19 0.99±0.00 0.16±0.05 0.17±0.05 1.19±0.27 1.02±0.09
0.52±0.05 3.25±0.82 0.94±0.03 0.78±1.12 1.35±0.09 0.46±0.03 0.36±0.01 191±286 0.04±0.01 0.00±0.00 0.00±0.00 0.24±0.07 1.43±0.11
fs=64MB wss=16MB cw=1
fs=128MB wss=256KB cw=1
fs=128MB wss=1MB cw=1
fs=128MB wss=16MB cw=1
fs=256MB wss=256KB cw=1
fs=256MB wss=1MB cw=1
fs=256MB wss=16MB cw=1
request rate bursty f raction requests per burst data span request size requests per run run length run stride locality f raction requests per sparse run sparse run length sparse run f raction time span
fs=64MB wss=1MB cw=1
Baseline only: cw=0
fs=64MB wss=256KB cw=1
Table 6.3: Effect of concurrent vs. individual sequential reading of 4 individually written files. Common parameters: fc=4, wss=256KB, cw=0, rr=0
0.80±0.09 1.76±0.42 1.03±0.04 6.68±12.6 0.99±0.10 0.92±0.10 0.92±0.01 2.80±0.03 0.98±0.00 0.05±0.01 0.05±0.01 1.39±0.30 1.25±0.11
0.90±0.10 1.23±0.33 1.04±0.05 2.29±4.19 1.00±0.11 0.97±0.11 0.98±0.01 5.04±10.5 1.00±0.00 0.18±0.03 0.18±0.03 1.31±0.28 1.10±0.10
0.80±0.09 1.81±0.44 1.03±0.04 7.78±14.4 0.99±0.10 0.91±0.10 0.91±0.01 2.80±0.03 0.98±0.00 0.05±0.01 0.05±0.01 1.39±0.30 1.25±0.11
0.86±0.08 1.66±0.21 1.03±0.03 2.03±3.17 0.99±0.08 0.93±0.07 0.92±0.01 2.79±0.02 0.98±0.00 0.04±0.00 0.04±0.00 1.18±0.06 1.17±0.05
0.94±0.08 1.13±0.15 1.03±0.04 2.67±3.95 1.00±0.08 0.97±0.08 0.98±0.01 5.18±7.25 1.00±0.00 0.14±0.01 0.14±0.01 1.15±0.06 1.05±0.05
0.85±0.08 1.65±0.22 1.04±0.03 1.39±1.72 0.99±0.08 0.92±0.07 0.91±0.01 3.90±4.94 0.98±0.00 0.04±0.00 0.04±0.00 1.18±0.06 1.18±0.05
0.78±0.15 1.67±0.75 1.06±0.09 2.55±3.69 1.01±0.09 0.91±0.09 0.92±0.03 16.5±33.5 0.98±0.01 NA±NA NA±NA 1.91±1.33 1.25±0.18
0.90±0.17 1.09±0.52 1.01±0.07 3.13±4.30 0.99±0.12 0.99±0.13 0.98±0.03 2.45±0.06 0.99±0.01 NA±NA NA±NA 1.73±1.20 1.10±0.15
0.81±0.17 1.74±0.83 1.06±0.09 2.40±3.65 1.01±0.09 0.90±0.09 0.91±0.03 2.78±0.07 0.98±0.01 NA±NA NA±NA 1.91±1.32 1.21±0.19
Table 6.4: Effect of individual sequential reading of 2 files written concurrently vs. individually. Common parameters: fc=2, rss=256KB, cr=0, rr=0
6.1.4.3 Experiment: Individual reading of concurrently written files
Purpose Measured
Determine the residual effect of concurrently written files on individual sequential reading. Individual sequantial reading after individual or concurrent writing.
Parameters file count: 2-4; file size: 64MB, 128MB, 256MB; writing: concurrent, separate; write segment size: 256KB, 1MB, 16MB; reading: separate Expected Results The concurrent writing is expected to result in physically interleaved (fragmented) files on the disk, and the resulting fragmentation should prolong the individual reading due to seeks between the fragments. The slowdown will probably be not too significant because the seeks occur in only one direction and skip relatively small areas depending on number of files and block size. Measured Results The results of the experiment are shown in tables 6.4, 6.5, and 6.6 for 2, 3, and 4 files, respectively. As expected, the impact of fragmentation during writing is lower than in case of concurrent vs. individual reading of contiguous files. The results show similar results as in previous case with respect to varying read segment size. Increasing file size appears to be increasing bursty f raction, but the increase is not very significant, because it is coupled with increasing deviation making the numbers less precise. On the other hand, increasing the number of files decreases bursty f raction, leading to slightly improved times. 6.1.4.4 Experiment: Concurrent reading of concurrently written files
Purpose
Determine the residual effect of concurrently written files on concurrent sequential reading.
c Q-ImPrESS Consortium
Dissemination Level: public
Page 133 / 210
Project Deliverable D3.3: Resource Usage Modeling
fs=64MB wss=16MB cw=1
fs=128MB wss=256KB cw=1
fs=128MB wss=1MB cw=1
fs=128MB wss=16MB cw=1
fs=256MB wss=256KB cw=1
fs=256MB wss=1MB cw=1
fs=256MB wss=16MB cw=1
request rate bursty f raction requests per burst data span request size requests per run run length run stride locality f raction requests per sparse run sparse run length sparse run f raction time span
fs=64MB wss=1MB cw=1
Baseline only: cw=0
Last change: February 3, 2009
fs=64MB wss=256KB cw=1
Version: 2.0
0.86±0.10 1.73±0.26 1.04±0.04 1.73±2.64 0.98±0.10 0.93±0.09 0.92±0.01 4.64±0.05 0.98±0.00 0.04±0.01 0.04±0.01 1.10±0.07 1.17±0.07
0.95±0.13 1.18±0.21 1.02±0.03 1.40±1.78 0.99±0.12 0.98±0.12 0.98±0.01 4.42±0.04 1.00±0.00 0.14±0.03 0.14±0.03 1.07±0.06 1.06±0.06
0.86±0.10 1.80±0.28 1.04±0.03 1.40±1.78 0.98±0.09 0.92±0.09 0.91±0.01 4.66±0.07 0.98±0.00 0.03±0.01 0.03±0.01 1.11±0.07 1.18±0.07
0.86±0.04 1.82±0.29 1.03±0.03 4.76±7.90 0.99±0.02 0.93±0.02 0.92±0.01 5.87±6.69 0.98±0.01 0.03±0.00 0.03±0.00 1.04±0.03 1.18±0.04
0.95±0.05 1.17±0.17 1.02±0.03 3.96±7.05 1.00±0.04 0.98±0.04 0.98±0.01 4.39±0.50 1.00±0.00 0.13±0.02 0.13±0.02 1.02±0.03 1.06±0.04
0.85±0.03 1.72±0.25 1.03±0.02 5.83±9.25 0.99±0.02 0.93±0.02 0.92±0.00 4.40±0.50 0.98±0.00 0.03±0.00 0.03±0.00 1.04±0.03 1.18±0.03
0.81±0.10 1.73±0.44 1.07±0.06 2.32±4.32 0.99±0.10 0.92±0.10 0.92±0.02 4.54±0.12 0.98±0.00 NA±NA NA±NA 1.37±0.42 1.24±0.14
0.92±0.13 1.09±0.37 1.03±0.06 6.83±13.1 1.00±0.12 0.98±0.13 0.98±0.02 3.87±0.13 1.00±0.00 NA±NA NA±NA 1.29±0.40 1.09±0.13
0.78±0.09 1.82±0.48 1.06±0.06 5.70±10.7 0.99±0.10 0.91±0.10 0.91±0.02 10.5±18.2 0.98±0.01 NA±NA NA±NA 1.37±0.42 1.29±0.13
fs=64MB wss=16MB cw=1
fs=128MB wss=256KB cw=1
fs=128MB wss=1MB cw=1
fs=128MB wss=16MB cw=1
fs=256MB wss=256KB cw=1
fs=256MB wss=1MB cw=1
fs=256MB wss=16MB cw=1
request rate bursty f raction requests per burst data span request size requests per run run length run stride locality f raction requests per sparse run sparse run length sparse run f raction time span
fs=64MB wss=1MB cw=1
Baseline only: cw=0
fs=64MB wss=256KB cw=1
Table 6.5: Effect of individual sequential reading of 3 files written concurrently vs. individually. Common parameters: fc=3, rss=256KB, cr=0, rr=0
0.85±0.05 1.59±0.32 1.04±0.04 2.78±4.44 0.99±0.05 0.92±0.04 0.92±0.01 7.59±5.02 0.99±0.01 0.05±0.02 0.05±0.02 1.11±0.12 1.19±0.05
0.94±0.07 1.10±0.24 1.02±0.04 4.11±6.02 1.00±0.07 0.98±0.06 0.98±0.01 6.11±0.05 1.00±0.01 0.17±0.08 0.17±0.08 1.08±0.11 1.07±0.05
0.86±0.05 1.62±0.32 1.04±0.04 2.97±4.63 0.99±0.05 0.92±0.04 0.91±0.01 7.66±5.29 0.98±0.01 0.04±0.02 0.04±0.02 1.11±0.12 1.18±0.05
0.86±0.03 1.74±0.23 1.04±0.02 1.27±1.39 0.99±0.03 0.93±0.03 0.91±0.00 5.45±1.78 0.98±0.00 0.04±0.00 0.04±0.00 1.06±0.06 1.17±0.03
0.95±0.04 1.21±0.17 1.02±0.02 2.36±3.18 1.00±0.03 0.98±0.03 0.98±0.00 5.45±1.78 1.00±0.00 0.13±0.02 0.13±0.02 1.05±0.06 1.05±0.03
0.86±0.04 1.80±0.26 1.04±0.02 2.45±3.35 0.99±0.03 0.92±0.03 0.91±0.01 5.92±2.84 0.98±0.00 0.03±0.00 0.03±0.00 1.06±0.06 1.17±0.03
0.84±0.09 1.68±0.30 1.03±0.05 0.75±1.11 1.00±0.07 0.91±0.07 0.91±0.01 10.8±13.8 0.98±0.00 0.04±0.01 0.04±0.01 1.23±0.27 1.18±0.10
0.95±0.15 1.07±0.26 1.01±0.06 1.26±1.50 1.01±0.13 0.98±0.13 0.98±0.01 7.65±10.5 1.00±0.00 0.16±0.05 0.16±0.05 1.17±0.26 1.05±0.08
0.84±0.09 1.73±0.30 1.06±0.05 1.12±1.49 1.00±0.07 0.91±0.07 0.90±0.01 15.3±18.3 0.98±0.01 0.04±0.01 0.04±0.01 1.22±0.27 1.19±0.10
Table 6.6: Effect of individual sequential reading of 4 files written concurrently vs. individually. Common parameters: fc=4, rss=256KB, cr=0, rr=0
Measured Concurrent reading after individual or concurrent writing, using the same segment size where both reading and writing is concurrent. Parameters file count: 2-4; file size: 64MB, 128MB, 256MB; writing: individual, concurrent; reading: concurrent; read/write segment size: 256KB, 1MB, 16MB Expected Results The previous experiment showed that concurrent writing results in fragmented files, as shown by the fact that it takes longer to read the same file.. Were the physical fragments exactly as large and ordered as the writes issued, concurrent reading of the same segment size should be similar to individual reading of individually written files. We have seen that this is not the case because physical fragments are usually larger. Still, interleaved files should result in faster concurrent read, because the fragments are smaller than the files themselves, reducing the seek latency. Measured Results The results of the experiment are shown in tables 6.7, 6.8, and 6.9 for 2, 3, and 4 files, respectively. The results show that concurrent writing can really improve concurrent reading performance, which is however still far from the performance of individual sequential reading of individually written files. The results follow a seemingly established trend in that results for 1 MB segment sizes show opposite tendencies than those of the other two segment sizes. This experiment is no exception – the performance for 1 MB segment sizes is actually slightly worse for concurrently vs. individually written files. Looking at other workload attributes, we can notice that when increasing the number of concurrently written files as well as file size, the slight performance gain slowly diminishes. Apart from increasing bursty f raction attribute there appears to be no other explanation for the progressive leveling of performance. c Q-ImPrESS Consortium
Dissemination Level: public
Page 134 / 210
Project Deliverable D3.3: Resource Usage Modeling
Baseline only: cw=0
fs=64MB wss=1MB cw=1 rss=1MB
fs=64MB wss=16MB cw=1 rss=16MB
fs=128MB wss=256KB cw=1 rss=256KB
fs=128MB wss=1MB cw=1 rss=1MB
fs=128MB wss=16MB cw=1 rss=16MB
fs=256MB wss=256KB cw=1 rss=256KB
fs=256MB wss=1MB cw=1 rss=1MB
fs=256MB wss=16MB cw=1 rss=16MB
Last change: February 3, 2009
fs=64MB wss=256KB cw=1 rss=256KB
Version: 2.0
request rate bursty f raction requests per burst data span request size requests per run run length run stride locality f raction requests per sparse run sparse run length sparse run f raction time span
1.52±0.13 0.66±0.21 0.97±0.02 0.65±0.94 0.75±0.03 1.26±0.03 0.92±0.01 0.02±0.00 1.06±0.02 1.26±0.05 0.94±0.02 0.98±0.00 0.88±0.07
0.95±0.10 1.05±0.26 0.99±0.04 1.49±2.04 1.00±0.09 0.99±0.09 1.00±0.02 0.17±0.16 1.00±0.00 0.66±0.07 0.67±0.04 0.98±0.04 1.04±0.08
1.60±0.13 0.88±0.35 1.05±0.02 0.86±1.01 0.75±0.03 1.01±0.02 0.96±0.03 0.15±0.41 12.6±1.66 1.03±0.01 1.01±0.01 3.28±1.04 0.84±0.05
1.50±0.07 0.70±0.17 0.97±0.02 1.08±1.14 0.75±0.02 1.25±0.03 0.91±0.01 0.01±0.00 1.05±0.01 1.23±0.05 0.92±0.02 0.98±0.00 0.89±0.03
1.00±0.07 1.10±0.13 1.01±0.03 1.78±2.36 0.98±0.07 1.00±0.07 0.99±0.01 0.20±0.31 1.00±0.00 0.66±0.05 0.65±0.02 1.00±0.01 1.01±0.04
1.56±0.06 0.88±0.19 1.05±0.02 1.13±1.68 0.74±0.02 1.02±0.01 0.96±0.01 0.01±0.00 12.7±1.62 1.03±0.01 1.01±0.01 3.26±0.59 0.86±0.03
1.27±0.25 0.88±0.38 1.02±0.06 1.44±2.06 0.84±0.09 1.12±0.09 0.94±0.03 0.12±0.31 1.02±0.03 1.11±0.12 0.94±0.02 0.98±0.01 0.92±0.13
0.99±0.18 1.07±0.50 1.03±0.08 0.92±1.02 1.01±0.12 0.99±0.11 0.99±0.03 4.06±8.72 1.00±0.01 0.75±0.20 0.75±0.18 1.02±0.08 1.01±0.17
1.56±0.24 0.73±0.42 1.06±0.07 0.81±0.73 0.76±0.05 NA±NA NA±NA NA±NA 54.6±48 1.01±0.05 1.04±0.04 3.49±2.15 0.84±0.10
Baseline only: cw=0
fs=64MB wss=256KB cw=1 rss=256KB
fs=64MB wss=1MB cw=1 rss=1MB
fs=64MB wss=16MB cw=1 rss=16MB
fs=128MB wss=256KB cw=1 rss=256KB
fs=128MB wss=1MB cw=1 rss=1MB
fs=128MB wss=16MB cw=1 rss=16MB
fs=256MB wss=256KB cw=1 rss=256KB
fs=256MB wss=1MB cw=1 rss=1MB
fs=256MB wss=16MB cw=1 rss=16MB
Table 6.7: Effect of concurrent sequential reading of 2 files written concurrently vs. individually. Common parameters: fc=2, cr=1, rr=0
request rate bursty f raction requests per burst data span request size requests per run run length run stride locality f raction requests per sparse run sparse run length sparse run f raction time span
1.40±0.09 0.74±0.31 0.98±0.02 1.92±2.65 0.75±0.03 1.25±0.03 0.91±0.02 0.03±0.04 1.05±0.01 1.23±0.06 0.93±0.01 0.98±0.00 0.95±0.05
1.00±0.13 1.08±0.24 1.01±0.03 0.92±0.99 0.98±0.13 1.00±0.13 0.99±0.01 0.24±0.17 1.00±0.00 0.72±0.10 0.71±0.05 1.00±0.02 1.02±0.06
1.50±0.09 0.91±0.26 1.05±0.02 1.87±2.40 0.74±0.02 1.01±0.02 0.95±0.02 0.08±0.04 15.8±2.83 1.03±0.01 1.00±0.01 3.29±0.74 0.90±0.04
1.40±0.04 0.74±0.15 0.96±0.01 2.21±2.50 0.75±0.02 1.25±0.02 0.91±0.01 0.01±0.00 1.05±0.01 1.21±0.04 0.91±0.02 0.98±0.00 0.95±0.02
1.01±0.05 1.06±0.15 1.01±0.03 1.45±2.10 0.98±0.05 1.01±0.05 0.99±0.01 0.28±0.37 1.00±0.01 0.64±0.07 0.63±0.06 1.00±0.01 1.02±0.03
1.55±0.05 0.92±0.17 1.04±0.01 1.00±1.07 0.74±0.02 1.02±0.01 0.97±0.01 0.01±0.00 12.2±1.74 1.03±0.01 1.00±0.00 3.25±0.57 0.87±0.02
1.35±0.13 0.71±0.20 1.02±0.04 1.91±2.36 0.76±0.04 1.24±0.04 0.92±0.02 0.12±0.21 1.05±0.02 1.21±0.07 0.93±0.02 0.98±0.01 0.97±0.08
0.98±0.17 1.11±0.43 1.03±0.05 1.96±2.76 1.01±0.16 0.99±0.16 0.99±0.02 0.53±0.17 1.00±0.01 0.69±0.14 0.69±0.07 0.97±0.07 1.02±0.12
1.54±0.19 0.82±0.20 1.10±0.04 0.89±1.43 0.75±0.03 NA±NA NA±NA NA±NA 64.6±58.8 1.02±0.02 1.02±0.02 3.40±0.84 0.87±0.09
Baseline only: cw=0
fs=64MB wss=256KB cw=1 rss=256KB
fs=64MB wss=1MB cw=1 rss=1MB
fs=64MB wss=16MB cw=1 rss=16MB
fs=128MB wss=256KB cw=1 rss=256KB
fs=128MB wss=1MB cw=1 rss=1MB
fs=128MB wss=16MB cw=1 rss=16MB
fs=256MB wss=256KB cw=1 rss=256KB
fs=256MB wss=1MB cw=1 rss=1MB
fs=256MB wss=16MB cw=1 rss=16MB
Table 6.8: Effect of concurrent sequential reading of 3 files written concurrently vs. individually. Common parameters: fc=3, cr=1, rr=0
request rate bursty f raction requests per burst data span request size requests per run run length run stride locality f raction requests per sparse run sparse run length sparse run f raction time span
1.35±0.04 0.86±0.16 0.98±0.02 1.62±1.93 0.75±0.02 1.25±0.02 0.92±0.01 0.03±0.00 1.05±0.01 1.23±0.03 0.93±0.01 0.98±0.00 0.98±0.03
1.01±0.08 1.17±0.15 1.01±0.03 0.81±0.78 0.99±0.08 0.99±0.08 0.99±0.01 0.23±0.14 1.00±0.00 0.84±0.09 0.84±0.04 0.99±0.03 1.00±0.04
1.52±0.06 0.90±0.18 1.05±0.02 1.62±1.66 0.74±0.02 1.00±0.01 0.95±0.02 0.03±0.01 12.6±1.70 1.02±0.01 1.00±0.01 3.26±0.49 0.89±0.03
1.34±0.04 0.87±0.18 0.97±0.02 0.81±1.09 0.75±0.02 1.26±0.02 0.92±0.01 0.01±0.00 1.05±0.01 1.26±0.03 0.94±0.01 0.98±0.01 1.00±0.02
1.01±0.04 1.07±0.13 1.01±0.02 0.89±1.26 0.98±0.03 1.00±0.03 0.99±0.00 0.13±0.05 1.00±0.00 0.78±0.05 0.77±0.03 1.00±0.01 1.01±0.03
1.53±0.08 0.89±0.16 1.04±0.02 0.50±0.57 0.74±0.02 1.02±0.01 0.96±0.01 0.01±0.01 9.89±1.10 1.03±0.01 0.99±0.01 3.16±0.55 0.88±0.04
1.31±0.10 0.88±0.35 0.98±0.02 1.23±1.63 0.76±0.04 1.23±0.04 0.91±0.02 0.06±0.01 1.05±0.01 1.20±0.06 0.92±0.01 0.98±0.00 1.01±0.07
0.96±0.13 1.04±0.30 1.00±0.06 1.66±2.14 0.99±0.14 1.00±0.14 0.99±0.01 0.25±0.31 1.00±0.01 0.72±0.12 0.71±0.06 0.94±0.06 1.05±0.08
1.46±0.09 0.86±0.21 1.05±0.02 1.00±1.52 0.75±0.03 0.99±0.02 0.94±0.04 0.03±0.05 11.6±1.84 1.02±0.01 1.00±0.01 3.19±0.55 0.92±0.05
Table 6.9: Effect of concurrent sequential reading of 4 files written concurrently vs. individually. Common parameters: fc=4, cr=1, rr=0
c Q-ImPrESS Consortium
Dissemination Level: public
Page 135 / 210
Project Deliverable D3.3: Resource Usage Modeling
fs=64MB rss=16MB cr=1
fs=128MB rss=256KB cr=1
fs=128MB rss=1MB cr=1
fs=128MB rss=16MB cr=1
fs=256MB rss=256KB cr=1
fs=256MB rss=1MB cr=1
fs=256MB rss=16MB cr=1
request rate bursty f raction requests per burst data span request size requests per run run length run stride locality f raction requests per sparse run sparse run length sparse run f raction time span
fs=64MB rss=1MB cr=1
Baseline only: cr=0
Last change: February 3, 2009
fs=64MB rss=256KB cr=1
Version: 2.0
0.84±0.11 0.84±0.30 1.00±0.03 1.40±1.38 1.13±0.15 0.91±0.10 1.06±0.04 2.63±0.20 0.95±0.04 0.89±0.11 1.02±0.02 0.99±0.01 1.06±0.05
1.05±0.20 1.03±0.29 0.99±0.05 0.49±0.49 1.00±0.13 1.01±0.14 1.01±0.02 1.67±3.52 1.00±0.01 0.98±0.25 0.98±0.21 0.99±0.05 0.97±0.09
0.99±0.08 1.06±0.26 1.02±0.06 0.66±0.80 1.00±0.09 1.00±0.01 1.00±0.09 2.65±1.85 0.98±0.19 1.00±0.02 0.99±0.08 0.99±0.15 1.01±0.05
0.93±0.05 0.88±0.17 0.99±0.03 0.53±0.50 1.05±0.05 0.97±0.04 1.03±0.02 2.38±0.47 0.98±0.03 0.96±0.05 1.01±0.03 1.00±0.01 1.03±0.03
1.02±0.10 1.08±0.19 1.00±0.04 0.89±0.53 1.01±0.06 0.99±0.06 1.00±0.01 1.99±1.81 1.00±0.00 0.95±0.11 0.96±0.09 0.99±0.02 0.99±0.14
1.01±0.05 1.00±0.16 1.00±0.03 0.80±0.48 1.00±0.04 1.00±0.01 1.00±0.06 2.24±0.47 1.01±0.14 1.00±0.02 1.00±0.05 1.01±0.11 1.04±0.02
0.87±0.14 0.97±0.29 0.98±0.05 0.79±0.50 1.10±0.12 0.93±0.09 1.03±0.04 2.53±0.32 0.96±0.04 0.91±0.10 0.99±0.05 0.99±0.01 1.04±0.10
1.04±0.29 0.97±0.62 NA±NA 0.88±0.64 1.02±0.17 0.99±0.16 0.99±0.05 0.52±1.66 1.00±0.01 0.91±0.20 0.91±0.17 1.10±0.23 0.88±0.15
0.96±0.14 0.76±0.36 1.00±0.05 0.75±0.44 1.06±0.12 0.94±0.05 1.04±0.16 2.28±0.76 0.87±0.31 0.94±0.06 1.01±0.15 0.94±0.31 0.99±0.07
Table 6.10: Effect of concurrent vs. individual random reading of 2 files written individually. Common parameters: fc=2, wss=256KB, cw=0, rr=1
6.1.4.5 Random access
This group of experiments assesses impact of sharing when each individual file is accessed randomly instead of sequentially, i.e. a seek to a random position inside the file is issued before each block read. The sizes of blocks that are read between two seek operations are the same as the block sizes of concurrent reading. Again, multiple files are written and/or read either individually or concurrently. 6.1.4.6 Experiment: Concurrent random reading of individually written files
Purpose Measured
Determine the effect of concurrent vs. individual random reading of individually written files. Individual or concurrent random reading after individual writing.
Parameters file count: 2-4; file size: 64MB, 128MB, 256MB; writing: individual; reading: random individual; read segment size: 256KB, 1MB, 16MB Expected Results Random concurrent reading should not affect performance compared to random individual reading as much as in the case of individual and concurrent sequential reading, because random reading of a file already causes disk seeks and does not benefit from read-ahead buffering like the sequential reading does. Concurrent reading should just increase the length of seeks and cause more buffer cache sharing, which should not be such difference without read-ahead. Measured Results The results of the experiment are shown in tables 6.10, 6.11, and 6.12 for 2, 3, and 4 files, respectively. As expected, the slowdown was much smaller than with sequential reading. However, the impact is still notable with 256 KB segment size. Again, for 1 MB segment size there is actually a very slight speedup. The assumption that concurrent reading should just increase the length of seeks is reflected in the measured values of the run stride attribute. 6.1.4.7 Experiment: Individual random reading of concurrently written files
Purpose Measured
Determine the residual effect of concurrently written files on individual random reading. Individual random reading after individual or concurrent writing.
Parameters file count: 2-4; file size: 64MB, 128MB, 256MB; writing: individual, concurrent; reading: random individual; write segment size: 256KB, read segment size: 256KB, 1MB, 16MB Expected Results As in previous experiment, the slowdown should be smaller when compared to the analogous Experiment 6.1.4.3 with sequential reading, because seeking already occurs due to random reading, and fragmented files should increase it only a little. c Q-ImPrESS Consortium
Dissemination Level: public
Page 136 / 210
Project Deliverable D3.3: Resource Usage Modeling
fs=64MB rss=16MB cr=1
fs=128MB rss=256KB cr=1
fs=128MB rss=1MB cr=1
fs=128MB rss=16MB cr=1
fs=256MB rss=256KB cr=1
fs=256MB rss=1MB cr=1
fs=256MB rss=16MB cr=1
request rate bursty f raction requests per burst data span request size requests per run run length run stride locality f raction requests per sparse run sparse run length sparse run f raction time span
fs=64MB rss=1MB cr=1
Baseline only: cr=0
Last change: February 3, 2009
fs=64MB rss=256KB cr=1
Version: 2.0
0.80±0.08 0.79±0.22 0.99±0.04 1.00±0.32 1.16±0.10 0.90±0.06 1.06±0.04 3.24±1.82 0.94±0.03 0.88±0.07 1.03±0.04 0.99±0.02 1.07±0.03
0.97±0.10 1.07±0.21 0.98±0.03 0.64±0.57 1.01±0.09 0.99±0.10 1.00±0.01 3.15±0.28 1.00±0.00 0.91±0.11 0.92±0.06 1.03±0.06 0.98±0.07
0.96±0.05 0.98±0.14 1.00±0.04 0.95±0.38 1.00±0.06 1.00±0.01 1.00±0.07 3.50±1.35 0.98±0.14 0.99±0.02 1.00±0.06 0.99±0.11 1.04±0.02
1.00±0.05 0.90±0.15 1.00±0.03 1.07±0.88 1.05±0.04 0.96±0.03 1.02±0.01 3.87±0.16 0.99±0.02 0.97±0.04 1.03±0.02 1.01±0.01 1.10±0.03
1.14±0.14 1.04±0.18 1.00±0.03 0.90±1.22 1.01±0.09 0.99±0.08 1.00±0.01 3.13±0.39 1.00±0.00 1.08±0.15 1.09±0.12 0.99±0.01 1.03±0.03
1.11±0.05 1.14±0.13 1.01±0.03 1.67±1.40 0.99±0.03 1.00±0.00 1.00±0.05 3.83±0.86 1.18±0.10 1.00±0.02 1.01±0.04 1.15±0.09 1.08±0.24
0.78±0.11 0.94±0.31 0.98±0.03 0.61±0.52 1.15±0.16 0.90±0.09 1.05±0.04 3.40±2.64 0.95±0.04 0.89±0.11 1.03±0.04 0.99±0.01 1.11±0.06
1.01±0.26 1.04±0.48 1.01±0.08 0.95±0.39 1.02±0.22 1.00±0.23 1.00±0.03 2.12±0.49 1.00±0.01 0.80±0.27 0.80±0.21 0.98±0.06 0.99±0.09
0.92±0.11 0.71±0.20 1.01±0.04 0.57±0.51 1.09±0.11 0.92±0.03 1.08±0.09 4.25±1.82 0.83±0.19 0.92±0.03 1.03±0.09 0.92±0.16 1.00±0.05
fs=64MB rss=16MB cr=1
fs=128MB rss=256KB cr=1
fs=128MB rss=1MB cr=1
fs=128MB rss=16MB cr=1
fs=256MB rss=256KB cr=1
fs=256MB rss=1MB cr=1
fs=256MB rss=16MB cr=1
request rate bursty f raction requests per burst data span request size requests per run run length run stride locality f raction requests per sparse run sparse run length sparse run f raction time span
fs=64MB rss=1MB cr=1
Baseline only: cr=0
fs=64MB rss=256KB cr=1
Table 6.11: Effect of concurrent vs. individual random reading of 3 files written individually. Common parameters: fc=3, wss=256KB, cw=0, rr=1
0.80±0.08 0.82±0.23 1.00±0.02 0.63±0.65 1.16±0.10 0.89±0.07 1.05±0.03 4.50±1.01 0.94±0.03 0.86±0.08 1.01±0.02 0.99±0.01 1.10±0.04
0.93±0.13 1.05±0.26 1.00±0.04 1.10±0.76 1.01±0.11 0.98±0.11 1.00±0.01 2.88±0.64 1.00±0.01 0.86±0.12 0.87±0.07 1.00±0.04 1.03±0.12
0.99±0.07 1.00±0.20 1.00±0.04 1.04±0.75 1.00±0.05 0.99±0.01 1.00±0.08 4.45±1.27 1.00±0.15 0.99±0.03 1.00±0.07 1.00±0.13 1.05±0.02
1.05±0.04 0.89±0.09 1.01±0.02 0.68±0.67 1.05±0.02 0.98±0.02 1.04±0.01 6.78±2.84 1.00±0.01 1.01±0.03 1.07±0.02 1.01±0.01 1.18±0.04
1.18±0.09 1.03±0.10 1.01±0.02 1.18±0.72 1.01±0.04 0.99±0.04 1.00±0.01 3.19±0.44 1.00±0.00 1.05±0.07 1.05±0.07 0.99±0.01 1.07±0.05
1.21±0.04 1.21±0.10 1.01±0.02 0.95±0.89 0.99±0.02 1.00±0.00 1.00±0.03 4.69±0.54 1.26±0.08 1.00±0.01 1.01±0.03 1.21±0.07 1.24±0.02
0.75±0.06 0.86±0.19 1.01±0.05 1.04±1.29 1.18±0.08 0.88±0.05 1.06±0.03 5.63±1.52 0.94±0.03 0.87±0.06 1.02±0.03 0.98±0.01 1.16±0.07
1.02±0.20 0.97±0.26 0.98±0.07 1.84±2.08 0.99±0.16 1.00±0.16 1.00±0.02 0.46±0.93 1.00±0.01 0.96±0.19 0.96±0.12 1.04±0.09 1.04±0.12
0.89±0.10 0.71±0.20 0.99±0.04 0.72±0.89 1.08±0.11 0.92±0.03 1.05±0.11 4.70±3.57 0.84±0.18 0.92±0.04 1.01±0.10 0.91±0.15 1.04±0.05
Table 6.12: Effect of concurrent vs. individual random reading of 4 files written individually. Common parameters: fc=4, wss=256KB, cw=0, rr=1
Measured Results The results of the experiment are shown in tables 6.13, 6.14, and 6.15 for 2, 3, and 4 files, respectively. As expected, the results mostly show slowdown which is most pronounced in case of 2 files, files size 128 MB and read segment size 16 MB. Other than that, the timing information varies without visible trend. We can also observe that the data span of the various workload configurations does not grow much, which suggests that random seeking during reads already covers most of the data area. Still, there is an increase in run stride for the fraction of requests that actually occur in a run, which means that the runs are father apart.
c Q-ImPrESS Consortium
Dissemination Level: public
Page 137 / 210
Project Deliverable D3.3: Resource Usage Modeling
fs=64MB cw=1 rss=16MB
fs=128MB cw=1 rss=256KB
fs=128MB cw=1 rss=1MB
fs=128MB cw=1 rss=16MB
fs=256MB cw=1 rss=256KB
fs=256MB cw=1 rss=1MB
fs=256MB cw=1 rss=16MB
request rate bursty f raction requests per burst data span request size requests per run run length run stride locality f raction requests per sparse run sparse run length sparse run f raction time span
fs=64MB cw=1 rss=1MB
Baseline only: cw=0
Last change: February 3, 2009
fs=64MB cw=1 rss=256KB
Version: 2.0
0.87±0.12 1.04±0.26 1.02±0.03 0.84±0.46 1.07±0.13 0.92±0.09 1.00±0.04 2.15±0.45 0.94±0.04 0.84±0.10 0.91±0.02 0.97±0.01 1.07±0.05
0.91±0.14 1.60±0.44 1.01±0.05 1.29±1.33 0.99±0.11 0.93±0.10 0.93±0.02 1.00±1.79 0.98±0.01 0.28±0.06 0.28±0.05 1.02±0.03 1.09±0.08
1.00±0.07 1.13±0.22 1.03±0.04 0.40±0.34 0.99±0.06 1.00±0.01 0.98±0.07 2.11±1.14 0.96±0.14 0.99±0.02 0.98±0.06 0.95±0.11 1.01±0.04
0.95±0.05 1.07±0.16 1.01±0.03 0.50±0.49 1.02±0.04 0.96±0.03 0.98±0.01 1.89±0.37 0.96±0.03 0.89±0.04 0.91±0.02 0.98±0.01 1.03±0.03
0.92±0.09 1.58±0.25 1.02±0.04 1.47±1.19 1.00±0.06 0.93±0.05 0.92±0.01 1.45±1.52 0.98±0.00 0.29±0.03 0.29±0.03 1.00±0.01 1.17±0.12
1.00±0.04 1.15±0.14 1.02±0.03 1.40±1.34 0.99±0.03 1.00±0.01 0.98±0.04 2.08±0.42 0.94±0.10 0.99±0.02 0.98±0.04 0.94±0.08 1.01±0.01
0.92±0.10 1.09±0.19 1.00±0.05 0.90±0.44 1.03±0.07 0.94±0.05 0.97±0.03 1.81±0.25 0.96±0.03 0.87±0.07 0.89±0.05 0.97±0.01 1.03±0.09
0.95±0.20 1.60±0.73 1.09±0.09 1.70±1.73 1.00±0.09 0.92±0.09 0.92±0.03 0.45±1.44 0.98±0.01 0.26±0.04 0.26±0.04 1.15±0.23 1.09±0.12
0.98±0.14 0.90±0.34 1.03±0.05 1.39±1.37 1.04±0.11 0.94±0.05 1.05±0.13 2.19±0.64 0.83±0.24 0.94±0.05 1.02±0.12 0.90±0.23 0.99±0.07
fs=64MB cw=1 rss=16MB
fs=128MB cw=1 rss=256KB
fs=128MB cw=1 rss=1MB
fs=128MB cw=1 rss=16MB
fs=256MB cw=1 rss=256KB
fs=256MB cw=1 rss=1MB
fs=256MB cw=1 rss=16MB
request rate bursty f raction requests per burst data span request size requests per run run length run stride locality f raction requests per sparse run sparse run length sparse run f raction time span
fs=64MB cw=1 rss=1MB
Baseline only: cw=0
fs=64MB cw=1 rss=256KB
Table 6.13: Effect of concurrent vs. individual writing of 2 files on individual random reading. Common parameters: fc=2, wss=256KB, cr=0, rr=1
0.83±0.07 0.96±0.18 1.01±0.04 0.90±0.42 1.13±0.09 0.88±0.05 1.02±0.03 2.54±1.41 0.92±0.03 0.82±0.06 0.93±0.03 0.97±0.02 1.09±0.04
0.86±0.09 1.68±0.30 1.01±0.03 0.58±0.55 0.99±0.07 0.93±0.07 0.92±0.01 3.03±1.96 0.98±0.00 0.27±0.03 0.27±0.02 1.04±0.04 1.09±0.05
0.98±0.05 1.11±0.13 1.01±0.04 1.50±1.41 0.98±0.04 1.00±0.01 0.99±0.05 3.15±1.15 0.95±0.12 0.99±0.02 0.98±0.04 0.95±0.09 1.03±0.02
0.91±0.04 1.05±0.14 1.02±0.02 2.67±2.45 1.03±0.03 0.94±0.03 0.98±0.01 2.94±0.15 0.94±0.02 0.87±0.03 0.90±0.02 0.97±0.01 1.06±0.02
0.92±0.08 1.63±0.25 1.03±0.03 0.62±0.64 1.00±0.05 0.93±0.05 0.93±0.01 2.44±0.34 0.98±0.00 0.30±0.03 0.30±0.03 1.01±0.01 1.09±0.03
0.99±0.03 1.13±0.09 1.01±0.02 0.95±0.48 0.98±0.02 1.00±0.00 0.99±0.03 3.08±0.46 0.96±0.08 1.00±0.01 0.98±0.03 0.96±0.06 1.04±0.01
0.83±0.10 1.12±0.24 1.01±0.04 1.76±1.78 1.08±0.12 0.90±0.08 0.99±0.03 2.40±1.71 0.94±0.04 0.83±0.08 0.91±0.03 0.97±0.01 1.11±0.05
0.93±0.14 1.67±0.61 1.07±0.07 2.59±1.88 0.99±0.12 0.93±0.12 0.93±0.03 2.35±0.51 0.98±0.01 0.24±0.07 0.24±0.06 1.06±0.04 1.12±0.11
0.95±0.09 0.83±0.21 1.02±0.05 2.08±1.85 1.06±0.09 0.92±0.03 1.05±0.07 3.32±0.52 0.79±0.15 0.92±0.03 1.01±0.07 0.88±0.13 0.98±0.04
fs=64MB cw=1 rss=16MB
fs=128MB cw=1 rss=256KB
fs=128MB cw=1 rss=1MB
fs=128MB cw=1 rss=16MB
fs=256MB cw=1 rss=256KB
fs=256MB cw=1 rss=1MB
fs=256MB cw=1 rss=16MB
request rate bursty f raction requests per burst data span request size requests per run run length run stride locality f raction requests per sparse run sparse run length sparse run f raction time span
fs=64MB cw=1 rss=1MB
Baseline only: cw=0
fs=64MB cw=1 rss=256KB
Table 6.14: Effect of concurrent vs. individual writing of 3 files on individual random reading. Common parameters: fc=3, wss=256KB, cr=0, rr=1
0.81±0.07 0.99±0.17 1.02±0.02 0.91±1.22 1.14±0.09 0.87±0.06 1.01±0.02 3.76±0.84 0.91±0.03 0.79±0.06 0.91±0.02 0.96±0.01 1.10±0.04
0.86±0.08 1.67±0.35 1.04±0.04 1.76±1.95 1.00±0.08 0.92±0.08 0.92±0.01 2.75±0.62 0.98±0.00 0.26±0.03 0.26±0.02 1.02±0.04 1.15±0.11
0.98±0.06 1.13±0.22 1.02±0.03 1.03±0.75 0.99±0.04 0.99±0.01 0.98±0.07 4.01±1.11 0.95±0.12 0.99±0.03 0.98±0.06 0.95±0.11 1.03±0.03
0.90±0.02 1.05±0.09 1.02±0.02 1.14±1.29 1.04±0.02 0.94±0.02 0.98±0.01 3.99±0.18 0.94±0.01 0.87±0.02 0.91±0.01 0.97±0.01 1.07±0.02
0.85±0.05 1.66±0.14 1.03±0.02 1.24±0.71 1.00±0.02 0.92±0.02 0.92±0.01 3.68±0.78 0.98±0.00 0.28±0.01 0.28±0.01 1.01±0.01 1.10±0.05
0.98±0.03 1.18±0.09 1.02±0.02 0.90±0.87 0.98±0.02 1.00±0.00 0.99±0.03 4.18±0.46 0.97±0.06 1.00±0.01 0.98±0.02 0.96±0.05 1.04±0.02
0.78±0.06 1.04±0.17 1.03±0.04 1.04±1.47 1.14±0.07 0.87±0.04 1.00±0.03 4.20±0.78 0.92±0.03 0.78±0.05 0.89±0.02 0.97±0.01 1.14±0.07
0.92±0.16 1.52±0.38 1.04±0.06 1.65±1.57 0.98±0.13 0.93±0.12 0.92±0.02 0.77±1.81 0.99±0.01 0.28±0.05 0.28±0.03 1.09±0.08 1.21±0.13
0.92±0.09 0.80±0.20 1.02±0.03 0.72±0.93 1.06±0.09 0.92±0.03 1.04±0.08 3.44±2.30 0.80±0.13 0.93±0.03 1.01±0.07 0.88±0.11 1.00±0.05
Table 6.15: Effect of concurrent vs. individual writing of 4 files on individual random reading. Common parameters: fc=3, wss=256KB, cr=0, rr=1
c Q-ImPrESS Consortium
Dissemination Level: public
Page 138 / 210
Project Deliverable D3.3: Resource Usage Modeling
Version: 2.0
Last change: February 3, 2009
Chapter 7
Virtual Machine When considering the shared resources associated with a virtual machine, we assume a common desktop and server-based virtual machine with just-in-time compilation and collected heap. Examples of such virtual machines include CLI and JVM. Same as a physical processor is an important source of implicitly shared resources for the components it hosts, so does a virtual machine provide another set of implicitly shared resources unique to the components it hosts. Since many components and services use languages hosted by virtual machines, such as C# or Java, it is natural to extend the scope of implicitly shared resources to resources involved in the virtual machine operation.
7.1 Resource: Collected Heap The collected heap is a shared resource that provides dynamic memory management to multiple components running on the same virtual machine. The essential functions provided by the collected heap to the components are allocation and freeing of memory blocks. Whenever a component requests a memory block, a free block of the requested size is found on the heap. The block is marked as used and its address is returned to the component. The component can use the memory block as long as it retains its address. When a free block of a sufficient size is not found on the heap, used blocks whose addresses are no longer retained by the components are identified as garbage and reclaimed as free. There are many algorithms to manage collected heap, with various tradeoffs in the way the memory blocks are allocated, identified as garbage and reclaimed as free. The resource sharing experiments will focus on compacting generational garbage collectors, which are the garbage collectors of choice in many virtual machines. Although the algorithms used by the virtual machines differ, the principles of the compacting generational garbage collectors provide common ground for the experiments. A compacting collector tackles the problem of heap fragmentation. During garbage collection, used and free blocks tend to be mixed on the heap. The free space is fragmented into many small blocks instead of one large block. This decreases memory utilization, since many small blocks are unable to satisfy large allocation requests that one large block would, even if the total free space stays the same. It also increases the overhead of looking up the free blocks during allocation, since a free block of the appropriate size needs to be located among many free blocks, rather than simply cut off from one large block. Finally, it also decreases the efficiency of caching, since the granularity of caching does not match the granularity of the used blocks and parts of the free blocks will therefore be cached alongside the used blocks. A compacting collector moves the used blocks to avoid fragmenting of the free space. Besides the obvious overhead of moving the used blocks, the compacting collector must also take care of referential integrity, updating the addresses of the used blocks retained by the application. A generational collector tackles the problem of collection overhead. During garbage collection, all used blocks on the heap are traversed, starting from root objects that are always accessible to an application and locating objects that are accessible transitively. A large heap can take a long time to traverse, bringing significant overhead not only in terms of computation time, but also in terms of synchronization time, since modifications of the heap are limited during traversal. c Q-ImPrESS Consortium
Dissemination Level: public
Page 139 / 210
Project Deliverable D3.3: Resource Usage Modeling
Version: 2.0
Last change: February 3, 2009
A generational collector relies on the objects being more likely to become garbage earlier in their lifetime. Objects are separated into generations, starting at the youngest and gradually moving towards the oldest as they survive collections. Younger generations are collected more often than older ones, since they are more likely to contain garbage. In order to facilitate independent collection of individual generations, references that cross the outside of generation boundary are treated as roots for the purpose of the particular generation collection.
7.1.1 Platform Details This section describes platform dependent details of the virtual machines used in the experiments for platforms introduced in Section 3.2. 7.1.1.1 Platform Desktop
The virtual machine is equipped with a generational garbage collector framework that distinguishes young and tenured generations. A configurable set of collector algorithms is available, with defaults selected depending on whether a client class platform or a server class platform is detected [17, 19, 20, 21]. The default choice on a client class platform is the Serial Collector. The Serial Collector algorithm uses copying in the young generation and marking and compacting in the tenured generation. The collector uses a single processor and stops the mutator for the entire collection. The default choice on a server class platform is the Parallel Collector, also called the Throughput Collector. The Parallel Collector differs from the Serial Collector by introducing a multiprocessor copying algorithm for the young generation collection. Optionally, the Parallel Collector can be configured to use a multiprocessor compacting algorithm for the tenured generation collection. An optional choice on both platform classes is the Mostly Concurrent Collector, also called the Low Latency Collector. The Mostly Concurrent Collector algorithm differs from the Parallel Collector by introducing a multiprocessor mark and sweep algorithm for the tenured generation collection [18]. The algorithm does not stop the mutator for the entire collection. By default, the virtual machine attempts to limit the total overhead of the garbage collection to 1 % of the execution time, extending the total heap size if this goal cannot be met. The virtual machine also imposes a limit on the total heap size, which is by default 64 MB on a client class platform and 1/4 of physical memory but at most 1 GB on a server class platform. The experiments were normalized to never exceed the limit on the total heap size. To facilitate better utilization of the available heap, the virtual machine introduces three special reference types in addition to the regular object references. A soft reference is used with objects that should not be collected as long as there is no shortage of memory. A weak reference is used with objects that should be collected but need to be tracked until they are collected. A phantom reference is used with objects that are being collected but need to be tracked while they are collected 7.1.1.2 Platform Intel Server
The same virtual machine as on Platform Desktop is used here. Only a server class machine is available though, hence using the Parallel Collector by default. To make the time measurements of the measured workload comparable with the time measurements of the garbage collector, the virtual machine was limited to run on a single core only. 7.1.1.3 Platform AMD Server
The same virtual machine as on Platform Desktop is used here. Only a server class machine is available though, hence using the Parallel Collector by default. To make the time measurements of the measured workload comparable with the time measurements of the garbage collector, the virtual machine was limited to run on a single core only. c Q-ImPrESS Consortium
Dissemination Level: public
Page 140 / 210
Project Deliverable D3.3: Resource Usage Modeling
Version: 2.0
Last change: February 3, 2009
7.1.2 Sharing Effects The effects that can influence the quality attributes when multiple components share a collected heap include: Heap dimensions The dimensions of the heap can influence both the collection efficiency and the collection overhead. The exact dependency, however, depends on the particular garbage collector implementation. Assuming that backtracking is used to traverse the heap, then the longer the sequences of references on the heap, the more backtracking information is required during collection. Reference aliasing Assuming that a compacting collector with direct references is used, then the more references to the same object, the more work needs to be done updating references on compaction. Object lifetimes The collection efficiency and the collection overhead differs for each generation. Changes in object lifetimes can cause changes in the assignment of objects to generations.
7.1.3 General Composition The effects of sharing the collected heap can be exhibited as follows: •
Any composition of components that allocate memory on the heap will change the heap dimensions, potentially influencing both the collection efficiency and the collection overhead.
•
Assume components that allocate temporary objects of relatively short lifetimes. Assume further that the lifetimes are tied to the processing speed of the components. A composition of such components can decrease the processing power available to each component, thus decreasing the processing speed of the components and increasing the lifetime of the temporary objects. When the lifetimes of the temporary objects cross a generation boundary, the collection efficiency and the collection overhead will change.
•
Assume a component that uses soft references. A composition of such a component with any components that allocate memory on the heap will change the heap dimensions, potentially influencing the conditions that trigger the collection of soft references.
7.1.4 Artificial Experiments: Overhead Dependencies The overhead of the garbage collector can depend on the allocation speed. To filter out the impact of the allocation speed, the experiments are configured for a constant allocation speed, chosen to be practically reasonable but otherwise arbitrary. The range of practically reasonable allocation speeds has been determined by profiling the derby, serial, sunflow and compiler benchmarks from the SPECjvm2008 suite [29]. On Platform Desktop, the three benchmarks allocate from 260 K to 320 K objects per second, with the average object size from 35 B to 40 B. 7.1.4.1 Experiment: Object lifetime
The experiment to determine the dependency of the collector overhead on the object lifetime uses components that allocate temporary objects in a queue. A constant number of components TotalComponents is allocated on the heap, each component allocates a constant number of payload objects Ob jectsPerComponent. Every time a component is invoked, it releases the reference to its oldest allocated object and allocates a new object. The experiment invokes each component a given number of times ConsecutiveInvocations before advancing to the next component. When the number of consecutive invocations of a component is below the number of objects per component, the lifetime of each object is TotalComponents × Ob jectsPerComponent invocations. When the number of consecutive invocations of a component exceeds the number of objects per component, the lifetime of Ob jectsPerComponent/ConsecutiveInvocations percent of objects remains the same, while the lifetime of the remaining objects changes to Ob jectsPerComponent invocations. Random accesses to the allocated objects are added to the workload to regulate the allocation speed. Purpose
Determine the dependency of the collector overhead on the object lifetime.
c Q-ImPrESS Consortium
Dissemination Level: public
Page 141 / 210
Project Deliverable D3.3: Resource Usage Modeling
Version: 2.0
Last change: February 3, 2009
Listing 7.1: Object lifetime experiment. 1 2 3 4
// Component implementation class Component { // List initialized with ObjectsPerComponent instances of Payload ArrayList oObjects;
5
void Invoke () { oObjects.remove (0); oObjects.add (new Payload ()); }
6 7 8 9 10
}
11 12 13
// Array initialized with TotalComponent instances of Component Component[] aoComponents;
14 15 16 17 18 19 20 21 22 23 24
// Workload generation for (int iComponent = 0; iComponent < TotalComponents; iComponent ++) { for (int iInvocation = 0; iInvocation < ConsecutiveInvocations; iInvocation ++) { aoComponents[iComponent].Invoke (); } }
Measured Time to perform a single component invocation from Listing 7.1, and the overhead spent by the young and the tenured generation collector. Parameters TotalComponents: 1-32 K; ObjectsPerComponent: 16; ConsecutiveInvocations: 1 for mostly long object lifetimes, 256 for mostly short object lifetimes; Normalization: 300 K objects/s, 40 B size for 1 K components. Expected Results A certain minimum number of components is necessary for the object lifetimes to cross the boundary between the young and the tenured generation. As soon as this number of components is reached, a difference in the collection efficiency and the collection overhead should be observed between the two object lifetime configurations. For ConsecutiveInvocations set to 1, 100 % of objects has the long lifetime. For ConsecutiveInvocations set to 256, 94 % of objects has the short lifetime and 6 % of objects has the long lifetime. Measured Results With the client configuration of the virtual machine, the collection overhead on Figures 7.2 and 7.3 starts growing sharply when the object lifetime exceeds 64 × 16 invocations, stabilizing around a level of 35-40 % overhead for 2048 × 16 invocations. With the server configuration of the virtual machine, the collection overhead on Figures 7.5 and 7.6 grows similarly, stabilizing around a level of 40-45 % overhead for 2048 × 16 invocations. In both configurations, the point where the collection overhead starts increasing corresponds exactly with the point where the invocation throughput starts decreasing, see Figures 7.1 and 7.4. The results of the experiment suggest that the collection overhead of objects with long lifetime is significantly larger than the collection overhead of objects with short lifetime.
c Q-ImPrESS Consortium
Dissemination Level: public
Page 142 / 210
Project Deliverable D3.3: Resource Usage Modeling
Last change: February 3, 2009
6e+05 4e+05 3e+05 2e+05
Throughput [1/s − 10 sec Avg Trim]
8e+05
Version: 2.0
old young 1
10
100
1000
10000
Allocated components
2
4
6
8
all generations young generation tenured generation
0
Collector overhead [% − 10 sec Avg Trim]
10
Figure 7.1: Invocation throughput in client configuration on Desktop.
1
10
100
1000
10000
Allocated components
Figure 7.2: Collector overhead for short lifetimes in client configuration on Desktop.
c Q-ImPrESS Consortium
Dissemination Level: public
Page 143 / 210
Project Deliverable D3.3: Resource Usage Modeling
Last change: February 3, 2009
10
20
30
40
all generations young generation tenured generation
0
Collector overhead [% − 10 sec Avg Trim]
Version: 2.0
1
10
100
1000
10000
Allocated components
1000000 600000 400000
Throughput [1/s − 10 sec Avg Trim]
Figure 7.3: Collector overhead for long lifetimes in client configuration on Desktop.
old young 1
10
100
1000
10000
Allocated components
Figure 7.4: Invocation throughput in server configuration on Desktop.
c Q-ImPrESS Consortium
Dissemination Level: public
Page 144 / 210
Project Deliverable D3.3: Resource Usage Modeling
Last change: February 3, 2009
5
10
all generations young generation tenured generation
0
Collector overhead [% − 10 sec Avg Trim]
15
Version: 2.0
1
10
100
1000
10000
Allocated components
10
20
30
40
all generations young generation tenured generation
0
Collector overhead [% − 10 sec Avg Trim]
Figure 7.5: Collector overhead for short lifetimes in server configuration on Desktop.
1
10
100
1000
10000
Allocated components
Figure 7.6: Collector overhead for long lifetimes in server configuration on Desktop.
c Q-ImPrESS Consortium
Dissemination Level: public
Page 145 / 210
Project Deliverable D3.3: Resource Usage Modeling
Version: 2.0
Last change: February 3, 2009
Effect Summary The overhead change can be visible in components with dynamically allocated objects kept around for short durations, especially durations determined by outside invocations.
7.1.4.2 Experiment: Heap depth
The experiment to determine the dependency of the collector overhead on the depth of the heap uses objects arranged in a doubly linked list. A constant number of objects TotalOb jects is allocated on the heap and arranged in a doubly linked list. The experiment releases references to randomly selected objects and replaces them with new objects. In addition to the doubly linked list, an array of TotalOb ject references, which is a root object, is also maintained. In a shallow configuration of the experiment, the array contains references to all the objects of the doubly linked list, effectively setting the average distance of each object from the root to one. In a deep configuration of the experiment, the array contains references to the first object of the doubly linked list, effectively setting the average distance of each object from the root to TotalOb ject/2. An additional array of TotalOb ject weak references to the objects is maintained to allow random selection of objects with constant complexity. Random accesses to the allocated objects are added to the workload to regulate the allocation speed. Purpose
Determine the dependency of the collector overhead on the depth of the heap.
Measured Time to perform a single object replacement from Listing 7.2, and the overhead spent by the young and the tenured generation collector. Parameters
TotalObjects: 2-128 K; Normalization: 200 K objects/s, 40 B size for 128 K objects.
Expected Results With the growing number of objects, the average object lifetime also grows, and so should the average collector overhead, as demonstrated in Experiment 7.1.4.1. If the collection overhead depends on the depth of the heap, a difference in overhead between the shallow and the deep configuration should also appear. Measured Results With both the client and the server configurations of the virtual machine, the collection overhead of the shallow heap is below the collection overhead of the deep heap for 16-512 objects, by as much as 60 %, see Figures 7.8 and 7.9 for client configuration and Figures 7.11 and 7.12 for server configuration. The results of the experiment suggest that the young generation collector is not able to collect garbage in the deep configuration. Effect Summary The overhead change can be visible in components whose dynamically allocated objects are linked to references provided by outside invocations, especially when such references connect the objects in deep graphs.
7.1.4.3 Experiment: Heap size
The experiment to determine the dependency of the collector overhead on the size of the heap uses objects arranged in a doubly linked graph. A constant number of objects TotalOb jects is allocated on the heap and arranged in a doubly linked graph with each object randomly selecting NeighborsPerOb ject neighbor objects. The experiment releases references to randomly selected objects and replaces them with new objects. An array of TotalRoots references to randomly selected objects, which is a root object, is also maintained. An additional array of TotalOb ject weak references to the objects is maintained to allow random selection of objects with constant complexity. Purpose
Determine the dependency of the collector overhead on the size of the heap.
Measured Time to perform a single object replacement from Listing 7.3, and the overhead spent by the young and the tenured generation collector. c Q-ImPrESS Consortium
Dissemination Level: public
Page 146 / 210
Project Deliverable D3.3: Resource Usage Modeling
1e+06
2e+06
Last change: February 3, 2009
5e+05 2e+05
Throughput [1/s − 10 sec Avg Trim]
Version: 2.0
deep shallow 1e+01
1e+02
1e+03
1e+04
1e+05
Allocated objects
20
40
60
all generations young generation tenured generation
0
Collector overhead [% − 10 sec Avg Trim]
80
Figure 7.7: Replacement throughput in client configuration on Desktop.
1e+01
1e+02
1e+03
1e+04
1e+05
Allocated objects
Figure 7.8: Collector overhead with shallow heap in client configuration on Desktop.
c Q-ImPrESS Consortium
Dissemination Level: public
Page 147 / 210
Project Deliverable D3.3: Resource Usage Modeling
Last change: February 3, 2009
20
40
60
all generations young generation tenured generation
0
Collector overhead [% − 10 sec Avg Trim]
80
Version: 2.0
1e+01
1e+02
1e+03
1e+04
1e+05
Allocated objects
2e+06 1e+06 5e+05 2e+05
Throughput [1/s − 10 sec Avg Trim]
Figure 7.9: Collector overhead with deep heap in client configuration on Desktop.
deep shallow 1e+01
1e+02
1e+03
1e+04
1e+05
Allocated objects
Figure 7.10: Replacement throughput in server configuration on Desktop.
c Q-ImPrESS Consortium
Dissemination Level: public
Page 148 / 210
Project Deliverable D3.3: Resource Usage Modeling
Last change: February 3, 2009
20
40
60
all generations young generation tenured generation
0
Collector overhead [% − 10 sec Avg Trim]
80
Version: 2.0
1e+01
1e+02
1e+03
1e+04
1e+05
Allocated objects
20
40
60
all generations young generation tenured generation
0
Collector overhead [% − 10 sec Avg Trim]
80
Figure 7.11: Collector overhead with shallow heap in server configuration on Desktop.
1e+01
1e+02
1e+03
1e+04
1e+05
Allocated objects
Figure 7.12: Collector overhead with deep heap in server configuration on Desktop.
c Q-ImPrESS Consortium
Dissemination Level: public
Page 149 / 210
Project Deliverable D3.3: Resource Usage Modeling
Version: 2.0
Last change: February 3, 2009
Listing 7.2: Heap depth experiment. 1 2 3 4 5
// Object implementation class Payload { Payload oPrev; Payload oNext; }
6 7 8
// In shallow configuration, array initialized // with references to TotalObjects objects
9 10 11 12
// In deep configuration, array initialized // with TotalObjects references to one object Payload[] aoRoot;
13 14 15 16
// Array initialized with weak references // to TotalObjects objects WeakReference[] aoObjects;
17 18 19 20 21 22 23 24
// Workload generation while (true) { // Pick a victim for replacement and create the replacement int iVictim = oRandom.nextInt (aoObjects.length - 1) + 1; Payload oVictim = aoObjects[iVictim].get (); Payload oReplacement = new Payload (); aoObjects[iVictim] = new WeakReference (oReplacement);
25
// Connect the replacement in place of the victim. oReplacement.oPrev = oVictim.oPrev; oReplacement.oPrev.oNext = oReplacement; oReplacement.oNext = oVictim.oNext; oReplacement.oNext.oPrev = oReplacement;
26 27 28 29 30 31
// In shallow configuration, connect to root if (Shallow) aoRoot[iVictim] = oReplacement;
32 33 34
}
Parameters
TotalObjects: 1 K-128 K; Normalization: 160 K objects/s, 40 B size for 128 K objects.
Expected Results With the growing number of objects, the average object lifetime also grows, and so should the average collector overhead, as demonstrated in Experiment 7.1.4.1. If the collection overhead depends on the size of the heap, the dependency should also appear. Measured Results The results of the experiment on Figures 7.13 to 7.16 show the collection overhead staying constant for the young generation collector and growing slowly with the heap size for the tenured generation collector.
Effect Summary
The overhead change can be visible in any components with dynamically allocated objects.
c Q-ImPrESS Consortium
Dissemination Level: public
Page 150 / 210
Project Deliverable D3.3: Resource Usage Modeling
40000
50000
70000
Last change: February 3, 2009
30000
Throughput [1/s − 10 sec Avg]
Version: 2.0
base 1024
2048
4096
8192
16384
32768
65536
131072
Allocated objects
10
20
30
40
all generations young generation tenured generation
0
Collector overhead [% − 10 sec Avg Trim]
Figure 7.13: Replacement throughput in client configuration on Desktop.
1e+03
2e+03
5e+03
1e+04
2e+04
5e+04
1e+05
Allocated objects
Figure 7.14: Collector overhead in client configuration on Desktop.
c Q-ImPrESS Consortium
Dissemination Level: public
Page 151 / 210
Project Deliverable D3.3: Resource Usage Modeling
Last change: February 3, 2009
80000 60000 40000
Throughput [1/s − 10 sec Avg]
120000
Version: 2.0
base 1024
2048
4096
8192
16384
32768
65536
131072
Allocated objects
10
20
30
40
all generations young generation tenured generation
0
Collector overhead [% − 10 sec Avg Trim]
50
Figure 7.15: Replacement throughput in server configuration on Desktop.
1e+03
2e+03
5e+03
1e+04
2e+04
5e+04
1e+05
Allocated objects
Figure 7.16: Collector overhead in server configuration on Desktop.
c Q-ImPrESS Consortium
Dissemination Level: public
Page 152 / 210
Project Deliverable D3.3: Resource Usage Modeling
Version: 2.0
Last change: February 3, 2009
Listing 7.3: Heap size experiment. 1 2 3 4
// Object implementation class Payload { ArrayList oForward; ArrayList oBackward;
5
// Establishes references to neighbor objects void Link () { ... };
6 7 8
// Releases references to neighbor objects void Unlink () { ... };
9 10 11
}
12 13 14
// Array initialized with references to TotalRoots objects Payload[] aoRoots;
15 16 17
// Array initialized with weak references to TotalObjects objects WeakReference[] aoObjects;
18 19 20 21 22 23 24 25 26
// Workload generation while (true) { // Pick a victim for replacement // and create the replacement int iVictim = oRandom.nextInt (aoObjects.length); Payload oVictim = aoObjects[iVictim].get (); Payload oReplacement = new Payload (); aoObjects[iVictim] = new WeakReference (oReplacement);
27
// Disconnect the victim and connect the replacement oVictim.Unlink (); oReplacement.Link ();
28 29 30 31
// Update root list if necessary if (oRoots.remove (oVictim)) oRoots.add (...);
32 33 34
}
7.1.4.4 Varying Allocation Speed
Sharing the collected heap influences the allocation speed. Additional experiments are therefore introduced to examine the impact of the allocation speed on the collector overhead, noting that the allocation speed was constant in the previous experiments. The experiments use the workloads from Listings 7.1, 7.2 and 7.3, adjusting the allocation speed by changing the number of random accesses to the allocated objects, which are performed by the workload to regulate the allocation speed. 7.1.4.5 Experiment: Allocation speed with object lifetime
Purpose Determine the dependency of the collector overhead on the allocation speed in combination with varying object lifetimes from Listing 7.1. Measured
The overhead spent by the young and the tenured generation collector.
c Q-ImPrESS Consortium
Dissemination Level: public
Page 153 / 210
Project Deliverable D3.3: Resource Usage Modeling
Young generation Tenured generation All generations
5
10
15
20
Last change: February 3, 2009
0
Collector overhead [% − 10 sec Avg]
Version: 2.0
0.0e+00
5.0e+06
1.0e+07
1.5e+07
2.0e+07
2.5e+07
3.0e+07
Allocation speed [objects/s]
5
10
15
Young generation Tenured generation All generations
0
Collector overhead [% − 10 sec Avg]
Figure 7.17: Collector overhead with 1 components and short object lifetimes on Intel Server.
0.0e+00
5.0e+06
1.0e+07
1.5e+07
2.0e+07
2.5e+07
Allocation speed [objects/s]
Figure 7.18: Collector overhead with 512 components and short object lifetimes on Intel Server.
Parameters TotalComponents: 1-16 K objects; ObjectsPerComponent: 16; ConsecutiveInvocations: 1 for mostly long object lifetimes, 256 for mostly short object lifetimes; Random accesses: 0-1024; Maximum heap size: 64 MB. Expected Results With the growing allocation speed, the number of objects that need to be collected per unit of time also grows and the collector overhead should therefore also increase. The results of Experiment 7.1.4.1 suggest that the overhead can also differ for different object lifetimes. Measured Results The collector overhead on a heap with mostly short object lifetimes is displayed on Figures 7.17 to 7.20. The collector overhead on a heap with mostly long object lifetimes is displayed on Figures 7.21 to 7.24. c Q-ImPrESS Consortium
Dissemination Level: public
Page 154 / 210
Project Deliverable D3.3: Resource Usage Modeling
Last change: February 3, 2009
10
20
30
Young generation Tenured generation All generations
0
Collector overhead [% − 10 sec Avg]
40
Version: 2.0
0.0e+00
5.0e+06
1.0e+07
1.5e+07
2.0e+07
Allocation speed [objects/s]
10
20
30
40
Young generation Tenured generation All generations
0
Collector overhead [% − 10 sec Avg]
50
Figure 7.19: Collector overhead with 4 K components and short object lifetimes on Intel Server.
0.0e+00
5.0e+06
1.0e+07
1.5e+07
Allocation speed [objects/s]
Figure 7.20: Collector overhead with 16 K components and short object lifetimes on Intel Server.
c Q-ImPrESS Consortium
Dissemination Level: public
Page 155 / 210
Project Deliverable D3.3: Resource Usage Modeling
Young generation Tenured generation All generations
5
10
15
20
Last change: February 3, 2009
0
Collector overhead [% − 10 sec Avg]
Version: 2.0
0.0e+00
5.0e+06
1.0e+07
1.5e+07
2.0e+07
2.5e+07
3.0e+07
Allocation speed [objects/s]
25 5
10
15
20
Young generation Tenured generation All generations
0
Collector overhead [% − 10 sec Avg]
Figure 7.21: Collector overhead with 1 component and long object lifetimes on Intel Server.
0.0e+00
5.0e+06
1.0e+07
1.5e+07
2.0e+07
Allocation speed [objects/s]
Figure 7.22: Collector overhead with 512 components and long object lifetimes on Intel Server.
The results suggest that for large heaps, the dependency of the collector overhead on the allocation speed is close to linear. For small heaps, however, the dependency is anomalous in the sense that a higher allocation speed can result in a smaller collector overhead.
Open Issues The results for one allocated component in both experiment configurations, displayed on Figures 7.17 and 7.21, show the overhead peaking near the middle of the plot. For higher allocation speeds, the collection is triggered aproximately two times more often than in the peak case, but each collection takes 25-30 times less time. This anomaly can have many causes, including internal optimizations. c Q-ImPrESS Consortium
Dissemination Level: public
Page 156 / 210
Project Deliverable D3.3: Resource Usage Modeling
Version: 2.0
10
20
30
40
50
60
Young generation Tenured generation All generations
0
Collector overhead [% − 10 sec Avg]
Last change: February 3, 2009
0e+00
1e+06
2e+06
3e+06
4e+06
5e+06
6e+06
Allocation speed [objects/s]
20
40
60
Young generation Tenured generation All generations
0
Collector overhead [% − 10 sec Avg]
80
Figure 7.23: Collector overhead with 4 K components and long object lifetimes on Intel Server.
200000
400000
600000
800000
1000000
1200000
1400000
1600000
Allocation speed [objects/s]
Figure 7.24: Collector overhead with 16 K components and long object lifetimes on Intel Server.
7.1.4.6 Experiment: Allocation speed with heap depth
Purpose Determine the dependency of the collector overhead on the allocation speed in combination with varying depths of the heap from Listing 7.2. Measured Parameters
The overhead spent by the young and the tenured generation collector. TotalObjects: 2-64 K; Random accesses: 0-1024; Maximum heap size: 64 MB.
Expected Results With the growing allocation speed, the number of objects that need to be collected per unit of time also grows and the collector overhead should therefore also increase. The results of Experiment 7.1.4.2 suggest that the overhead can also differ for different depths of the heap. Measured Results
The results of the experiment for shallow heap configurations are on Figures 7.25 to 7.28.
c Q-ImPrESS Consortium
Dissemination Level: public
Page 157 / 210
Project Deliverable D3.3: Resource Usage Modeling
Last change: February 3, 2009
5
10
15
20
Young generation Tenured generation All generations
0
Collector overhead [% − 10 sec Avg]
25
Version: 2.0
0.0e+00
5.0e+06
1.0e+07
1.5e+07
2.0e+07
2.5e+07
3.0e+07
Allocation speed [objects/s]
20
40
60
Young generation Tenured generation All generations
0
Collector overhead [% − 10 sec Avg]
Figure 7.25: Collector overhead with 2 objects and shallow heap on Intel Server.
0e+00
1e+06
2e+06
3e+06
4e+06
Allocation speed [objects/s]
Figure 7.26: Collector overhead with 1 K objects and shallow heap on Intel Server.
The results of the experiment for deep heap configurations are on Figures 7.29 to 7.32. The results suggest that for large heaps, the dependency of the collector overhead on the allocation speed is close to linear. For small heaps, however, the dependency is anomalous in the sense that a higher allocation speed can result in a smaller collector overhead. Open Issues The results for two objects in both experiment configurations, displayed on Figures 7.25 and 7.29, show the overhead peaking near the middle of the plot. For higher allocation sppeds, the collection is triggered aproximately three times more often than in the peak case, but each collection takes 20-30 times less time. This anomaly can have many causes, including internal optimizations or experiment errors, and is not yet explained. In the results for 1024 objects in the shallow heap configuration on Figure 7.26, an outlier is displayed c Q-ImPrESS Consortium
Dissemination Level: public
Page 158 / 210
Project Deliverable D3.3: Resource Usage Modeling
Last change: February 3, 2009
10
20
30
40
50
60
Young generation Tenured generation All generations
0
Collector overhead [% − 10 sec Avg]
70
Version: 2.0
0
500000
1000000
1500000
2000000
2500000
3000000
Allocation speed [objects/s]
20
40
60
Young generation Tenured generation All generations
0
Collector overhead [% − 10 sec Avg]
Figure 7.27: Collector overhead with 8 K objects and shallow heap on Intel Server.
2e+05
4e+05
6e+05
8e+05
Allocation speed [objects/s]
Figure 7.28: Collector overhead with 64 K objects and shallow heap on Intel Server.
among the higher allocation speeds. This outlier is observed on a configuration with 16 random accesses that regulate the allocation speed, while two neighboring values are observed on configurations with 0 and 1 random accesses. It is surprising that increasing the number of random accesses in between allocations can actually increase the allocation speed. This anomaly can have many causes, including internal optimizations or experiment errors, and is not yet explained. 7.1.4.7 Experiment: Allocation speed with heap size
Purpose Determine the dependency of the collector overhead on the allocation speed in combination with varying sizes of the heap from Listing 7.3. Measured
The overhead spent by the young and the tenured generation collector.
c Q-ImPrESS Consortium
Dissemination Level: public
Page 159 / 210
Project Deliverable D3.3: Resource Usage Modeling
Version: 2.0
5
10
15
20
Young generation Tenured generation All generations
0
Collector overhead [% − 10 sec Avg]
Last change: February 3, 2009
0.0e+00
5.0e+06
1.0e+07
1.5e+07
2.0e+07
2.5e+07
3.0e+07
Allocation speed [objects/s]
20
40
60
Young generation Tenured generation All generations
0
Collector overhead [% − 10 sec Avg]
Figure 7.29: Collector overhead with 2 objects and deep heap on Intel Server.
0e+00
1e+06
2e+06
3e+06
4e+06
Allocation speed [objects/s]
Figure 7.30: Collector overhead with 1 K objects and deep heap on Intel Server.
Parameters
TotalObjects: 1-64 K; Random accesses: 0-1024; Maximum heap size: 64 MB.
Expected Results With the growing allocation speed, the number of objects that need to be collected per unit of time also grows and the collector overhead should therefore also increase. Measured Results The results of the experiment on Figures 7.33 to 7.36 show that the collection overhead is growing with both the allocation speed and the heap size. The correlation coefficients indicate that the dependency of the collector overhead on the allocation speed is close to linear. The correlation coefficients are given for more heap sizes than the dependency graphs, which would take too much space. c Q-ImPrESS Consortium
Dissemination Level: public
Page 160 / 210
Project Deliverable D3.3: Resource Usage Modeling
Last change: February 3, 2009
10
20
30
40
50
60
Young generation Tenured generation All generations
0
Collector overhead [% − 10 sec Avg]
70
Version: 2.0
0
500000
1000000
1500000
2000000
2500000
3000000
Allocation speed [objects/s]
20
40
60
Young generation Tenured generation All generations
0
Collector overhead [% − 10 sec Avg]
Figure 7.31: Collector overhead with 8 K objects and deep heap on Intel Server.
2e+05
4e+05
6e+05
8e+05
1e+06
Allocation speed [objects/s]
Figure 7.32: Collector overhead with 64 K objects and deep heap on Intel Server.
Number of objects 1024 2048 4096 8192 16384 32768 65536
Correlation coefficient 0.9859 0.9934 0.9964 0.9995 0.9994 0.9997 0.9989
If the plots are interpreted as linear, the dependency of their linear coefficients on the number of objects is also linear, as displayed on Figure 7.37. The correlation coefficient is 0.9987. c Q-ImPrESS Consortium
Dissemination Level: public
Page 161 / 210
Project Deliverable D3.3: Resource Usage Modeling
Last change: February 3, 2009
2
4
6
8
10
Young generation Tenured generation All generations
0
Collector overhead [% − 10 sec Avg]
12
Version: 2.0
0
500000
1000000
1500000
2000000
2500000
Allocation speed [objects/s]
Figure 7.33: Collector overhead with 1 K objects on Intel Server.
10 5 0
Collector overhead [% − 10 sec Avg]
15
Young generation Tenured generation All generations
0
500000
1000000
1500000
Allocation speed [objects/s]
Figure 7.34: Collector overhead with 4 K objects on Intel Server.
7.1.4.8 Varying Maximum Heap Size
Previous work [43] indicates that the collector overhead depends on the relationship between the occupied heap size and the maximum heap size. Additional experiments are therefore introduced to examine the impact of the maximum heap size on the collector overhead, noting that the maximum heap size was constant in the previous experiments. The experiments use the workloads from Listings 7.1, 7.2 and 7.3. 7.1.4.9 Experiment: Maximum heap size with object lifetime
Purpose Determine the dependency of the collector overhead on the maximum heap size in combination with varying object lifetimes from Listing 7.1. c Q-ImPrESS Consortium
Dissemination Level: public
Page 162 / 210
Project Deliverable D3.3: Resource Usage Modeling
Young generation Tenured generation All generations
5
10
15
20
25
30
Last change: February 3, 2009
0
Collector overhead [% − 10 sec Avg]
35
Version: 2.0
1e+05
2e+05
3e+05
4e+05
5e+05
Allocation speed [objects/s]
50 10
20
30
40
Young generation Tenured generation All generations
0
Collector overhead [% − 10 sec Avg]
60
Figure 7.35: Collector overhead with 16 K objects on Intel Server.
50000
100000
150000
200000
250000
Allocation speed [objects/s]
Figure 7.36: Collector overhead with 64 K objects on Intel Server.
Measured Parameters
The overhead spent by the young and the tenured generation collector. TotalComponents: 16 K; Random accesses: 0-1024; Maximum heap size: 64-2048 MB.
Expected Results The collector overhead should decrease with increasing maximum heap size. The results of Experiment 7.1.4.1 suggest that the overhead can also differ for different object lifetimes. Measured Results The results on Figures 7.38 to 7.40 show that for a heap with mostly short object lifetimes, the collection overhead generally decreases with increasing maximum heap size. Some exceptions to the trend can be noted for small maximum heap sizes. The results on Figures 7.41 to 7.42 show similar behavior for a heap with mostly long object lifetimes. c Q-ImPrESS Consortium
Dissemination Level: public
Page 163 / 210
Project Deliverable D3.3: Resource Usage Modeling
Last change: February 3, 2009
0.00000 0.00005 0.00010 0.00015 0.00020 0.00025
Linear coefficients
Version: 2.0
0
10000
20000
30000
40000
50000
60000
Allocated objects
10
20
30
40
Young generation Tenured generation All generations
0
Collector overhead [% − 10 sec Avg]
Figure 7.37: Linear coefficient of collector overhead with 1-64 K objects on Intel Server.
0
500
1000
1500
2000
Maximum heap size [MB]
Figure 7.38: Collector overhead with different maximum heap sizes, 0 random accesses and short object lifetimes on Intel Server.
c Q-ImPrESS Consortium
Dissemination Level: public
Page 164 / 210
Project Deliverable D3.3: Resource Usage Modeling
Last change: February 3, 2009
2
4
6
8
Young generation Tenured generation All generations
0
Collector overhead [% − 10 sec Avg]
10
Version: 2.0
0
500
1000
1500
2000
Maximum heap size [MB]
Figure 7.39: Collector overhead with different maximum heap sizes, 64 random accesses and short object lifetimes on Intel Server.
1.5 1.0 0.5 0.0
Collector overhead [% − 10 sec Avg]
2.0
Young generation Tenured generation All generations
0
500
1000
1500
2000
Maximum heap size [MB]
Figure 7.40: Collector overhead with different maximum heap sizes, 1024 random accesses and short object lifetimes on Intel Server.
c Q-ImPrESS Consortium
Dissemination Level: public
Page 165 / 210
Project Deliverable D3.3: Resource Usage Modeling
Last change: February 3, 2009
20
40
60
Young generation Tenured generation All generations
0
Collector overhead [% − 10 sec Avg]
80
Version: 2.0
0
500
1000
1500
2000
Maximum heap size [MB]
2
4
6
8
Young generation Tenured generation All generations
0
Collector overhead [% − 10 sec Avg]
10
Figure 7.41: Collector overhead with different maximum heap sizes, 0 random accesses and long object lifetimes on Intel Server.
0
500
1000
1500
2000
Maximum heap size [MB]
Figure 7.42: Collector overhead with different maximum heap sizes, 1024 random accesses and long object lifetimes on Intel Server.
c Q-ImPrESS Consortium
Dissemination Level: public
Page 166 / 210
Project Deliverable D3.3: Resource Usage Modeling
30
40
Last change: February 3, 2009
10
20
Young generation Tenured generation All generations
0
Collector overhead [% − 10 sec Avg]
Version: 2.0
0.0e+00
5.0e+06
1.0e+07
1.5e+07
Allocation speed [objects/s]
10 5
Young generation Tenured generation All generations
0
Collector overhead [% − 10 sec Avg]
15
Figure 7.43: Collector overhead with maximum heap size 64 MB, different allocation speed and short object lifetimes on Intel Server.
0.0e+00
5.0e+06
1.0e+07
1.5e+07
2.0e+07
2.5e+07
3.0e+07
Allocation speed [objects/s]
Figure 7.44: Collector overhead with maximum heap size 2048 MB, different allocation speed and short object lifetimes on Intel Server.
The same results are presented in graphs arranged to plot the collection overhead against the allocation speed rather than the maximum heap size, for heap with mostly short object lifetimes on Figures 7.43 and 7.44, and for heap with mostly long object lifetimes on Figures 7.45 and 7.46.
c Q-ImPrESS Consortium
Dissemination Level: public
Page 167 / 210
Project Deliverable D3.3: Resource Usage Modeling
Last change: February 3, 2009
60 20
40
Young generation Tenured generation All generations
0
Collector overhead [% − 10 sec Avg]
80
Version: 2.0
200000
400000
600000
800000
1000000
1200000
1400000
1600000
Allocation speed [objects/s]
4 3 1
2
Young generation Tenured generation All generations
0
Collector overhead [% − 10 sec Avg]
5
Figure 7.45: Collector overhead with maximum heap size 64 MB, different allocation speed and long object lifetimes on Intel Server.
0e+00
2e+06
4e+06
6e+06
8e+06
Allocation speed [objects/s]
Figure 7.46: Collector overhead with maximum heap size 2048 MB, different allocation speed and long object lifetimes on Intel Server.
c Q-ImPrESS Consortium
Dissemination Level: public
Page 168 / 210
Project Deliverable D3.3: Resource Usage Modeling
Version: 2.0
Last change: February 3, 2009
7.1.4.10 Experiment: Maximum heap size with heap depth
Purpose Determine the dependency of the collector overhead on the maximum heap size in combination with varying depths of the heap from Listing 7.2. Measured Parameters
The overhead spent by the young and the tenured generation collector. TotalObjects: 128 K; Random accesses: 0-1024; Maximum heap size: 64-2048 MB.
Expected Results The collector overhead should decrease with increasing maximum heap size. The results of Experiment 7.1.4.2 suggest that the overhead can also differ for different depths of the heap. Measured Results The results on Figures 7.47 and 7.48 show the expected decrease of overhead for shallow heap configuration. The results on Figures 7.49 and 7.50 show similar behavior for deep heap configuration. The same results are presented in graphs arranged to plot the collection overhead against the allocation speed rather than the maximum heap size, for shallow heap configuration on Figures 7.51 and 7.52, and for deep heap configurations on Figures 7.53 and 7.54. 7.1.4.11 Experiment: Maximum heap size with heap size
Purpose Determine the dependency of the collector overhead on the maximum heap size in combination with varying sizes of the heap from Listing 7.3. Measured Parameters
The overhead spent by the young and the tenured generation collector. TotalObjects: 1-64 K; Random accesses: 0-1024; Maximum heap size: 64-2048 MB.
Expected Results Measured Results
The collector overhead should decrease with increasing maximum heap size. The results on Figures 7.55 to 7.57 show the expected decrease of collection overhead.
The same results are presented in graphs arranged to plot the collection overhead against the allocation speed rather than the maximum heap size on Figures 7.58 to 7.61. 7.1.4.12 Constant Heap Occupation Ratio
With various parameters of the garbage collector, such as generation sizes or collection triggers, being relative to the maximum heap size, it is possible that the collector overhead depends on the ratio between the occupied heap size and the maximum heap size. Additional experiments are therefore introduced to examine the stability of the collector overhead when both the occupied heap size and the maximum heap size change, but their ratio stays constant. The experiments use the workloads from Listings 7.1, 7.2 and 7.3.
c Q-ImPrESS Consortium
Dissemination Level: public
Page 169 / 210
Project Deliverable D3.3: Resource Usage Modeling
Last change: February 3, 2009
20
40
60
Young generation Tenured generation All generations
0
Collector overhead [% − 10 sec Avg]
Version: 2.0
0
500
1000
1500
2000
Maximum heap size [MB]
Figure 7.47: Collector overhead with different maximum heap sizes, 0 random accesses and shallow heap configuration on Intel Server.
6 4 2 0
Collector overhead [% − 10 sec Avg]
8
Young generation Tenured generation All generations
0
500
1000
1500
2000
Maximum heap size [MB]
Figure 7.48: Collector overhead with different maximum heap sizes, 1024 random accesses and shallow heap configuration on Intel Server.
c Q-ImPrESS Consortium
Dissemination Level: public
Page 170 / 210
Project Deliverable D3.3: Resource Usage Modeling
Last change: February 3, 2009
20
40
60
Young generation Tenured generation All generations
0
Collector overhead [% − 10 sec Avg]
Version: 2.0
0
500
1000
1500
2000
Maximum heap size [MB]
2
4
6
Young generation Tenured generation All generations
0
Collector overhead [% − 10 sec Avg]
8
Figure 7.49: Collector overhead with different maximum heap sizes, 0 random accesses and deep heap configuration on Intel Server.
0
500
1000
1500
2000
Maximum heap size [MB]
Figure 7.50: Collector overhead with different maximum heap sizes, 1024 random accesses and deep heap configuration on Intel Server.
c Q-ImPrESS Consortium
Dissemination Level: public
Page 171 / 210
Project Deliverable D3.3: Resource Usage Modeling
Young generation Tenured generation All generations
20
40
60
Last change: February 3, 2009
0
Collector overhead [% − 10 sec Avg]
Version: 2.0
2e+05
4e+05
6e+05
8e+05
Allocation speed [objects/s]
30 20 10
Young generation Tenured generation All generations
0
Collector overhead [% − 10 sec Avg]
40
Figure 7.51: Collector overhead with maximum heap size 64 MB, different allocation speed and shallow heap on Intel Server.
500000
1000000
1500000
2000000
2500000
Allocation speed [objects/s]
Figure 7.52: Collector overhead with maximum heap size 2048 MB, different allocation speed and shallow heap on Intel Server.
c Q-ImPrESS Consortium
Dissemination Level: public
Page 172 / 210
Project Deliverable D3.3: Resource Usage Modeling
60
Last change: February 3, 2009
20
40
Young generation Tenured generation All generations
0
Collector overhead [% − 10 sec Avg]
Version: 2.0
2e+05
4e+05
6e+05
8e+05
Allocation speed [objects/s]
30 10
20
Young generation Tenured generation All generations
0
Collector overhead [% − 10 sec Avg]
40
Figure 7.53: Collector overhead with maximum heap size 64 MB, different allocation speed and deep heap on Intel Server.
0
500000
1000000
1500000
2000000
2500000
Allocation speed [objects/s]
Figure 7.54: Collector overhead with maximum heap size 2048 MB, different allocation speed and deep heap on Intel Server.
c Q-ImPrESS Consortium
Dissemination Level: public
Page 173 / 210
Project Deliverable D3.3: Resource Usage Modeling
Last change: February 3, 2009
40 30 10
20
Young generation Tenured generation All generations
0
Collector overhead [% − 10 sec Avg]
50
Version: 2.0
0
500
1000
1500
2000
Maximum heap size [MB]
20 15 5
10
Young generation Tenured generation All generations
0
Collector overhead [% − 10 sec Avg]
25
Figure 7.55: Collector overhead with different maximum heap sizes and 0 random accesses on Intel Server.
0
500
1000
1500
2000
Maximum heap size [MB]
Figure 7.56: Collector overhead with different maximum heap sizes and 64 random accesses on Intel Server.
c Q-ImPrESS Consortium
Dissemination Level: public
Page 174 / 210
Project Deliverable D3.3: Resource Usage Modeling
3
Last change: February 3, 2009
1
2
Young generation Tenured generation All generations
0
Collector overhead [% − 10 sec Avg]
Version: 2.0
0
500
1000
1500
2000
Maximum heap size [MB]
40 30 10
20
Young generation Tenured generation All generations
0
Collector overhead [% − 10 sec Avg]
50
Figure 7.57: Collector overhead with different maximum heap sizes and 1024 random accesses on Intel Server.
50000
100000
150000
200000
250000
Allocation speed [objects/s]
Figure 7.58: Collector overhead with maximum heap size 64 MB and different allocation speed on Intel Server.
c Q-ImPrESS Consortium
Dissemination Level: public
Page 175 / 210
Project Deliverable D3.3: Resource Usage Modeling
Last change: February 3, 2009
20 15 5
10
Young generation Tenured generation All generations
0
Collector overhead [% − 10 sec Avg]
25
Version: 2.0
0e+00
1e+05
2e+05
3e+05
4e+05
Allocation speed [objects/s]
3 1
2
Young generation Tenured generation All generations
0
Collector overhead [% − 10 sec Avg]
4
Figure 7.59: Collector overhead with maximum heap size 256 MB and different allocation speed on Intel Server.
0e+00
1e+05
2e+05
3e+05
4e+05
5e+05
6e+05
Allocation speed [objects/s]
Figure 7.60: Collector overhead with maximum heap size 1024 MB and different allocation speed on Intel Server.
c Q-ImPrESS Consortium
Dissemination Level: public
Page 176 / 210
Project Deliverable D3.3: Resource Usage Modeling
3
Last change: February 3, 2009
1
2
Young generation Tenured generation All generations
0
Collector overhead [% − 10 sec Avg]
Version: 2.0
0e+00
1e+05
2e+05
3e+05
4e+05
5e+05
6e+05
Allocation speed [objects/s]
Figure 7.61: Collector overhead with maximum heap size 2048 MB and different allocation speed on Intel Server.
c Q-ImPrESS Consortium
Dissemination Level: public
Page 177 / 210
Project Deliverable D3.3: Resource Usage Modeling
Version: 2.0
Last change: February 3, 2009
7.1.4.13 Experiment: Constant heap occupation with object lifetime
Purpose Determine the dependency of the collector overhead on the maximum heap size with constant occupation ratio, in combination with varying object lifetimes from Listing 7.1. Measured
The overhead spent by the young and the tenured generation collector.
Parameters TotalComponents: 16-256 K; Random accesses: 0-1024; Maximum heap size: 64-1024 MB. TotalComponents and maximum heap size are doubled together. Expected Results If enough parameters of the garbage collector are relative to the heap occupation, expressed as a ratio of the occupied heap size and the maximum heap size, the dependency of the collector overhead on the maximum heap size with constant occupation ratio should be rather small. Measured Results and 7.63.
The results for a heap with mostly short object lifetimes are displayed on Figures 7.62
The results for a heap with mostly long object lifetimes are displayed on Figures 7.64 and 7.65. For both configurations, the overhead remains almost constant regardless of the maximum heap size, and also regardless of the allocation speed. The results for varying allocation speeds are not presented in detail but match this general observation as well. 7.1.4.14 Experiment: Constant heap occupation with heap depth
Purpose Determine the dependency of the collector overhead on the maximum heap size with constant occupation ratio, in combination with varying depths of the heap from Listing 7.2. Measured
The overhead spent by the young and the tenured generation collector.
Parameters TotalObjects: 64-1024 K; Random accesses: 0-1024; Maximum heap size: 64-1024 MB. TotalObjects and maximum heap size are doubled together. Expected Results If enough parameters of the garbage collector are relative to the heap occupation, expressed as a ratio of the occupied heap size and the maximum heap size, the dependency of the collector overhead on the maximum heap size with constant occupation ratio should be rather small. Measured Results
The results for deep heap configuration are displayed on Figures 7.66 and 7.67.
The results for shallow heap configuration are displayed on Figures 7.68 and 7.69. For both configurations, the overhead remains almost constant regardless of the maximum heap size, and also regardless of the allocation speed. The results for other allocation speeds are not presented in detail but match this general observation as well. 7.1.4.15 Experiment: Constant heap occupation with heap size
Purpose Determine the dependency of the collector overhead on the maximum heap size with constant occupation ratio, in combination with varying sizes of the heap from Listing 7.3. Measured
The overhead spent by the young and the tenured generation collector.
Parameters TotalObjects: 64-1024 K; Random accesses: 0-1024; Maximum heap size: 64-1024 MB. TotalObjects and maximum heap size are doubled together. Expected Results If enough parameters of the garbage collector are relative to the heap occupation, expressed as a ratio of the occupied heap size and the maximum heap size, the dependency of the collector overhead on the maximum heap size with constant occupation ratio should be rather small. Measured Results
The results are displayed on Figures 7.70 to 7.72.
The overhead remains almost constant regardless of the maximum heap size, and also regardless of the allocation speed. c Q-ImPrESS Consortium
Dissemination Level: public
Page 178 / 210
Project Deliverable D3.3: Resource Usage Modeling
Last change: February 3, 2009
40 30 20 10
Young generation Tenured generation All generations
0
Collector overhead [% − 10 sec Avg]
50
Version: 2.0
200
400
600
800
1000
Maximum heap size [MB] and total number of components [1/4 K]
10 8 6 4 2
Young generation Tenured generation All generations
0
Collector overhead [% − 10 sec Avg]
12
Figure 7.62: Collector overhead with different maximum heap sizes and object counts, 0 random accesses and objects with short lifetimes on Intel Server.
200
400
600
800
1000
Maximum heap size [MB] and total number of components [1/4 K]
Figure 7.63: Collector overhead with different maximum heap sizes and object counts, 64 random accesses and objects with short lifetimes on Intel Server.
c Q-ImPrESS Consortium
Dissemination Level: public
Page 179 / 210
Project Deliverable D3.3: Resource Usage Modeling
20
40
60
Last change: February 3, 2009
Young generation Tenured generation All generations
0
Collector overhead [% − 10 sec Avg]
Version: 2.0
200
400
600
800
1000
Maximum heap size [MB] and total number of components [1/4 K]
30 20 10
Young generation Tenured generation All generations
0
Collector overhead [% − 10 sec Avg]
40
Figure 7.64: Collector overhead with different maximum heap sizes and object counts, 0 random accesses and objects with long lifetimes on Intel Server.
200
400
600
800
1000
Maximum heap size [MB] and total number of components [1/4 K]
Figure 7.65: Collector overhead with different maximum heap sizes and object counts, 64 random accesses and objects with long lifetimes on Intel Server.
c Q-ImPrESS Consortium
Dissemination Level: public
Page 180 / 210
Project Deliverable D3.3: Resource Usage Modeling
Last change: February 3, 2009
50 40 10
20
30
Young generation Tenured generation All generations
0
Collector overhead [% − 10 sec Avg]
60
Version: 2.0
200
400
600
800
1000
Maximum heap size [MB] and total number of objects [K]
15 10 5
Young generation Tenured generation All generations
0
Collector overhead [% − 10 sec Avg]
Figure 7.66: Collector overhead with different maximum heap sizes and object counts, 0 random accesses and deep heap on Intel Server.
200
400
600
800
1000
Maximum heap size [MB] and total number of objects [K]
Figure 7.67: Collector overhead with different maximum heap sizes and object counts, 256 random accesses and deep heap on Intel Server.
c Q-ImPrESS Consortium
Dissemination Level: public
Page 181 / 210
Project Deliverable D3.3: Resource Usage Modeling
Last change: February 3, 2009
50 40 10
20
30
Young generation Tenured generation All generations
0
Collector overhead [% − 10 sec Avg]
60
Version: 2.0
200
400
600
800
1000
Maximum heap size [MB] and total number of objects [K]
15 5
10
Young generation Tenured generation All generations
0
Collector overhead [% − 10 sec Avg]
20
Figure 7.68: Collector overhead with different maximum heap sizes and object counts, 0 random accesses and shallow heap on Intel Server.
200
400
600
800
1000
Maximum heap size [MB] and total number of objects [K]
Figure 7.69: Collector overhead with different maximum heap sizes and object counts, 256 random accesses and shallow heap on Intel Server.
c Q-ImPrESS Consortium
Dissemination Level: public
Page 182 / 210
Project Deliverable D3.3: Resource Usage Modeling
Last change: February 3, 2009
40 30 20 10
Young generation Tenured generation All generations
0
Collector overhead [% − 10 sec Avg]
50
Version: 2.0
200
400
600
800
1000
Maximum heap size [MB] and total number of objects [K]
20 15 10 5
Young generation Tenured generation All generations
0
Collector overhead [% − 10 sec Avg]
25
Figure 7.70: Collector overhead with different maximum heap sizes and object counts, 0 random accesses on Intel Server.
200
400
600
800
1000
Maximum heap size [MB] and total number of objects [K]
Figure 7.71: Collector overhead with different maximum heap sizes and object counts, 64 random accesses on Intel Server.
c Q-ImPrESS Consortium
Dissemination Level: public
Page 183 / 210
Project Deliverable D3.3: Resource Usage Modeling
1
2
3
Last change: February 3, 2009
Young generation Tenured generation All generations
0
Collector overhead [% − 10 sec Avg]
Version: 2.0
200
400
600
800
1000
Maximum heap size [MB] and total number of objects [K]
Figure 7.72: Collector overhead with different maximum heap sizes and object counts, 1024 random accesses on Intel Server.
7.1.5 Artificial Experiments: Workload Compositions The experiments with collector overhead dependencies suggest that the character of the dependency on heap size and allocation speed is similar for different workloads, but constants describing the dependency change. Additional experiments investigate whether this behavior persists for composition of workloads from Listings 7.3 and 7.2. 7.1.5.1 Experiment: Allocation speed with composed workload
The experiment runs the workloads from Listings 7.3 and 7.2 in composition, changing the ratio of allocations performed by each of the two workloads. Purpose Determine the dependency of the collector overhead on the allocation speed in the composed workload. . Measured The overhead spent by the young and the tenured generation collector in code combined from Listings 7.3 and 7.2. Parameters TotalObjects: 64 K for both workloads; Random accesses: 0-1024; Maximum heap size: 128 MB; Workload allocation ratio: 4:1-1:4. Expected Results Experiments7.1.4.7 and 7.1.4.6 show that the collector overhead depends on the workload. The results for the composed workload can provide additional insight: • If the collector overhead does not change with different allocation ratios, it would indicate that the collector overhead depends only on the live objects and not on the garbage. This is because the number of live objects maintained by each workload stays constant during the experiment, changing the ratio of allocations performed by the two workloads influences only the garbage. • If the collector overhead does change with different allocation ratios, the collector overhead depends also on distribution of the live objects or the garbage. Measured Results to 7.75.
The results of the experiment for deep heap configuration are displayed on Figures 7.73
For shallow heap configuration, the results are displayed on Figures 7.76 to 7.78. c Q-ImPrESS Consortium
Dissemination Level: public
Page 184 / 210
Project Deliverable D3.3: Resource Usage Modeling
Last change: February 3, 2009
10
20
30
40
Young generation Tenured generation All generations
0
Collector overhead [% − 10 sec Avg]
50
Version: 2.0
1e+05
2e+05
3e+05
4e+05
Allocation speed [objects/s]
10
20
30
40
Young generation Tenured generation All generations
0
Collector overhead [% − 10 sec Avg]
50
Figure 7.73: Collector overhead with allocation ratio 4:1 in favor of heap size workload and deep configuration on Intel Server.
1e+05
2e+05
3e+05
4e+05
Allocation speed [objects/s]
Figure 7.74: Collector overhead with allocation ratio 1:1 and deep configuration on Intel Server.
c Q-ImPrESS Consortium
Dissemination Level: public
Page 185 / 210
Project Deliverable D3.3: Resource Usage Modeling
Last change: February 3, 2009
10
20
30
40
Young generation Tenured generation All generations
0
Collector overhead [% − 10 sec Avg]
50
Version: 2.0
1e+05
2e+05
3e+05
4e+05
Allocation speed [objects/s]
10
20
30
40
Young generation Tenured generation All generations
0
Collector overhead [% − 10 sec Avg]
50
Figure 7.75: Collector overhead with allocation ratio 1:4 in favor of heap depth workload and deep configuration on Intel Server.
1e+05
2e+05
3e+05
4e+05
Allocation speed [objects/s]
Figure 7.76: Collector overhead with allocation ratio 4:1 in favor of heap size workload and shallow configuration on Intel Server.
c Q-ImPrESS Consortium
Dissemination Level: public
Page 186 / 210
Project Deliverable D3.3: Resource Usage Modeling
Last change: February 3, 2009
10
20
30
40
Young generation Tenured generation All generations
0
Collector overhead [% − 10 sec Avg]
50
Version: 2.0
1e+05
2e+05
3e+05
4e+05
Allocation speed [objects/s]
10
20
30
40
Young generation Tenured generation All generations
0
Collector overhead [% − 10 sec Avg]
50
Figure 7.77: Collector overhead with allocation ratio 1:1 and shallow configuration on Intel Server.
1e+05
2e+05
3e+05
4e+05
Allocation speed [objects/s]
Figure 7.78: Collector overhead with allocation ratio 1:4 in favor of heap depth workload and shallow configuration on Intel Server.
c Q-ImPrESS Consortium
Dissemination Level: public
Page 187 / 210
Project Deliverable D3.3: Resource Usage Modeling
Young generation Tenured generation All generations
10
20
30
40
50
Last change: February 3, 2009
0
Collector overhead [% − 10 sec Avg]
60
Version: 2.0
50000
100000
150000
200000
250000
300000
350000
Allocation speed [objects/s]
Figure 7.79: Collector overhead with 16 K objects heap depth workload and 112 K from other workload and deep configuration on Intel Server.
The results are almost independent of the allocation ratio, suggesting that the collector overhead does not depend on the garbage as produced by the two workloads. The dependency on the allocation speed is very close to linear. For the deep heap configuration, the linear coefficients are ranging from 0.0001171 to 0.0001179. For the shallow heap configuration, the range is from 0.0001205 to 0.0001213. 7.1.5.2 Experiment: Heap size with composed workload
The experiment runs the workloads from Listings 7.3 and 7.2 in composition, changing the number of live objects maintained by each workload while keeping the total number of live objects constant. Purpose Determine the dependency of the collector overhead on the ratio of live objects maintained by individual workloads. Measured The overhead spent by the young and the tenured generation collector in code combined from Listings 7.3 and 7.2. Parameters TotalObjects: 16-112 K for first workload, 112-16 K for second workload; Random accesses: 01024; Maximum heap size: 128 MB; Workload allocation ratio: 1:1. Expected Results Experiments7.1.4.7 and 7.1.4.6 show that the collector overhead depends on the workload. Experiment 7.1.5.1 suggests that the collector overhead does not depend on the garbage. Assuming that the collector overhead is associated with traversing the live objects, the overhead of traversing the objects in the combined workload should consist of the overheads of traversing the objects in the individual workloads. The expectation therefore is that the overhead will be highest with most live objects maintained by workload from Listing 7.3 and lowest with most live objects maintained by workload from Listing 7.2. Measured Results to 7.81.
The results of the experiments for deep heap configuration are displayed on Figures 7.79
For shallow heap configuration, the results are displayed on Figures 7.82 to 7.84. All results, inluding those not displayed here for sake of brevity, exhibit a linear dependency of the collector overhead on the allocation speed. The dependency of the linear coefficient on the ratio of live objects c Q-ImPrESS Consortium
Dissemination Level: public
Page 188 / 210
Project Deliverable D3.3: Resource Usage Modeling
Last change: February 3, 2009
10
20
30
40
Young generation Tenured generation All generations
0
Collector overhead [% − 10 sec Avg]
50
Version: 2.0
1e+05
2e+05
3e+05
4e+05
Allocation speed [objects/s]
10
20
30
40
Young generation Tenured generation All generations
0
Collector overhead [% − 10 sec Avg]
50
Figure 7.80: Collector overhead with 64 K objects from both workloads and deep configuration on Intel Server.
1e+05
2e+05
3e+05
4e+05
5e+05
6e+05
Allocation speed [objects/s]
Figure 7.81: Collector overhead with 112 K objects heap depth workload and 16 K from other workload and deep configuration on Intel Server.
c Q-ImPrESS Consortium
Dissemination Level: public
Page 189 / 210
Project Deliverable D3.3: Resource Usage Modeling
Young generation Tenured generation All generations
10
20
30
40
50
Last change: February 3, 2009
0
Collector overhead [% − 10 sec Avg]
60
Version: 2.0
50000
100000
150000
200000
250000
300000
350000
Allocation speed [objects/s]
10
20
30
40
Young generation Tenured generation All generations
0
Collector overhead [% − 10 sec Avg]
50
Figure 7.82: Collector overhead with 16 K objects heap depth workload and 112 K from other workload and shallow configuration on Intel Server.
1e+05
2e+05
3e+05
4e+05
Allocation speed [objects/s]
Figure 7.83: Collector overhead with 64 K objects from both workloads and shallow configuration on Intel Server.
c Q-ImPrESS Consortium
Dissemination Level: public
Page 190 / 210
Project Deliverable D3.3: Resource Usage Modeling
Last change: February 3, 2009
10
20
30
40
Young generation Tenured generation All generations
0
Collector overhead [% − 10 sec Avg]
50
Version: 2.0
1e+05
2e+05
3e+05
4e+05
5e+05
6e+05
Allocation speed [objects/s]
0.00012 0.00010 0.00008
Linear coefficients
0.00014
Figure 7.84: Collector overhead with 112 K objects heap depth workload and 16 K from other workload and shallow configuration on Intel Server.
2e+04
4e+04
6e+04
8e+04
1e+05
Heap depth workload objects
Figure 7.85: Linear coefficients as dependency of object count from workload with heap depth and deep configuration on Intel Server.
c Q-ImPrESS Consortium
Dissemination Level: public
Page 191 / 210
Project Deliverable D3.3: Resource Usage Modeling
Last change: February 3, 2009
0.00012 0.00010 0.00008
Linear coefficients
0.00014
Version: 2.0
2e+04
4e+04
6e+04
8e+04
1e+05
Heap depth workload objects
Figure 7.86: Linear coefficients as dependency of object count from workload with heap depth and shallow configuration on Intel Server.
maintained by the individual workloads is displayed on Figure 7.85 for deep heap configuration and on Figure 7.86 for shallow heap configuration. The dependency of the linear coefficient on the ratio of live objects maintained by the individual workloads is almost linear again. The results also correspond with the expectations in that presence of live objects from Listing 7.3 is associated with smaller overhead than presence of live objects from Listing 7.2.
c Q-ImPrESS Consortium
Dissemination Level: public
Page 192 / 210
Project Deliverable D3.3: Resource Usage Modeling
Version: 2.0
Last change: February 3, 2009
Chapter 8
Predicting the Impact of Processor Sharing on Performance In real-time systems, it is essential to be able to measure where the processor is spending its cycles on a function-by-function or task-by-task basis, in order to evaluate the impact of processor sharing on system’s (timing) performance. Hence, the shared processor’s utilization determines the load to the (legacy) real-time system. In this chapter, we investigate the response time of a processor sharing model. Analysis of such model is motivated by capacity planning and performance optimization of multi-threaded systems. A typical illustration of a system that adopts a multi-threaded real-time system architecture is given below, in Example 8.2. Typical examples of quality of service (QoS) of such systems are, e.g, that the mean response time must be less than 4 seconds, and at least 90 % of requests must be responded within 10 seconds. Therefore, accurate evaluation of response times is a key to choose appropriate number of threads and meet the performance requirements. Earlier research at MRTC has produced a discrete event simulation framework for prediction of response times and other measurable dynamic systems properties, such as queue lengths. The original purpose of this simulator was impact analysis with respect to such runtime properties for existing complex embedded systems. This simulator is however more general than its original purpose. The simulated model, which is specified in C, describes the threads executing on a single processor. The central part of the simulation framework is an API that provide typical operating system services to the threads, such as inter-process communication, synchronization and thread management, using an explicit notion of processor time. This means that the simulated threads are responsible for advancing the simulation clock (an integer counter) by calling a specific API function, execute, which corresponds to consumption of processor time. The amount of processor time to consume is specified as a probability distribution, which is derived from measurements of the modeled system, when available. The simulator records a trace of the simulation, which is displayed by the Tracealyzer tool [24]. Apart from the visualizations possible in the Tracealyzer (scheduling trace, processor load graph, communication graph), the Tracealyzer can also export data to text format to allow for analysis in other tools.
8.1 Simulation Example A trivial model contain only two C functions, model init and a thread function, containing only a single execute statement, as presented in Example 8.1. This will produce a model containing two threads (or tasks, as often referred in the RT community). One application-thread named task1, which executes periodically every 40000 time-units with a constant execution time of 10000 time-units and one idle-thread, which always is implicitly created. Since the simulator uses fixed-priority scheduling (very common for embedded systems), the idle-thread is only executed when task1 is dormant. Listing 8.1: Example of trivial model 1 2 3 4
void threadfunc() { while (1) { execute(10000); c Q-ImPrESS Consortium
Dissemination Level: public
Page 193 / 210
Project Deliverable D3.3: Resource Usage Modeling
Version: 2.0
sleep(30000);
5
}
6 7
Last change: February 3, 2009
}
8 9 10 11 12
void model_init() { createTask("TASK1", 1, 0, 0, 0, 0, threadfunc); } A constant execution time is however not very realistic, in practice there are variations due to input data and hardware effects. This can be modeled in two ways, either by specifying the execution time as a uniform probability distribution, or by specifying a data-file containing an empirical distribution, i.e., measurement from which values are sampled. For typical service oriented systems, heavy-tailed distributions such as Pareto or Log-Normal would be appropriate service time approximations. The relevant example requires several threads/tasks. In Example 8.2, we have specified a client-server case containing one server thread, two other threads of higher priority and a client, which runs on a different processor. The client session thread stimulates the server without consuming processor time, i.e. using the execute statement. This thread thereby becomes invisible in this simulation. The createTask function require several parameters which needs explanation. The first parameter is the name of the thread/task, for display in the Tracealyzer. The second parameter is the scheduling priority, where lower is more significant. The third is periodicity. If -1 is specified, the thread function (which is the last parameter) is only called once, on simulation start. The fourth parameter is release time offset and the fifth parameter is release jitter, i.e. a random variation in release time. The sixth and last parameter is the thread function. A simulation of this model is very fast due to the high level of abstraction and the C implementation. In this experiment, 100.000.000 time units is simulated in 62 ms on a HP 6220 laptop, 2 GHz, 2 GB RAM. This corresponds to about 110.000 simulator events (i.e. context switches, messages, etc). The simulation result can be inspected in the Tracealyzer, as depicted in Figure 8.1. The processor usage graph presents the processor usage over the whole recording, which gives a complete overview. The processor usage is presented in an accumulated manner, so for each time interval both the processor usage of the individual tasks and the total processor usage is illustrated. It is possible to view only specific selected tasks, and study their processor usage in isolation. The Tracealyzer can generate a report with the summary of the processor usage and timing properties, such as maximum or average execution time, of all or selected tasks. The report can then serve for evaluating the impact of the degree of processor sharing on system performance (real-time response times of tasks). For our client-server example (Example 8.2), the report is presented in Section 8.3. In addition, the Tracealyzer can export response time data and other properties to text format. It is thereby possible to generate diagrams on properties like response times, as illustrated by Figure 8.2, Figure 8.3 and Figure 8.4. The histograms are generated using XLSTAT, a plugin for Microsoft Excel.
8.2 Simulation Optimization Traditional probabilistic simulation is good for estimating the average case behavior, but however not suitable for finding extreme values of a task’s response time. Due to the often vast state space of the models concerned, this random exploration is unlikely to encounter a task response-time close to the worst case. We have therefore proposed a new approach [34] for best-effort response time analysis targeting extreme values in timing properties. The proposed approach uses metaheuristic search algorithm, named MABERA, on top of traditional probabilistic simulation, in order to focus the simulations on parts of the state-space that are considered more interesting, according to a heuristic selection method. Meta-heuristics are general high level strategies for iterative approximation of optimization problems. The search technique used by MABERA is related to two commonly used techniques, genetic algorithms and evolution strategies. We do not claim that MABERA is optimal, many improvements are possible. The ambition with MABERA is to demonstrate the potential of extending probabilistic simulation with a meta-heuristic search technique for the purpose of best-effort response-time analysis. c Q-ImPrESS Consortium
Dissemination Level: public
Page 194 / 210
Project Deliverable D3.3: Resource Usage Modeling
Version: 2.0
Last change: February 3, 2009
Listing 8.2: Example, client-server case 1 2
MBOX ServerQ; MBOX ClientQ;
3 4 5 6 7 8 9 10 11 12 13 14 15 16 17 18 19 20
void server() { while (1) { int request = recvMessage(ServerQ, FOREVER); switch(request) { case START: execute(uniform(1000, 1200)); break; case STOP: execute(uniform(400, 500)); break; case GETDATA: execute(uniform(9900, 12300)); break; } } }
21 22 23 24 25
void sensorPoll() { execute(uniform(200, 600)); }
26 27 28 29
void client_session() { int i;
30
sendMessage(ServerQ, START, 0); delay(uniform(20000, 30000)); for (i = 0; i < uniform(3, 5); i++) { sendMessage(ServerQ, GETDATA, 0); delay(uniform(20000, 30000)); } delay(uniform(20000, 30000)); sendMessage(ServerQ, STOP, 0);
31 32 33 34 35 36 37 38 39
}
40 41 42 43 44
void model_init() { ServerQ = createMBOX("ServerQ", 10); ClientQ = createMBOX("ClientQ", 10);
45
createTask("Server", 10, -1, 0, 0, server); createTask("Client", 0, 100000, 0, 50000, client_session);
46 47 48
createTask("sensor1", 1, 4000, 10000, 0, sensorPoll); createTask("sensor2", 1, 4000, 0, 0, sensorPoll);
49 50 51
} c Q-ImPrESS Consortium
Dissemination Level: public
Page 195 / 210
Project Deliverable D3.3: Resource Usage Modeling
Version: 2.0
Last change: February 3, 2009
Figure 8.1: Simulation trace in the Tracealyzer tool.
We have compared this approach with traditional probabilistic simulation, with respect to the discovered response times. The comparison was based on 200 replications of each simulation method on a fairly complex model, containing 4 application tasks and 2 environment tasks which emulate a remote system. The results from the MABERA analysis is presented in Figure 8.5, as a histogram of relative frequency of response times, grouped in steps of 50 ms. The highest response time discovered by MABERA was 8349 and the mean value was 8045. The highest peak corresponds to values of 8324. Note that 47 % of the replications gave this result, so this result would most likely be detected in only 2 or 3 replications, which only takes about 20 minutes on the relatively slow computer we used. The corresponding result from traditional simulation is presented in Figure 8.6. The highest response time discovered by probabilistic simulation was 7929 and the mean value was 7593. Moreover, the results from probabilistic simulation follows a bell-shaped curve, where most results are found close to the mean value and only 0.5 % of the results are above 7800, while 47 % of the MABERA results are close to the highest discovered value, 8349. These results indicate that the proposed MABERA approach is significantly more efficient in finding extreme response times for a particular task than traditional probabilistic simulation.
8.3 Generated Statistics Report for Performance Analysis The parameters that can influence the system’s performance, when multiple tasks share the same processor, include: Priority
The OS scheduling priority of the task, lower value is ”better”.
c Q-ImPrESS Consortium
Dissemination Level: public
Page 196 / 210
Project Deliverable D3.3: Resource Usage Modeling
Version: 2.0
Last change: February 3, 2009
0,35
Relative frequency
0,3 0,25 0,2 0,15 0,1 0,05 0 0
500
1000
1500
2000
Response Time
Figure 8.2: Response time histogram, Server START.
0,3
Relative frequency
0,25 0,2 0,15 0,1 0,05 0 0
5000
10000
15000
20000
Response time
Figure 8.3: Response time histogram, Server GETDATA.
c Q-ImPrESS Consortium
Dissemination Level: public
Page 197 / 210
Project Deliverable D3.3: Resource Usage Modeling
Version: 2.0
Last change: February 3, 2009
0,4 0,35
Relative frequency
0,3 0,25 0,2 0,15 0,1 0,05 0 0
200
400
600
800
1000
1200
Response Time
Figure 8.4: Response time histogram, Server STOP.
0,5 0,45 0,4
Relative frequency
0,35 0,3 0,25 0,2 0,15 0,1 0,05 0 7000
7200
7400
7600
7800
8000
8200
8400
Response time
Figure 8.5: Results – MABERA.
c Q-ImPrESS Consortium
Dissemination Level: public
Page 198 / 210
Project Deliverable D3.3: Resource Usage Modeling
Version: 2.0
Last change: February 3, 2009
0,4
0,35
Relative frequency
0,3
0,25
0,2
0,15
0,1
0,05
0 7000
7200
7400
7600
7800
8000
8200
8400
Response time
Figure 8.6: Results – probabilistic simulation.
Processor usage Count
The amount of processor time used by the task (in percent).
The number of instances (jobs/executions) of the task.
Fragments The number of fragments of each task instance (uninterrupted execution segments), not counting interrupts. Interrupts, density ond).
The number of interrupt requests in relation to the execution time of the task (requests/sec-
Interrupts, average
The average number of interrupt requests per task instance
Interrupts, max
The maximum number of interrupt requests during a single task instance.
Figure 8.7 shows the generated statistics report for Example 8.2. Note that by execution time we mean the actual CPU time used for each task instance (in microseconds), and by response time we mean the real time between start and completion of each task instance (in microseconds). Also, in this report we omit the average values for execution and response times, as well as the number of fragments. Based on the results in the above table, we can conclude that if the client sends GETDATA messages to buffer ServerQ with a higher frequency, the processor usage of the task server increases, entailing an increase of the task’s worst-case execution time.
c Q-ImPrESS Consortium
Dissemination Level: public
Page 199 / 210
Project Deliverable D3.3: Resource Usage Modeling
Version: 2.0
Task
Priority
SERVER
Last change: February 3, 2009
Count
10
CPU usage 43,152
1
Exec. Time (Max) 12300
Resp.Time (Max) 14000
Interrupts (Max) 2000
SENSOR 1
1
7,500
12500
600
600
0
SENSOR 2 IDLE
1 255
7,500 41,848
12500 1
600 0
600 0
0 0
Task
Priority
CPU usage
Count Exec. Time (Max)
Resp. Time (Max)
Interrupts
CLIENT
0
100
210014
0
2000
210014
Figure 8.7: Task statistics.
c Q-ImPrESS Consortium
Dissemination Level: public
Page 200 / 210
Project Deliverable D3.3: Resource Usage Modeling
Version: 2.0
Last change: February 3, 2009
Chapter 9
Conclusion The purpose of this document is to quantify the impact of resource sharing on quality attributes, thus documenting the choice of resources to model in task T3.3 of the Q-ImPrESS project. Here, we summarize the impact of resource sharing on quality attributes in a table that lists, for each resource, what is the size and frequency of the observed effects, and therefore what is the scale at which resource sharing impacts the quality attributes.
Register Content Register content change Visibility:
any composition
The overhead of register content change is unlikely to be influenced by component composition, and therefore also unlikely to be visible as an effect of component composition.
Branch Predictor Virtual function address prediction miss Duration: Frequency: Slowdown: Visibility:
pipelined composition
112 cycles Intel Server, 75 cycles AMD Server 1 per function invocation 39 % Intel Server, 27 % AMD Server The overhead can be visible in workloads with virtual functions of size comparable to the address prediction miss, however, it is unlikely to be visible with larger virtual functions.
Address Translation Buffers Data address translation buffer miss Duration:
Frequency: Slowdown:
pipelined composition
2-21 cycles Intel Server, 5-103 cycles AMD Server 20-65 cycles with L1 cache miss Intel Server 229-901 cycles with L2 cache miss Intel Server 1 per page access 200 % with L1 cache miss Intel Server, 280 % with L1 cache miss AMD Server
c Q-ImPrESS Consortium
Dissemination Level: public
Page 201 / 210
Project Deliverable D3.3: Resource Usage Modeling
Version: 2.0
Last change: February 3, 2009
Visibility:
The overhead can be visible in workloads with very poor locality of data references to virtual pages that fit in the address translation buffer when executed alone. Depending on the range of accessed addresses, the workload can also cause additional cache misses when traversing the address translation structures. The translation buffer miss can be repeated only as many times as there are the address translation buffer entries, the overhead will therefore only be significant in workloads where the number of data accesses per invocation is comparable to the size of the buffer. Instruction address translation buffer miss pipelined composition Duration: Frequency: Slowdown: Visibility:
19 cycles Intel Server, 4-40 cycles AMD Server 1 per page access 367 % Intel Server, 320 % AMD Server The overhead can be visible in workloads with very poor locality of instruction references to virtual pages that fit in the address translation buffer when executed alone. The translation buffer miss can be repeated only as many times as there are the address translation buffer entries, the overhead will therefore only be significant in workloads where the number of instruction accesses per invocation is comparable to the size of the buffer. Invalidating address translation buffer parallel composition Slowdown: Visibility:
75 % Intel Server, 160 % AMD Server The overhead can be visible in workloads with very poor locality of data references to virtual pages that fit in the address translation buffer, when combined with workloads that frequently modify its address space.
Memory Content Caches L1 data cache miss
pipelined composition
Duration:
11 cycles Intel Server 12 cycles random sets, 27-40 cycles single set AMD Server Frequency: 1 per line access Slowdown: 150 % clean, 160 % dirty Intel Server 400 % AMD Server Visibility: The overhead can be visible in workloads with very good locality of data references that fit in the L1 data cache when executed alone. The cache miss can be repeated only as many times as there are the L1 data cache entries, the overhead will therefore only be significant in workloads where the number of data accesses per invocation is comparable to the size of the L1 data cache. L2 cache miss pipelined composition Duration: Frequency: Slowdown:
256-286 cycles Intel Server 32-35 cycles random set, 16-63 cycles single set AMD Server 1 per line access without prefetching 209 % clean, 223 % dirty Intel Server 81 % AMD Server
c Q-ImPrESS Consortium
Dissemination Level: public
Page 202 / 210
Project Deliverable D3.3: Resource Usage Modeling
Version: 2.0
Last change: February 3, 2009
Visibility:
The overhead can be visible in workloads with very good locality of data references that fit in the L2 cache when executed alone. The cache miss can be repeated only as many times as there are the L2 cache entries (or pairs of entries on platform with adjacent line prefetch), the overhead will therefore only be significant in workloads where the number of data accesses per invocation is comparable to the size of the L2 cache. L3 cache miss pipelined composition Duration: Frequency: Slowdown: Visibility:
208 cycles random set, 159-211 cycles single set AMD Server 1 per line access 303 % clean, 307 % dirty AMD Server The overhead can be visible in workloads with very good locality of data references that fit in the L3 cache when executed alone. The cache miss can be repeated only as many times as there are the L3 cache entries, the overhead will therefore only be significant in workloads where the number of data accesses per invocation is comparable to the size of the L3 cache. L1 instruction cache miss pipelined composition Duration:
30 cycles Intel Server 20 cycles random sets, 25 cycles single set AMD Server Frequency: 1 per line access Slowdown: 460 % Intel Server, 130 % AMD Server Visibility: The overhead can be visible in workloads that perform many jumps and branches and that fit in the L1 instruction cache when executed alone. The cache miss can be repeated only as many times as there are the L1 instruction cache entries, the overhead will therefore only be significant in workloads where the number of executed branch instructions per invocation is comparable to the size of the L1 instruction cache. Real workload data cache sharing (FFT) pipelined composition Slowdown:
400 % read, 500 % write Intel Server 300 % read, 350 % write AMD Server Visibility: The overhead is visible in FFT as a real workload representative. The overhead depends on the size of the buffer submitted to FFT. In some cases, the interfering workload can flush modified data, yielding apparently negative overhead of the measured workload. Blind shared variable access overhead parallel composition Duration:
72 cycles with shared cache Intel Server 90 cycles with shared package Intel Server 32 cycles otherwise Intel Server Frequency: 1 per access Slowdown: 490 % Intel Server Visibility: The overhead can be visible in workloads with frequent blind access to a shared variable. Reaching shared cache bandwidth limit parallel composition Slowdown: Visibility:
13 % with hits, 19 % with misses Intel Server The limit can be visible in workloads with high cache bandwidth requirements and workloads where cache access latency is not masked by concurrent processing. Sharing cache bandwidth parallel composition
c Q-ImPrESS Consortium
Dissemination Level: public
Page 203 / 210
Project Deliverable D3.3: Resource Usage Modeling
Version: 2.0
Last change: February 3, 2009
Slowdown:
16 % both hit, 13 % misses with hits, 107 % hits with misses Intel Server 5 % both hit, 0 % misses with hits, 49 % hits with misses AMD Server Visibility: The impact can be visible in workloads with many pending requests to the shared cache, where cache access latency is not masked by concurrent processing. The impact is significantly larger when one of the workloads misses in the shared cache. Prefetching to the shared cache parallel composition Slowdown: Visibility:
63 % Intel Server The impact can be visible in workloads with working sets that do not fit in the shared cache, but employ hardware prefetching to prevent demand request misses. Prefetching can be disrupted by demand requests of the interfering workload, even if those requests do not miss in the shared cache. Real workload data cache sharing (FFT) parallel composition Slowdown:
10 % hitting, 70 % missing interference, small buffer 43 % hitting, 148 % missing interference, large buffer Intel Server 6 % hitting interference, large buffer, 6% missing interference, small buffer AMD Server. Visibility: The overhead is visible in FFT as a real workload representative. The overhead is smaller when FFT fits in the shared cache and the interfering workload hits, and larger when FFT does not fit in the shared cache or the interfering workload misses. Real workload data cache sharing (SPEC CPU2006) parallel composition Slowdown: Visibility:
26 % hitting, 90 % missing interference Intel Server The overhead is visible in both the integer and floating point workloads. The overhead varies greatly from benchmark to benchmark, an interfering workload that misses in the shared cache has a larger impact than an interfering workload that hits.
Memory Buses Reaching memory bus bandwidth limit Limit: Visibility:
parallel composition
>5880 MB/s Intel Server The limit can be visible in workloads with high memory bandwidth requirements and workloads where memory access latency is not masked by concurrent processing.
File Systems
Collected Heap Collector overhead when increasing object lifetime
any composition
Overhead: Visibility:
change of 32% on client, 28% on server Desktop The overhead change can be visible in components with dynamically allocated objects kept around for short durations, especially durations determined by outside invocations. Collector overhead when increasing heap depth any composition
c Q-ImPrESS Consortium
Dissemination Level: public
Page 204 / 210
Project Deliverable D3.3: Resource Usage Modeling
Version: 2.0
Last change: February 3, 2009
Overhead: Visibility:
change of 60% Desktop The overhead change can be visible in components whose dynamically allocated objects are linked to references provided by outside invocations, especially when such references connect the objects in deep graphs. Collector overhead when increasing heap size any composition Overhead: Visibility:
change of 20% Desktop The overhead change can be visible in any components with dynamically allocated objects.
As summarized in the table, the results show that resource sharing indeed impacts quality attributes – and while this statement alone is hardly surprising, the table contributes explicit limits of this impact for a wide spectrum of resources from memory content caches through file system resources to collected heap resources. The import of this statement becomes apparent when the work from task T3.3 is combined with task T3.1, which has been investigating the prediction models to be used in the context of the Q-ImPrESS project [33]. A typical assumption made when applying a prediction model is that the quality annotations used to populate the model are constant (this assumption is also visible in the simplified running example in deliverable D3.1, but is not inherent to the sophisticated quality annotations outlined also in deliverable D3.1). Unless the entire spectrum of resources whose sharing impacts the quality attributes is included in the prediction model (which is not typically done), this assumption naturally does not hold. Typically, the changes in quality attributes due to resource sharing therefore directly translate into the loss of precision within the prediction model, on a scale that can reach up to the limits listed in the summary table. Acquiring detailed knowledge on the impact of resource sharing is the first step towards modeling this impact, as planned in the Q-ImPrESS project. Other issues to be solved include: Modeling of individual resources. Modeling the impact of resource sharing requires modeling of individual resources. The availability of existing work on modeling of individual resources varies greatly from resource to resource, from some apparently rarely modeled (collected heap) to some modeled rather frequently (memory caches). Not all models of individual resources are directly applicable in the Q-ImPrESS project though, often because their output is expressed in units that are not easily convertible into quality attributes (for example cache miss count rather than cache miss penalty). Description of resource utilization. The complex working of some resources requires a detailed description of the resource utilization by the modeled workload (for example stack distance profile of memory accesses). This description might not be readily available in the prediction scenarios envisioned by the Q-ImPrESS project, since most of these scenarios take place during design stages of the software development process. Integration into the prediction model. Integrating the models of individual resources directly into the prediction model is, in most cases, unlikely to work well, either due to incompatibility of modeling paradigms or due to potential for state explosion. An iterative solution of the models, or an integration into the simulation technologies available to the project partners, is envisioned as a feasible solution. The listed issues were anticipated in the Q-ImPrESS project proposal. The project plan provides the necessary capacity for addressing the issues in both WP3 and WP4, the two workpackages that deal with prediction model specification, prediction model generation and model based quality prediction.
c Q-ImPrESS Consortium
Dissemination Level: public
Page 205 / 210
Project Deliverable D3.3: Resource Usage Modeling
Version: 2.0
Last change: February 3, 2009
Terminology A glossary of frequently used terms follows. It should be noted that the definitions of the terms are used for consistency throughout this document, but they can differ slightly from the definitions used elsewhere.
Processor Execution Core Pipeline
Queue of partially processed machine instructions.
Speculative Execution Program execution where some preconditions have been guessed and the execution effects might need to be discarded should the guesses turn out to be wrong. Superscalar Execution Program execution where multiple operations can be processed at the same time by different processing units.
System Memory Architecture Associativity Determines in which cache lines the data can be placed. The extremes are direct mapped (one place) and fully associative (all places) caches. A common compromise are the N-way set-associative caches. Coherency When multiple caches of the main memory are used, the caches are said to be coherent if their content is synchronized to eliminate outdated copies of the main memory. Critical Word First (CWF) Because transfers between memory caches and main memory need multiple memory bus cycles to fetch a cache line, the data further in the line could take longer to become available, and a cache miss penalty would therefore depend on the offset of the accessed data in the line. To mitigate this, a processor may employ the Critical Word First protocol, which transfers the accessed data first and the rest of the cache line afterwards [8, page 16]. Index A number assigned to a cache line set. When searching for data in the cache, the address of the data is used to obtain the index of cache line set that is searched. Least Recently Used (LRU) entry.
A cache replacement policy that always evicts the least recently accessed cache
Page Walk The process of traversing the hierarchical paging structures to translate a virtual address to a physical address after an address translation buffer miss. Pseudo Least Recently Used (PLRU) A cache replacement policy that mostly evicts the least recently accessed cache entry, an approximation of LRU. Replacement Policy Determines the cache line to store the data that is being brought the cache, possibly evicting the previously stored data. In a limited associativity cache, the policy is split into choosing a set in the cache and then choosing a way in the set. Set
In a limited associativity cache, each set contains a fixed number of cache lines. Given a pair of data and address, the data can be cached only in a single set selected directly by the address.
Translation Lookaside Buffer (TLB) Way
A cache of translations from virtual addresses to physical addresses.
In a limited associativity cache, cache entries of a set are called ways.
c Q-ImPrESS Consortium
Dissemination Level: public
Page 206 / 210
Project Deliverable D3.3: Resource Usage Modeling
Version: 2.0
Last change: February 3, 2009
Virtual Machine Compacting Collector fragmentation.
A garbage collector that moves live objects closer together within a heap area to avoid
Copying Collector A garbage collector that evacuates live objects from one heap area to another to avoid fragmentation. Garbage An object that occupies space on the heap but can not be used by the application, typically because it is not reachable from any root object. Generation
A group of objects with similar lifetime.
Generational Collector A garbage collector that introduces optimizations based on statistical properties of generations. Frequently applied optimization is separate collection of individual generations. Live Object An object that occupies space on the heap and can be used by the application, typically because it is reachable from some root object. Mark And Sweep Collector A garbage collector that uses the marking pass to mark live objects and the sweeping pass to free garbage. Mutator Root
A process that modifies the heap, potentially interfering with the progress of the garbage collector.
An object that can be directly accessed by an application. A global variable or an allocated local variable is considered a root for the purpose of garbage collection.
c Q-ImPrESS Consortium
Dissemination Level: public
Page 207 / 210
Project Deliverable D3.3: Resource Usage Modeling
Version: 2.0
Last change: February 3, 2009
References [1] Intel 64 and IA-32 Architectures Optimization Reference Manual, Order Number 248966-016, Intel Corporation, Nov 2007 [2] Intel 64 and IA-32 Architectures Software Developer’s Manual, Volume 1: Basic Architecture, Order Number 253665-027, Intel Corporation, Apr 2008 [3] Intel 64 and IA-32 Architectures Software Developer’s Manual, Volume 2A: Instruction Set Reference, A-M, Order Number 253666-027, Intel Corporation, Apr 2008 [4] Intel 64 and IA-32 Architectures Software Developer’s Manual, Volume 2B: Instruction Set Reference, N-Z, Order Number 253667-027, Intel Corporation, Apr 2008 [5] Intel 64 and IA-32 Architectures Software Developer’s Manual, Volume 3A: System Programming, Part 1, Order Number 253668-027, Intel Corporation, Jul 2008 [6] Intel 64 and IA-32 Architectures Software Developer’s Manual, Volume 3B: System Programming, Part 2, Order Number 253669-027, Intel Corporation, Jul 2008 [7] Intel 64 and IA-32 Architectures Application Note: TLBs, Paging-Structure Caches, and Their Invalidation, Order Number 317080-002, Intel Corporation, Apr 2008 [8] Intel 5000P/5000V/5000Z Chipset Memory Controller Hub (MCH): Datasheet, Document Number 313071003, Intel Corporation, Sep 2006. [9] Doweck, J.: Inside Intel Core Microarchitecture, Intel Corporation, 2006. [10] AMD64 Architecture Programmer’s Manual Volume 2: System Programming, Publication Number 24593, Revision 3.14, Advanced Micro Devices, Inc., Sep 2007. [11] AMD CPUID Specification, Publication Number 25481, Revision 2.28, Advanced Micro Devices, Inc., Apr 2008. [12] AMD BIOS and Kernel Developer’s Guide For AMD Family 10h Processors, Publication Number 31116, Revision 3.06, Advanced Micro Devices, Inc., Mar 2008. [13] AMD Software Optimization Guide for AMD Family 10h Processors, Publication Number 40546, Revision 3.06, Advanced Micro Devices, Inc., Apr 2008. [14] AMD Family 10h AMD Phenom Processor Product Data Sheet, Publication Number 44109, Revision 3.00, Advanced Micro Devices, Inc., Nov 2007. [15] Kessler, R. E., Hill, M. D.: Page placement algorithms for large real-indexed cache, ACM Transactions on Computer Systems, Vol. 10, No. 4, 1992. [16] Drepper, U.: What every programmer should http://people.redhat.com/drepper/cpumemory.pdf, 2007.
know
about
memory,
[17] Memory Management in the Java HotSpot Virtual Machine, Sun Microsystems, Apr 2006. [18] Detlefs, D., Printezis, T.: A Generational Mostly-Concurrent Garbage Collector, Report Number SMLI TR-2000-88, Sun Microsystems, Jun 2000. c Q-ImPrESS Consortium
Dissemination Level: public
Page 208 / 210
Project Deliverable D3.3: Resource Usage Modeling
Version: 2.0
Last change: February 3, 2009
[19] Java SE 5 HotSpot Virtual Machine Garbage Collection Tuning, Sun Microsystems. [20] Java SE 6 HotSpot Virtual Machine Garbage Collection Tuning, Sun Microsystems. [21] Printezis, T.: Garbage Collection in the Java HotSpot Virtual Machine, Sun Microsystems, 2005. [22] http://sourceforge.net/projects/x86info [23] http://ezix.org/project/wiki/HardwareLiSter [24] http://www.tracealyzer.se [25] http://icl.cs.utk.edu/papi [26] http://user.it.uu.se/ mikpe/linux/perfctr [27] http://www.fftw.org [28] http://www.kernel.org [29] http://www.spec.org/jvm2008/ [30] http://www.spec.org/cpu2006/ [31] Becker, S., Desic, S., Doppelhamer, J., Huljenic, D., Koziolek, H., Kruse, E., Masetti, M., Safonov, W., Skuliber, I., Stammel, J., Trifu, M., Tysiak, J., Weiss, R.: Requirements Document, Q-ImPrESS Deliverable 1.1, Jun 2008. [32] Becker, S., Bulej, L., Bures, T., Hnetynka, P., Kapova, L., Kofron, J., Koziolek, H., Kraft, J., Mirandola, R., Stammel, J., Tamburrelli, G., Trifu, M.: Service Architecture Meta Model, Q-ImPrESS Deliverable 2.1, Sep 2008. [33] Ardagna, D., Becker, S., Causevic, A., Ghezzi, C., Grassi, V., Kapova, L., Krogmann, K., Mirandola, R., Seceleanu, C., Stammel, J., Tuma, P.: Prediction Model Specification, Q-ImPrESS Deliverable 3.1, Nov 2008. [34] Kraft, J., Lu, Y., Norstr¨om, C., Wall, A.: A metaheuristic approach for best effort timing analysis targeting complex legacy real-time systems, Proceedings of RTAS 2008. [35] Burguiere, C., Rochange, C.: A Contribution to Branch Prediction Modeling in WCET Analysis, Proceedings of DATE 2005. [36] Fagin, B., Mital, A.: The Performance of Counter- and Correlation-Based Schemes for Branch Target Buffers, IEEE Transactions on Computers, Vol. 44, No. 12, 1995. [37] Mitra, T., Roychoudhury, A.: A Framework to Model Branch Prediction for Worst Case Execution Time Analysis, Proceedings of WCET 2002. [38] Pino, J. L., Singh, B.: Performance Evaluation of One and Two-Level Dynamic Branch Prediction Schemes over Comparable Hardware Costs, University of California at Berkeley Technical Report ERL-94-045, 1994. [39] Chen, J. B., Borg, A., Jouppi, N. P.: A Simulation Based Study of TLB Performance, Proceedings of ISCA 1992. [40] Saavedra, R. H., Smith, A. J.: Measuring Cache and TLB Performance and Their Effects on Benchmark Runtimes, IEEE Transactions on Computers, Vol. 44, No. 10, 1995. [41] Tickoo, O., Kannan, H., Chadha, V., Illikkal, R., Iyer, R., Newell, D.: qTLB: Looking Inside the Look-Aside Buffer, Proceedings of HiPC 2007. c Q-ImPrESS Consortium
Dissemination Level: public
Page 209 / 210
Project Deliverable D3.3: Resource Usage Modeling
Version: 2.0
Last change: February 3, 2009
[42] Shriver, E., Merchant, A., Wilkes, J.: An Analytic Behavior Model for Disk Drives with Readahead Caches and Request Reordering, Proceedings of SIGMETRICS 1998. [43] Blackburn, S. M., Cheng, P., McKinley, K. S.: Myths and Realities: The Performance Impact of Garbage Collection, Proceedings of SIGMETRICS 2004.
c Q-ImPrESS Consortium
Dissemination Level: public
Page 210 / 210


![inCASA Deliverable Template - Cordis [PDF]](https://m.moam.info/img/260x300/incasa-deliverable-template-cordis-pdf_64a55726098a9ead078b4572.jpg)