Fister et al. Plant Methods (2016) 12:19 DOI 10.1186/s13007-016-0119-5
Plant Methods Open Access
METHODOLOGY
Protocol: transient expression system for functional genomics in the tropical tree Theobroma cacao L. Andrew S. Fister1, Zi Shi2, Yufan Zhang3, Emily E. Helliwell4, Siela N. Maximova1,5 and Mark J. Guiltinan1,5*
Abstract Background: Theobroma cacao L., the source of cocoa, is a crop of significant economic value around the world. To facilitate the study of gene function in cacao we have developed a rapid Agrobacterium-mediated transient genetic transformation protocol. Here we present a detailed methodology for our transformation assay, as well as an assay for inoculation of cacao leaves with pathogens. Results: Agrobacterium tumefaciens cultures are induced then vacuum-infiltrated into cacao leaves. Transformation success can be gauged 48 h after infiltration by observation of green fluorescent protein and by qRT-PCR. We clarify the characteristics of cacao leaf stages and demonstrate that our strategy efficiently transforms leaves of developmental stage C. The transformation protocol has high efficacy in stage C leaves of four of eight tested genotypes. We also present the functional analysis of cacao chitinase overexpression using the transient transformation system, which resulted in decreased pathogen biomass and lesion size after infection with Phytophthora tropicalis. Conclusions: Leaves expressing transgenes of interest can be used in subsequent functional genetic assays such as pathogen bioassay, metabolic analysis, gene expression analysis etc. This transformation protocol can be carried out in 1 day, and the transgenes expressing leaf tissue can be maintained in petri dishes for 5–7 days, allowing sufficient time for performance of additional downstream gene functional analysis. Application of these methods greatly increases the rapidity with which candidate genes with roles in defense can be tested. Background Theobroma cacao L., the source of cocoa, is a tree crop of great international economic importance and the center of the multi-billion-dollar chocolate industry. While the tree is native to the Amazon basin [1], approximately 70 % of cocoa is now produced in West Africa, with the remainder coming from South America and Southeast Asia [2, 3]. Each year the crop suffers significant losses to a variety of fungal, oomycete, and viral diseases [4], resulting in significant financial loss for cacao farmers and nations exporting cocoa. Cacao research has benefited from the recent publication of the genome sequences of two genotypes [5, 6]. Availability of this *Correspondence:
[email protected] 1 The Huck Institutes of the Life Sciences, The Pennsylvania State University, 422 Life Sciences Building, University Park, PA 16802, USA Full list of author information is available at the end of the article
data increases the speed with which putatively important cacao genes can be functionally characterized, which could lead to crop improvement through application of novel breeding strategies or biotechnological approaches [7], although progress with long-generation crops is inherently slow. Accordingly, development of strategies enabling gene characterization is important to expedite the process of genetic improvement of cacao. Agrobacterium-mediated transient and stable plant transformation techniques were developed to enable the introduction of recombinant DNA into plant cells in plants [8, 9]. Whereas transient expression is largely the result of transcription and translation of non-integrated T-DNA, stable transformation by definition implies the integration of T-DNA into the host genome [10]. Transiently transfected plants typically show a peak in expression 2–4 days after infection with Agrobacterium which
© 2016 Fister et al. This article is distributed under the terms of the Creative Commons Attribution 4.0 International License (http://creativecommons.org/licenses/by/4.0/), which permits unrestricted use, distribution, and reproduction in any medium, provided you give appropriate credit to the original author(s) and the source, provide a link to the Creative Commons license, and indicate if changes were made. The Creative Commons Public Domain Dedication waiver (http://creativecommons.org/ publicdomain/zero/1.0/) applies to the data made available in this article, unless otherwise stated.
Fister et al. Plant Methods (2016) 12:19
subsequently declines [10], while stable transformation is typically achieved through selection and culturing of transformed tissue, and leads to persistent expression of transgenes [11]. If germ line cells are transformed, integration of T-DNA is heritable [12]. While stable transformation is essential for applications in crop improvement, transient transformation enables rapid testing of gene function, and is therefore an invaluable tool for plant genetics research. Both transformation strategies have been applied to a number of tree crops including cacao [13–20], and it has been applied to enhancement the of disease resistance, abiotic stress response, improvement of quality traits, and general study of functional genetics [21]. Traditional breeding strategies for tree crops are laborious and expensive. For cacao, generation of new varieties through breeding programs can take 15–20 years [3]. A strategy for generation of stable transgenic cacao trees was previously published [16], however even this process takes several years to produce a mature tree that could be used to assay experimentally the effect of a transgene’s overexpression or knockdown. The transient transformation protocol and subsequent functional analysis described here can be performed in a week, and has been used to demonstrate effect of overexpression [13, 20] and knockdown [22] of cacao genes with roles in defense, expression of non-native phosphatidylinositol 3-phosphate binding proteins in cacao [14], and the function of a transcription factor controlling embryogenesis [19]. Here we present the protocol for Agrobacterium-mediated transiently transform of detached leaf tissue of Theobroma cacao. Growth conditions described here were extensively tested to optimize transformation efficiency. The strategy enables functional gene characterization to be performed in a matter of weeks, rather than the years that would be required to generate a stably transgenic cacao tree.
Experimental design The protocol described here has been used to rapidly screen vectors to measure the effect of gene overexpression or knockdown in cacao leaf tissue [13, 14, 19, 20, 22]. Prior to transformation, binary vector constructs were transferred into competent Agrobacterium of strain AGL1 as previously described [23]. Typically the experiment is performed using two vectors: an experimental construct and a control construct (typically pGH00.0126, GenBank: KF018690). Leaves are divided into two sections, one closer to the tip and one closer to the base, such that each leaf can be transformed with both constructs. Preliminary experiments have showed that transformation success usually does not differ significantly between the two sections of a given leaf (data not shown).
Page 2 of 13
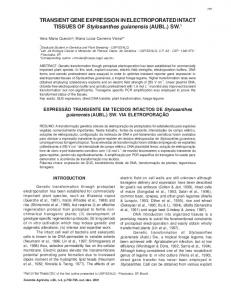
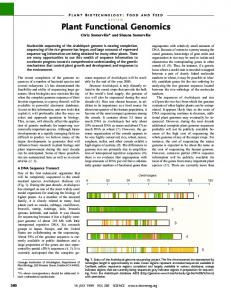
The two sections of a leaf are simultaneously infiltrated by submerging leaf discs in cultures of Agrobacterium and applying a vacuum. Transformation success is evaluated 48 h after infiltration by observing EGFP fluorescence. A leaf is only used for subsequent functional characterization of EGFP is uniformly present across >80 % of the surface area of the control and experimental sections of a given leaf. A workflow diagram of the transient transformation process is depicted in Fig. 1. It is important to note that efficiency of transformation varies significantly between leaves, and proper appraisal of leaf stage is critical for a successful experiment. At least 3 replicates per transgene are typically used for statistical power. In order to ensure that 3–5 leaf sections per construct are successfully transformed, we recommend infiltrating 8–10, anticipating several leaves will not pass the EGFP coverage threshold. Cacao leaf stages were previously described [17]; however, as accurate determination of leaf stage is integral to successful transient transformation, we sought to more quantitatively describe the stages to enhance reproducibility of the protocol. In developing the protocol, we found that leaf age affected transformation efficiency, with both earlier and later developmental stages showing lower transformation success as measured by EGFP fluorescence. This resulted in our using Stage C leaves (Fig. 2a), which are expanded but still supple, for our transient transformation experiments. To demonstrate this observation, we transformed leaves of each stage, and 48 h after infiltration, photographed EGFP fluorescence (Fig. 2b–f ). To measure leaf toughness, we used a force gauge and performed a punch test on leaves of stages A through E. Figure 2g shows the mean force to puncture, averaged across five leaves, for each leaf stage. Our protocols for collection and transformation and photographing of the five leaf stages, as well as the protocol for the force to puncture test, can be found in the Additional file 1. The data indicates that early in their development (through stage C), leaves do not significantly increase in rigidity. Stage D and E leaves, however, are measurably more rigid. Therefore, it is essential to take into account both leaf color (stage C leaves are bronze to light green) and rigidity to select leaves most likely to be successfully transformed. In order to evaluate the rate at which cacao leaves infiltrated with Agrobacterium become transformed, we monitored expression of an EGFP transgene over a time course after infiltration. Leaves were imaged using a fluorescence stereo-microscope. Images were acquired immediately after transformation and every 3 h after bacterial infiltration (ABI) for the first 48 h, and at hours 60, 84, 108, 132, and 156. No EGFP fluorescence was detected until 18 h ABI. Fluorescence intensity increased
Fister et al. Plant Methods (2016) 12:19
Page 3 of 13
1. Inoculate Agrobacterium. Incubate overnight (25°C, 200 rpm) to 1 OD.
4. Collect Stage C leaves.
2. Prepare induction media. 3. Transfer Agrobacterium to induction media. Induce for 5 hours (25°C, 200 rpm).
6. Add Silwet L-77 to 0.02%. Transfer Agrobacterium to petri dish.
5. Section leaves Dip cut ends in paraffin Prepare plates
7. Submerge leaves in Agrobacterium cultures
8. Vacuum infiltrate for 10 minutes. Ensure pressure reaches -22 in. Hg.
9. Incubate leaves for 48 hours. 12 hr / 12 hr day/night cycle. 10. Use fluorescence microscope to screen for >80% EGFP coverage
Fig. 1 Workflow diagram for transient transformation of cacao leaf tissue
until its peak at 45 h ABI, remained high until 60 h, and then steadily declined. EGFP fluorescence was quantified using ImageJ and is graphed as a percentage of the level detected at 45 h ABI (Fig. 3). Because the intensity peaks approximately 2 days ABI, this time point was selected to evaluate transformation success before proceeding into subsequent experiments. Further, our earliest detection of transient expression at hour 18 was consistent with findings in tobacco [24], and peak expression in our time course is consistent with results from transient transformation of Arabidopsis [25]. While the protocol was optimized for transformation of Stage C leaves [17] from genotype Scavina 6, it can be applied to other genotypes. Figure 4 includes photographs of stage C leaves from eight genotypes (Fig. 4a), as well as representative photographs showing transformation efficiency of these genotypes (Fig. 4b–i). In Fig. 4j, the transformation efficiency of each genotype was calculated and graphed relative to that measured in the Scavina 6 genotype. Our protocol for this genotype transformation optimization test, including calculation of transformation efficiency with ImageJ [26], can be found in the Additional file 1. While Scavina 6 exhibited the highest transformation efficiency, three other genotypes (CCN51, ICS1, TSH1188) had mean transformation efficiencies greater than 80 %, suggesting that our protocol
could likely be easily applied to these varieties. Physiological differences between leaves of different genotypes may contribute to decreased efficiency, and some alterations to the protocol may be necessary to overcome low efficiencies of the transformation-recalcitrant varieties. We have also previously noted that Scavina 6 leaves appear to remain green and survive longer in petri dishes than other genotypes [13], so it may be generally more suitable to long-duration experiments. After identifying successfully transformed leaves, subsequent experiments including RNA extractions, pathogen inoculations, and lipid extractions can be performed, as have been described [13, 14, 19, 22]. Leaves will show significant desiccation 5–7 days after being detached from plants; therefore, experiments should not require more than 3–5 days after transformation success is confirmed. Other than this limitation, the transformation strategy can be widely applied to gene characterization studies. In addition to the transformation protocol, we also provide here a detailed methodology for infection of leaves with pathogen after transformation. In addition to the transformation protocol, we also provide here a detailed methodology for infection of leaves with pathogen after transformation. In Fig. 5, we have included additional data demonstrating the effect of transient overexpression of a previously
Fister et al. Plant Methods (2016) 12:19
Page 4 of 13
a
b
c
e
f
d
g p = 2.4 E -6
Force to Puncture (N)
4 3.5 3 2.5 2 1.5
p = 1.8 E -4
1 0.5 0
A
B
C
D
E
Leaf Stages
Fig. 2 Leaf stages and force to puncture measurements. a Photograph displaying representative leaves of stages A (leftmost) to E (rightmost) collected from genotype Scavina 6. Scale bar represents 5 cm. b–f Representative photographs of EGFP fluorescence taken 48 h after infiltration of leaves (stages A–E) with Agrobacterium. Scale bars represent 1 mm. g Measurement of force to puncture for each leaf stage. Bars represent mean of five measurements, each representing one leaf from that stage. Bars represent standard deviation across five replicates. T test p values are shown above bars for Stage D and Stage E, which are comparisons of measurements of Stage C leaves with those of the older stages. Differences between Stage A and C and B and C were not significant
Fister et al. Plant Methods (2016) 12:19
Page 5 of 13
120
Fluorescence intensity (%)
100 80 60 40 20 0
0
20
40
60
80
100
120
140
160
Hours after bacterial infiltration
Fig. 3 Time course of EGFP fluorescence intensity after infiltration of leaf tissue with Agrobacterium. Fluorescence is expressed as a percentage of the intensity measured at hour 45, the peak time point. Error bars represent standard deviation calculated from three biological replicates
described cacao chitinase gene [15]. Our protocol for these experiments is available in the Additional file 1. Two constructs were used for the transient transformation, pGH00.0126 (GenBank: KF018690), in which EGFP is driven by the CaMV 35S promoter, and another (pGAM00.0511, described in [15]) which has an additional cassette containing a cacao chitinase gene (Tc02_ g003890) under the CaMV 35S promoter. Chitinase overexpression using this system resulted in decreased lesion size after infection with Phytophthora tropicalis (Fig. 5a, b), a decrease in the ratio of pathogen to cacao DNA detected in the tissue (Fig. 5c), and an approximately six-fold increase in chitinase transcript abundance as assessed by qRT-PCR (Fig. 5d). We have previously documented differences in basal response to infection to the pathogen Phytophthora tropicale in leaf tissue taken from different cacao genotypes using our detached leaf infection assay [13]. While the earlier analysis focused on only one model tolerant genotype (Scavina 6) and model susceptible genotype (ICS1), here we present preliminary data expanding this analysis to 17 genotypes. Additional file 1: Fig. S1 shows box and whisker plots representing the area of infected tissue 72 h after inoculation using the detached leaf infection protocol described here. Additional file 1: Fig. S2 contains representative photographs of the infected leaf tissue from the 17 genotypes. The dramatic differences in susceptibility highlight the need for application of the transient transformation protocol to a wide range of genotypes in order to understand better the genetics underlying differential defense response.
Reagents and equipment For transformation: •• Agrobacterium is cultured in 523 media, and induced as previously described [27]. Recipes for these media can be found in Table 1. •• A Fast PES Filter unit (Thermo Scientific, Cat. No. 124-0045) is used to sterilize induction media. •• Before infiltration of leaves, Silwet L-77 (Lehle Seeds, Cat. No. VIS-01) is added to Agrobacterium cultures to act as a surfactant. •• Plants used for these experiments are greenhousegrown on The Pennsylvania State University, University Park campus under previously described growth conditions [28]. They are also described in the Additional file 1. •• After leaves are infiltrated with Agrobacterium, they are maintained in a controlled environment at 25 °C with 50 % relative humidity and a 12 h/12 h light dark cycle. Light levels are maintained at 55 µmol m−2 s−1, using fluorescent bulbs 4100 K Kelvin ratings. Higher light levels did not affect transgene expression, but did lead to faster desiccation of leaves. •• Gast G582DX Vacuum Pump. •• Science-Ware vacuum desiccator (Cat# 420270000). •• Whatman grade 5 qualitative filter paper, 90 mm diameter discs (Cat# 1005-090). •• Sterile 100 mm × 20 mm petri dishes (Fisher Brand Cat# FB0875711Z). •• Paraplast Plus tissue embedding medium (McCormick Scientific Cat# 39503002).
Fister et al. Plant Methods (2016) 12:19
Page 6 of 13
Fig. 4 Transformation of eight cacao genotypes. a Photograph showing stage C leaves selected from eight cacao genotypes. Some genotype identifiers are abbreviated: Sca6 Scavina 6, Criollo B97-61/B2, ICS1 Imperial College Selection 1. Scale bar represents 5 mm. b–h Representative images of EGFP coverage 48 h after agrobacterium infiltration using the eight genotypes shown in panel a. Scale bars represent 1 mm. b Sca6; c CCN51; d CF2; e Criollo; f ICS1; g GU255; h PA107; i TSH1188. j Bar graph depicting transformation efficiency expressed as a percentage of that calculated for Scavina 6 samples. Error bars represent standard deviation calculated from three biological replicates
Fister et al. Plant Methods (2016) 12:19
Page 7 of 13
a 35S:: TcChi1
Ctrl
Average lesion area (cm2)
b
1.2 1 0.8
0.4 0.2 0
d
0.16
0.12
0.08
*
0.04
0
Ctrl
35S: :TcChi1
Transcript level relative to TcActin and TcUbiquitin
Ratio of PtActin to TcActin
c
*
0.6
Ctrl
1.4
35S: :TcChi1
*
1.2 1 0.8 0.6 0.4 0.2 0
Ctrl
35S: :TcChi1
Fig. 5 Functional analysis of TcChi1. a Representative images of lesions from control (Ctrl, transformed with pGH00.0126) and leaves transiently transformed to overexpress TcChi1 2 days after Phytophthora tropicalis inoculation. Scale bar represents 1 cm. b Average lesion areas from control and TcChi1 overexpressing leaves were measured 3 days after inoculation using ImageJ. Bar charts represent the mean ± SE of measurements from 12 lesion spots from four leaf discs of each genotype. c Pathogen biomass was measured at the lesion sites by qPCR to determine the ratio of pathogen DNA to cacao DNA 2 days after inoculation. Bar charts represent four biological replicates, each with three technical replicates. d qRT-PCR analysis of TcChi1 transcript 2 days after vacuum infiltration. Data represent mean ± SE of three biological replicates. The asterisks denote a significant difference determined by single factor ANOVA analysis (p