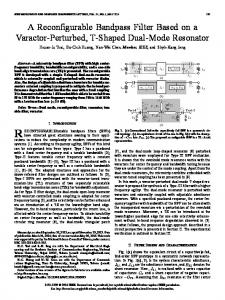
IEEE 2007 Custom Intergrated Circuits Conference (CICC)
PSP-Based Scalable MOS Varactor Model J. Victory1, Z. Zhu2, Q. Zhou2, W. Wu2, G. Gildenblat2, Z. Yan1, J. Cordovez1, C. McAndrew3, F. Anderson4, J. C. J. Paasschens5 , R. van Langevelde6, P. Kolev7, R. Cherne8, and C. Yao9 1
Jazz Semiconductor, Newport Beach, CA, 2Ira A. Fulton School of Engineering, Department of Electrical Engineering Arizona State University, Tempe, AZ, 3Freescale Semiconductor, Tempe, AZ, 4IBM, Burlington, VT 5 NXP Semiconductors, Gerstweg 2, 6534 AE Nijmegen, The Netherlands, 6Philips Research, Eindhoven, The Netherlands 7 Formerly with RFMD, San Diego, CA, now with Qualcomm, San Diego, CA 8 Intersil Corporation, Palm Bay, Florida, 9Analog Devices, Inc., Wilmington, MA E-mail:
[email protected] Abstract - A physically based scalable model for MOS Varactors is presented. The model includes a PSP-based analytical surface potential charge formulation, MOS varactor specific gate current models, and physical geometry and process parameter based parasitic modeling. Key device performances of capacitance and quality factor Q are validated over voltage, frequency, and geometry, for several technologies. The model, implemented in Verilog-A, provides robust and accurate RF simulation of MOS varactors. A VCO design application is detailed.
I. INTRODUCTION Continuing advances in RF CMOS technology have made it a viable platform for RF/analog and millimeter wave circuits. Design of these circuits requires accurate, scalable compact models for the active transistors and passive components in a given technology. This includes MOS varactors, which provide frequency tuning for circuits such as voltage-controlled oscillators (VCOs). MOS varactors are typically the only tuning elements offered in RFCMOS process design kits. In 2006, the Compact Model Council (CMC) launched a MOS varactor model standardization process, forming a subcommittee of modeling engineers from across the industry. The subcommittee defined requirements for an industry standard MOS varactor model, and improvements needed to the model of [1]. One requirement was consistency with the new industry standard PSP MOSFET model [2]. As the MOSFETs and MOS varactors in a given technology are closely related, consistency between models for related MOS devices is highly desirable. Characterization of technology parameters related to oxide thickness, quantum mechanical (QM) effects, poly depletion, and fringing capacitance for example can be done for one device type (e.g. a MOSFET) and then the parameters used for another device (e.g. a MOS varactor). Moreover, consistent MOS device models enable statistical model consistency and correlation across a technology model library. Prior MOS varactor models are predominantly subcircuits that include a frequency independent intrinsic capacitance through either a MOSFET (BSIM) model or a polynomial behavioral equation. Device parasitic resistance, capacitance and inductance are included through lumped elements, and
1-4244-1623-X/07/$25.00 ©2007 IEEE
device performances are validated over a small geometry and frequency space [3]-[6]. This paper advances the state-of-the-art by providing a physically based scalable MOS varactor model, MOSVAR, consistent with the industry standard PSP MOSFET model. Parasitic components, responsible for the variable reactance of the device, are modeled physically. A gate current model, uniquely derived for the MOS varactor structure, is presented here for the first time. The model is implemented in the Verilog-A language. Section II details MOS varactors and the MOSVAR model. Model validation over a wide range of technologies is presented in section III. Section IV investigates MOSVAR scaling effects on critical VCO performances such as the VCO gain KVCO and phase noise.
Fig. 1 N+ poly/Nwell MOS varactor with MOSVAR model network
II. DEVICE AND MODEL DESCRIPTION Fig. 1 shows a typical N+ poly/Nwell MOS varactor with the MOSVAR model equivalent network embedded in the physical layout. The model includes elements related to the poly-silicon gate, the oxide, and the well or bulk region below the oxide, including contacts to the well. MOSVAR includes neither the parasitics associated with the well and underlying substrate (P-substrate here), nor the metal parasitics shown in
18-1-1
495
Fig. 2. As varactors can be formed in multiple well configurations and devices can be arrayed and connected through various metallization schemes, layout and substrate parasitics are better handled at a subcircuit level. For this reason, MOSVAR is a 3-terminal model with the terminals g, b, and bi. The bi terminal allows for connection of the NwellP-substrate parasitic network. (Note that from symmetry only one half of the networks in Fig. 1 and Fig. 2 is actually included in the MOSVAR model; the mirrored networks are included for mapping to the physical structure.)
Fig. 2 N+ poly/ Nwell MOS Varactor with MOSVAR model and layout/substrate parasitics embedded
Differential varactors, formed in a common well with alternating gates forming the differential terminals, are common in differential VCO design [6], [7]. The MOSVAR model is easily extended to differential designs by making the gi or gii terminal external, to allow differential connection of the parasitic gate-to-gate capacitance. Table 1 lists the MOSVAR model parameters; those common to PSP are in shaded boxes. The changes in components Ci, Cfr, Rac, Rsub, Rend, and Rgsal, originally presented in [1], are reviewed here. Element multiplicity is scaled through M. The model includes extensive temperature modeling where temperature related parameters begin with “ST” in Table 1. Details of the temperature modeling and verification are not presented here for brevity. A. Frequency Dependent Intrinsic Capacitance Ci MOSFET models assume a frequency independent inversion charge, supplied from the source and drain. Without source or drain regions the inversion charge in an accumulation-mode MOS varactor depends on frequency, since it is thermally generated. In MOSVAR, the intrinsic charge is modeled through a frequency dependent analytical surface potential model fully consistent with the PSP surface potential model [1], [8]. The MOSVAR QM model is from PSP. However, accumulation in the poly-silicon, ignored in PSP, is included in MOSVAR.
Parameter TOXO VFBO NSUBO NPO QMC DLQ DWQ DWR NGCON TAU CFRL CFRW RSHG RPV REND RSHS UAC UACRED STVFB STRSHG STRPV STREND STRSHS STUAC NOVO LOV GCOO* IGINVLW* IGOVW* STIG* GC2O* GC3O* CHIBO*
Description Oxide thickness Flatband voltage Substrate (Well) doping level Polysilicon doping level Quantum mechanical correction factor Length delta for intrinsic capacitance Width delta for intrinsic capacitance Width delta for substrate resistance Number of gate contacts (1 or 2) Time constant for inversion charge recombination/generation Fringing capacitance in length direction Fringing capacitance in width direction Gate sheet resistance Vertical poly contact resistance End resistance/unit width Substrate (Well) sheet resistance Accumulation layer zero bias mobility Accumulation layer mobility reduction factor Temperature exponent of VFB Temperature exponent of RSHG Temperature exponent of RPV Temperature exponent of REND Temperature exponent of VFB Temperature exponent of UAC Doping of overlap region Length of overlap region Gate tunneling energy adjustment Gate channel current pre-factor Gate overlap current pre-factor Temperature coefficient for iginv and igov Gate current slope factor Gate current curvature factor Tunneling barrier height
Table 1. MOSVAR Parameters , parameters common to PSP are
shaded gray, *Separate values of parameters are used for each component of gate tunneling current
B. Fringing Capacitance Cfr Overlap and fringing capacitances are lumped together into Cfr. Parasitic capacitances along the gate width and length are included. The length component is generally neglected in practice since the poly edge termination along the lengths is over field or shallow trench oxide and the length is small compared to the width. The total fringe capacitance is (1)
(
)
C fr = 2 ⋅ CFRW ⋅ W g + CFRL ⋅ L g ⋅ M
C. Well and Accumulation Resistance Rac, Rsub, and Rend The well or bulk under the gate oxide forms a parallel combination of a bias independent well resistance and a bias dependent accumulation resistance. The assumption of bias independence of the well resistance in depletion follows from the high doping of the surface regions in sub-micron MOSFET
18-1-2
496
technologies; variation of the thin depletion region under the oxide has a negligible effect on the resistance of the well. Measurements validate this assumption; they show no appreciable well resistance variation with gate bias. The bias independent well resistance is (2)
R sub = RSHS ⋅
Lg
(12 ⋅ W g ⋅ M )
As the gate bias increases above the flatband voltage, an accumulation layer forms, therefore (3)
Rac =
(7)
Lg
(W g ⋅ µacV ⋅ Qac ⋅ M )
where µacV = UAC [(1 + UACRED ⋅ (VFBO − VGBi ))] including low-field surface mobility and mobility degradation parameters, and Qac is the accumulation charge density determined directly from the surface potential. A significant portion of the MOS varactor resistance is from the well end resistance, formed by the lightly doped source/drain contact regions, the salicided contact diffusion, and the contact resistance. This resistance does not change with gate length and is the factor that limits the maximum Q for minimum Lg. The end resistance is given by (4)
Rend =
possible polarities of gate and silicon dopants, leading to different possible tunneling current components, such as electron conduction band (ECB), electron valence band (EVB) and hole valence band (HVB), see Fig. 3. A detailed physical analysis is presented in [14]. It is clear that HVB tunneling, which is not essential in bulk MOSFETs, may become significant for varactors. Second, the surface potential in varactors is position-independent, which simplifies the tunneling current model. Both channel and overlap tunneling current densities are computed using Tsu-Esaki formula [15] Jg =
* ⋅ k BT q ⋅ mox
2π 2 ⋅ = 3
∫ D( Ex ) Fs ( E x )dE x
where D( E x ) is the transmission coefficient, Fs ( E x ) is the supply function, E x is kinetic energy associated with motion * is the in the direction normal to the potential barrier and mox effective electron mass in oxide. For the purpose of compact modeling, we use the mono-energetic approximation of the integral in (7), as developed in [12], [13] and used in the PSP model [16]. In the mono-energetic approximation E x = Vox for Vox > 0 and E x = 0 for Vox < 0 , with a smoothing function used to provide non-singular behavior at Vox = 0 .
REND
(2 ⋅ W g ⋅ M )
where the factor 2 accounts for the symmetry of the gate segment. D. Poly Gate Resistance Rgsal and Rgpv The salicided poly gate resistance is given by the well known expression (5)
R gp = RSHG ⋅
(3 ⋅ L
Wg g
⋅ NGCON2 ⋅ M
)
The silicide to poly contact resistance as described by Litwin [9] and implemented into a MOSFET gate resistance model by Scholten et al. [10], is given by (6)
R gpv =
RPV . Wg ⋅ L g ⋅ M
(
)
The two gate resistance components enable accurate, scalable modeling of total gate resistance. Additionally, the gii node allows for physical placement of the fringing capacitance Cfr, directly affecting the quality factor. D. Gate Current Engineering models of the tunneling current in MOSFETs have been discussed in [11], [12] and [13]. The tunneling current model in MOS varactors is conceptually similar, but differs in several significant aspects. First, there are different
Fig. 3 Dominant tunneling current components in different MOS varactor structures
The resulting expressions for the different tunneling current components differ primarily in the supply function. For example, in case of the N+/NWELL structure shown in Fig. 1, the HVB current density is (8)
J g , HVB ≈ J g 0, HVB ⋅ D HVB ⋅ Fs , HVB
where J g 0, ECB is a model variable, theoretically equal to * qmox (k B T )2 /(2π 2 ⋅ = 3 ) , and the transmission coefficient is estimated using the WKB method as (9)
3 D HVB = exp − B HVB − GC2O ⋅ z g − GC3O ⋅ z g 2 2
.
18-1-3
497
Here B HVB = 4t ox 2mox * ⋅ CHIBO 3= where for HVB tunneling, CHIBO is the band offset between the valence bands of Si and that of SiO2 and z g = Vox / CHIBO where Vox denotes oxide voltage. The model parameters GC2O and GC3O compensate for the use of the WKB approximation * . The surface potential based HVB and for uncertainty in mox supply function is (10)
(
)
1 + ∆ HVB ⋅ exp V gb / φ t Fs, HVB = ln 1 + ∆ HVB
where ∆ HVB = exp[−(ψ s + E g / q − α b + E x / q) / φt ] . Here ψ s denotes surface potential, E g is the silicon bandgap, α b = ( E c − E F ) / q in the bulk and V gb is the gate bias referenced to body-diffusion bias which is almost always grounded to suppress substrate noise.
The remaining components of the tunneling current are evaluated similarly. Typical results for N+/NWELL structure are shown in Fig. 4 and Fig. 5. Nine devices with different length and width were fitted simultaneously using the same parameter set, with no scaling parameters for the gate current. III. SILICON VALIDATION OF RF MODEL Robust measurement and extraction procedures for predominantly process and geometry based parameters across a wide geometry, bias, and frequency space for 0.18 µm RFCMOS technology were presented in [1]. The techniques are further validated in this work on data from the Jazz 0.13 µm RFCMOS technology. At low frequencies (500MHz), the total gate capacitance is Im(y11)/(2πf). Q=Im(y11)/Re(y11) values are extracted in the GHz range where Re(y11) is within the dynamic range of the network analyzer (NWA). Fig. 6 through Fig. 8 show C(V), Q(V), and Q(f) respectively, for an N+/Nwell 1.2V oxide device with varying Lg. The model accurately predicts the reduced tuning range (Cmax/Cmin) with decreasing Lg due to the influence of Cfr. Further, the significant decrease in Q with increasing Lg due to increasing well resistance is modelled well. Fig. 9 through Fig. 11 show the same quantities for varying Wg. The model accurately predicts the decrease in Q with increasing Wg due to increased Rgsal. The mismatch between model and data for Quality Factors above 125 is attributed to dynamic range limitations of the NWA. Fig. 12 and Fig. 13 show the accuracy of simulation of C(V) and Q(V) for N+/Nwell 3.3V oxide devices with varying Lg. The thicker oxide gives a lower tuning range for the 3.3V MOS varactors. Combined with the 1.8V N+/Nwell data presented in [1], the MOSVAR model is thus shown to be valid for wide range of devices with varying oxide thicknesses (1.9-7.0 nm).
Vb 0-0.5, 0.1 step
Fig. 4 Igate over bias for 1.2V N+/Nwell MOS Varactor, Wg=3µm, Lg =0.5µm
Fig. 14 shows C(V) for 1.8V N+/Nwell and P+/Nwell varactors from Jazz’s 0.18µm RFCMOS technology. The P+/Nwell MOS varactor is of particular interest since the C(V) tuning is shifted to the positive Vgb range, facilitating simpler VCO topologies like those used for junction varactors. In addition, the P+ poly does not deplete in the accumulation region, increasing the tuning range compared to the N+ poly device. The model predicts the one bandgap shift in flatband voltage in changing from N+ to P+ poly. IV. VCO PERFORMANCE
Fig. 5 Igate over Lg for 1.2V N+/Nwell MOS Varactor, Wg=3µm, Vb=0
Modern day RF standards, such as WLAN, WiMAX, UWB, automotive radar and high speed optical communications systems use high frequency VCOs for frequency synthesis and system timing [17], [18], [19]. In order to obtain a high-frequency oscillator with high frequency-accuracy, high-frequency VCO's are embedded in frequency synthesizers which use a high-precision (lowfrequency) oscillator as input. In a typical VCO, a tank circuit, consisting of an integrated inductor and a MOS varactor, controls the oscillation frequency.
18-1-4
498
Fig. 6 C(V) for 1.2V N+/Nwell MOS Varactors, varying Lg
Fig. 9 C(V) for 1.2V N+/Nwell MOS Varactors, varying Wg
Fig. 7 Q(V), 4GHz for 1.2V N+/Nwell MOS Varactors, varying Lg
Fig. 10 Q(V), 4GHz for 1.2V N+/Nwell MOS Varactors, varying Wg
Q(f), Vgb=0 for 1.2V N+/Nwell MOS Varactors, varying Lg
Fig. 11 Q(f), Vgb=0 for 1.2V N+/Nwell MOS Varactors, varying Wg
Fig. 8
18-1-5
499
Fig. 15 shows an RF CMOS VCO, based on the negative resistance principle, using complementary cross coupled NFET and PFET pairs. This topology of voltage limited oscillator offers a larger available transconductance, decreased switching times, and tighter output symmetry than a standard NFET-only topology [20]. This gives improved phase noise (PN) and simplifies design. The VCO oscillation frequency is set by the differential inductor (L) and MOS varactor (C1 and C2) tank. Resistive tank losses are compensated by the negative resistance of the cross coupled pairs, enabling sustained oscillation. The tank quality factor (Qtank), which directly affects the phase noise of the VCO, is (11)
Qtank =
Q L ⋅ QC ωL , = Q L + QC R L + ω 2 LCRC
derived using the approximations for the tank components:
Fig. 12 C(V) for 3.3V N+/Nwell MOS Varactors, varying Lg
(12)
Fig. 13 Q(V) , 2 GHz for 3.3V N+/Nwell MOS Varactors, varying Lg
Q L = ωL R L
, QC = 1 ωCRC .
RX (where X denotes L or C) is the resistive loss for each component in the series tank path. Eq. (11) shows that as frequency increases, Qtank approaches QC. Fig. 16 shows Q for three inductors designed to peak at 2, 5, and 10GHz, respectively. The inductor Q deviates from the ideal QL at high frequencies, peaking and decreasing due to skin effect and capacitive losses. The inductance is decreased by lowering the conductor length, which reduces capacitive losses. This in turn extends the range of ideal QL behavior with frequency, giving a higher peak Q for higher frequency applications. Varactors scaled through parallel multiplicity of fixed Wg×Lg devices, where C ⋅ RC is constant, show a steady decrease in Q with frequency as shown in Fig. 16. At 2GHz, QL is roughly an order of magnitude lower than QC and hence dominates Qtank. At 5GHz and above, QC is of the same order or lower than QL, clearly affecting Qtank. Leeson’s phase noise model [20] provides additional insight into the varactor impact on phase noise. It relates the phase noise transfer function H(j∆ω) to the oscillator parameters by (13)
2
H ( j∆ω ) =
1 4(Qtank )2
ω0 ∆ω
2
where ω0 is the oscillator center frequency and ∆ω is the offset frequency from ω0 where the phase noise measurement is taken. At frequencies where QC dominates, (11) and (13) 2 show that H ( j∆ω ) ∝ (RC )2 . Fig. 17 shows PN simulations of the VCO with the MOSVAR model. The PN increases with Lg, as expected due to the increased RC. In addition, dPN dLg increases at higher frequencies due to the increased influence of QC compared to QL.. Fig. 14 C(V) for 1.8V N+/Nwell and P+/Nwell MOS Varactors, Wg=3µm, Lg=0.5µm
18-1-6
500
In addition to PN, VCO tuning dynamics are commonly benchmarked through the VCO gain, KVCO, defined as (14)
KVCO =
dω . dV
For the case of the LC circuit, ω = 1 LC . The voltage controlled varactor capacitance is given by (15)
C = Ci′ ⋅ Wg ⋅ Lg + 2 ⋅ CFRW ⋅ Wg
where C i ′ is the intrinsic MOS capacitance per unit gate area and the fringing capacitance in the length direction (CFRL) is assumed to be negligible. The derivative of C with respect to voltage is (16)
′ dC dC i = ⋅W g ⋅ Lg . dV dV
Given ω = 1 (17)
Fig. 15 VCO based on cross coupled NFET and PFET pairs
LC , combining (14) and (16) yields
KVCO =
dCi ′ 2 Ci′ ⋅ Lg + CFRW dV
ω
Lg
⋅
⋅
which for small Lg approaches (18)
KVCO =
dCi′ 2 CFRW dV
ω
⋅
Lg
⋅
and for the large Lg saturates to (19)
KVCO =
dCi ′ 2 ⋅ Ci′ dV
ω
⋅
Equations (18) and (19) provide direct insight into the behavior of KVCO over varactor length. Simulations of the KVCO vs. Lg, shown in Fig. 18, verify the physical accuracy of the MOSVAR model, facilitating evaluation of critical VCO design tradeoffs. For the first time, to the knowledge of the authors, this aspect of MOS varactor modeling is reported.
Fig. 16 Inductor and MOS varactor Q over frequency
Fig. 17 Simulated phase noise at ∆f=100KHz over Lg
18-1-7
501
[7]
H. Muthali, T. Thomas, and I. Young, “A 10-Gb/s SONET Transceiver,” IEEE J. Solid State Circuits, vol. 39, no. 7, pp. 1026-1033, July 2004. [8] J. Victory, C. C. McAndrew, and K. Gullapalli, “A Time-Dependent, Surface Potential Based Compact Model for MOS Capacitors”, IEEE Electron Device Lett., vol. 22, no. 5, pp. 245-247, May 2001. [9] A. Litwin, “Overlooked Interfacial Silicide-Polysilicon Gate Resistance in MOS Transistors”, IEEE Trans. Electron Devices., 48, no. 9, pp. 2179-2181, 2001. [10] A. J. Scholten, L. F. Tiemeijer, R. van Langevelde, R. J. Havens, A.T. A. Zegera-van Duijnhoven, and V. C. Venezia, “Noise Modeling for RF CMOS Circuit Simulation”, IEEE Trans. Electron Devices., vol. 50, no. 3, pp. 618-632, 2001. [11] R. van Langevelde, A. J. Scholten, and D. B. M. Klaassen, Physical Background of MOS Model 11 [Online]. Available: http://www.nxp.com/acrobat_download/other/philipsmodels/nl_tn_2003_00239.pdf
Fig. 18 Simulated KVCO over frequency and Lg
V. CONCLUSION A complete surface potential-based MOS varactor model, consistent with the PSP MOSFET model, has been developed for RFCMOS and BiCMOS technologies. Reformulation and extension of the tunneling current models include MOS varactor specific ECB, EVB, and HVB components and contributions from both the channel and overlap regions. The model has been extensively verified by comparison with experimental C(V), Q(V,f), and gate leakage current data. The model contains physical process parameters, enabling simulation of changes in device characteristics associated with the changes in fabrication process. The scalability of the model enables simulation of critical trade-offs in VCO design. ACKNOWLEDGMENTS
[12] X. Gu, T-L Chen, G. Gildenblat, G. Workman, S. Veeraraghavan, S. Shapira and K. Stiles, “A Surface Potential-Based Compact Model of nMOSFET Gate-Tunneling Current” IEEE Trans. Electron Dev, vol. 51, no. 1, pp. 127-135, January 2004. [13] W. Wu, X. Li, G. Gildenblat, G. Workman, S. Veeraraghavan, C. McAndrew, R. van Langevelde, G. D. J. Smit, A. J. Scholten, and D. B. M. Klaassen, “A compact model for valence-band electron tunneling current in partially depleted SOI MOSFETs,” IEEE Trans. Electron Dev, Vol 54, No. 2, pp 316-322., February 2007. [14] J. Cai and C-T Sah, “Gate tunneling currents in ultrathin oxide metaloxide-silicon transistors,” Journal of Applied Physics, vol. 89, no. 4, pp. 2272-2285, 2001. [15] R. Tsu and L. Esaki, “Tunneling in a finite superlattice,” Appl. Phys. Lett., vol. 22, pp. 562-564, 1973. [16] G. Gildenblat, X. Li, H. Wang, W. Wu, R. van Langevelde, A. J. Scholten, G. D. J. Smit, and D. B. M. Klaassen, PSP Model Manual March 2006. [Online]. http://pspmodel.asu.edu/downloads/PSP101_Summary.pdf [17] Y. Han, L.E. Larson, D.Y.C. Lie, “A Low-Voltage 12GHz VCO in 0.13 µ m CMOS for OFDM Applications,” Silicon Monolithic Integrated Circuits in RF Systems Conference Proc., pp. 379-382, January 2006. [18] C. Changhua, Y. ding, and K. K. O., “A 50-GHz Phase-Locked Loop in 130-nm CMOS,” Proc. IEEE 2006 CICC, pp. 21-24, 2006 [19] M. Simon, P. Laaser, V. Filimon, H. Geltinger, D. Friedrich, Y. Raman, R. Weigel, “An 802.11a/b/g RF Transceiver in an SoC,” Proc. IEEE 2007 ISSCC, pp. 562-622, 2007 [20] B. Razavi, “RF Microelectronics,” pp. 221, Prentice Hall, Upper Saddle River, NJ, 1998
The authors gratefully acknowledge the contribution of Jie Zheng and Li Dong of Jazz Semiconductor for measurement support. REFERENCES [1]
[2]
[3]
[4] [5] [6]
J. Victory, Z. Yan, G. Gildenblat, C. McAndrew, X. Cai and J. Zheng, “A Physically Based, Scalable MOS Varactor Model and Extraction Methodology for RF Applications,” IEEE Trans. Electron Dev., vol. 52, no. 7, pp. 1343-1353, Jul. 2005. G. Gildenblat, X. Li, W. Wu, H. Wang, A. Jha, R. van Langevelde, G.D.J. Smit, A.J. Scholten and D.B.M. Klaassen, "PSP: An Advanced Surface-Potential-Based MOSFET Model for Circuit Simulation,” IEEE Trans. Electron Dev., Vol. 53, No. 9, pp. 1979-1993, September 2006., A. Porret, T. Melly, C.C Enz, and E. A. Vittoz, “Design of High-Q Varactors for Low-Power Wireless Applications Using a Standard CMOS Process,” IEEE J. Solid State Circuits, vol. 35, no. 3, pp. 337345, 2000. P. Andreani and S. Mattisson, “On the Use of MOS Varactors in RF VCO’s,” IEEE J. Solid State Circuits, pp. 905-910, vol. 35, no. 6, 2000.. K. Molnar, G. Rappitsch, Z. Huszka, and E. Seebacher, “MOS Varactor Modeling With a Subcircuit Utilizing the BSIM3v3 Model”, IEEE Trans. Electron Devices, vol. 49, no. 7, pp. 1206-1211, July 2002 S. Song and H. Shin, “An RF Model of the Accumulation-Mode MOS Varactor Valid in Both Accumulation and Depletion Regions”, IEEE Trans. Electron Devices, vol. 50, no. 9, pp. 1997-1999 , September 2003
18-1-8
502