Qualitative Evaluation of Feature Lines on Anatomical Surfaces Kai Lawonn, Rocco Gasteiger, Bernhard Preim Otto-von-Guericke University Magdeburg
[email protected]
Abstract. This paper deals with the application of feature lines on patient-specific anatomical surfaces used for treatment planning. We introduce the most commonly used feature line methods and evaluate them qualitatively. The evaluation is conducted by physicians and medical researchers to assess shape interpretation and visual impression of these methods compared to surface shading. We utilize several anatomical models, which were derived from clinical image data. Furthermore, we identify the limitations of this kind of illustrative visualization and discuss requirements for their application.
1
Introduction
In medicine, illustrations are primarily known from anatomical atlases where they are used for illustrating anatomical structures and treatment procedures. Only essential information of the object are depicted and unnecessary information are omitted to avoid visual clutter. Moreover, illustrative visualization has a high potential in medical applications such as surgery planning [1] and intraoperative visualizations [2]. They are useful to present integrated or contextual information, e.g., from pre- and intraoperative image data or multimodal diagnostic data. In this paper, we focus on illustrative surface visualizations of anatomical structures rather than on illustrative volume visualizations. The surfaces are derived from clinical image data and binary segmentation masks. In general, surface data are visualized with common surface shading. For integrated visualizations, however, this can cause occlusions or increased visual complexity. Sparse representations like feature lines depict only certain surface features like concave and convex regions. Studies have shown that existing feature line techniques are highly valued as scientific illustrations based on artificial surface data [3]. Inspired by these techniques illustrative visualization methods like point and line renderings have been adapted for medical applications [4]. Tietjen et al. [1] employ silhouettes and feature lines to depict anatomical context structures and object boundaries in surgery and therapy planning visualizations. Another example of line rendering is hatching, which is used by Ritter et al. [2] for vascular structures to emphasize shape and thus to support depth perception. Among these techniques we focus on feature lines and their application and
2
K. Lawonn, R. Gasteiger, B. Preim
usability on patient-specific surfaces which are not well investigated. For artificial surfaces several studies have shown that current approaches can effectively depict shape and even match the effectiveness of hand drawings [3]. Existing feature line techniques can be categorized in image-based and objectbased approaches. Image-based techniques operate entirely on RGB or gray value input images of the scene and extract feature lines with convolution kernels [5]. However, the resulting lines are represented as pixel with limited control over the final rendering style, e.g., line thickness and dotted lines. Object-based methods use the surface model as input. Furthermore, additional information like camera and light position as well as curvature information are used to detect features. The extracted lines are represented as explicit 3D lines and arbitrary rendering styles can be applied. Our evaluation is based on four object-based methods for the automatic generation of feature lines: ridges and valleys [6], suggestive contours [7], apparent ridges [8], and photic extremum lines [9]. We give an overview about the underlying approach in Section 2. The contribution of this paper is to investigate the application of modern and powerful feature line methods on patient-specific anatomical surfaces. In contrast to artificial data sets, on which these methods are currently applied, the anatomical surfaces exhibit surface noise and artifacts (e.g., staircases). We want to evaluate the application and usability of these feature lines techniques in terms of shape depiction and visual impression. In particular, we perform a qualitative evaluation conducted by two physicians and one medical researcher to assess how much the medical experts can derive advantages from feature line drawings compared to surface shading.
2
Materials and Method
In this section we briefly explain the four feature line methods, we want to evaluate. Ridges and valleys (RV): Ridges and valleys [6] are defined as the loci of points at which the principle curvatures assumes an extremum in the principle direction De1 k1 = 0, where k1 is the principle curvature and e1 is the associated principle curvature direction. Additionally, we have: De1 De1 k1 < 0, for ridges and De1 De1 k1 > 0, for valleys. Here De1 k1 means the derivative of k1 in the direction of e1 . Furthermore, ridge and valley lines are drawn if the magnitude of the maximum principal curvature exceeds a user-defined threshold. As ridges and valleys are view-independent they can not capture salient features in smooth regions and require additionally object contours. Suggestive contours (SC): Suggestive contours [7] are view-dependent and of second order. These lines are defined as the set of minima of n · v in the direction of w, where n is the unit surface normal, v is the view vector, and w is the
Qualitative Evaluation of Feature Lines on Anatomical Surfaces
projection of the view vector on the tangent plane. Precisely: Dw (n · v) = 0, and Dw Dw (n · v) > 0. Furthermore, lines are drawn if the derivative magnitude is larger than a userdefined threshold. However, objects without concave regions have no suggestive contours. Apparent ridges (AR): Apparent ridges [8] extend the definition of ridges by using the maximum view-dependent curvature q1 and its corresponding viewdependent principle curvature direction t1 . Formally, these lines are defined as a set of points satisfying Dt1 q1 = 0. The maximum is identified with the orientation of the view-dependent principle curvature directions. To reduce lines they used a threshold based on q. Since q depends on the projection to the view screen it follows that features turned away from the viewer have a much higher curvature than feature regions facing the viewer. Photic extremum lines (PEL): PELs [9] are of third order and view- as well as light-dependent. These feature lines are defined as the set of points where the variation of illumination in its gradient direction is a local maximum Dw k∇f k = 0, and Dw Dw k∇f k < 0, ∇f with f = n · v as the headlight illumination function and w = k∇f k as the unit gradient of f . Additionally, theRlight-dependency can be used to improve the line drawing result. They check if kf kds exceeds a user-defined threshold to filter out noisy lines.
2.1
Evaluation
We performed a qualitative evaluation of the four feature line techniques to assess their capabilities in capturing important surface features compared with surface shading. The evaluation is conducted with two physicians and one medical researcher who are familiar with medical visualizations. Three representative surface models are chosen: a cerebral aneurysm, a trachea seen from an endoscopic view, and a liver. All surface models are derived from clinical image data and binary segmentation masks. Thus, they exhibit surface noise and other artifacts like staircases. Since all four feature line methods are based on higher order derivatives, they are sensitive to noise and the underlying tessellation. To ensure a reliable comparison between the different methods and to reduce these artifacts, we smooth each surface model with a low pass filter according to the recommendations in Bade et al. [10]. Furthermore, we ensure an equal and appropriate degree of tessellation among the surface models. Finally, we employed the original feature line implementations provided by the corresponding authors. The evaluation itself was conducted in two parts. In the first part, each participant was shown the shaded surface models, which could be explored interactively to gain an impression of important surface features. For each surface
3
4
K. Lawonn, R. Gasteiger, B. Preim
model one out of four feature line methods was overlayed successively. For each method, the participants were asked to adjust the corresponding threshold (recall Sec. 2) until the resulting feature lines capture as much as possible surface features compared to the shaded representation. Thereby, a tradeoff between inherent feature lines and false-positive feature lines resulting from surface artifacts should be considered. During the evaluation the participants were also able to hide the shaded surface model. At the end of each adjustment the final threshold was recorded. The second part consists of a visual comparison and a qualitative assessment between the feature line methods. Based on the recorded threshold the participants should assess which method is more appropriate to capture surface features and which limitations they observed.
3
Result
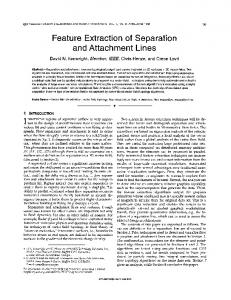
In Figure 1 the three shaded surface models are shown. For each model the underlying rows represent the feature line representation with one of the four techniques. Thereby, the result of the best-choice for the given technique is rated by the participants. For the aneurysm model, participant #1 (P#1) observed that the generated lines by RV and SC are not sufficient to gain a 3d impression. For AR and PEL the resulting lines are reasonable but some lines are distracting. Finally, P#1 preferred the PEL method. P#2 and P#3 rated the result of the SC method as their favored technique. For RV, AR, and PEL P#2 stated that most of the generated lines are not meaningful or distracting but depicts parts of the bifurcation well. Additionally, P#3 mentioned that AR produces lines on small vessel parts which lead to the impression that the vessel is very wrinkly. The inner view of the trachea has two main features: the elongated structure and the bifurcation. P#1 stated that RV gives no satisfactory impression on the 3d structure. Apart from that, SC, AR, and PEL depict the elongated structures but fail to enhance the bifurcation. Although, PEL produces more unnecessary lines which are distracting, P#1 preferred the result of the PEL method. P#2 and P#3 preferred the SC method because it conveys the elongated structure as well as the tracheal cartilage. Furthermore, the resulting lines depict also the bifurcation appropriately. Both participants noted that they could not figured out the bifurcation when using the RV, AR, or PEL method. The liver model failed for the illustration since too many distracting lines are generated. This is probably due to the fact that the liver shape has few prominent surface features and the lines emphasize artifacts from image acquisition and surface generation instead of real anatomical features. Thus, without the shaded underlying model the participants were not able not recognize the model as a liver. From an illustrative point of view, P#1 chose the RV method as his favored. P#2 did not favored a particular technique and noted that it is necessary to rotate the model in order to gain an impression of the model. Finally, P#3 chose SC as the favored method but noticed that the differences between the feature line methods are not significant when using the liver model.
Qualitative Evaluation of Feature Lines on Anatomical Surfaces
4
Discussion
The results of our evaluation can be summarized in two conclusions. First, reasonable depictions of patient-specific surface models with current feature line methods are obtained only if the models exhibit a smooth and regularly tessel-
Fig. 1. Application of the four feature line techniques applied on: (a) a cerebral aneurysm, (b) an inner view of a trachea, and (c) a liver surface. The resulting images are obtained by best-choice adjustments of the domain experts. Favored results of the experts are depicted with corresponding borders. The dashed line border stands for the best-choice by P#1, e.g. (a) and PEL. The dashed points represent the choice by P#2, e.g. (a) and SC. The line border depicts the favored result by P#3, e.g. (b) and SC.
5
6
K. Lawonn, R. Gasteiger, B. Preim
lated surface. Due to the high order derivations of the methods they are sensitive in terms of surface noise and artifacts. Advanced smoothing and remeshing algorithms are necessary to reduce these artifacts but preserve important anatomical surface shape and features. Thereby, the user has to find a tradeoff between surface shape and plausible resulting feature lines. However, for some cases it seems that current feature line methods are not able to detect important features of the underlying model. Additional surface shading and exploring the model by interactively changing the camera are needed. Furthermore, the evaluation shows a subjective rating in terms of choosing a preferred method. It seems that the SC method tends to be the most expressive technique. The second conclusion considers the application of feature line visualizations. Since they are able to provide a sparse representation of the underlying model they can be used for contextaware medical illustrations in which the model should not be in the focus but serve as anatomical context.
References 1. Tietjen C, Isenberg T, Preim B. Illustrative Rendering-Techniken f¨ ur die medizinische Ausbildung und Therapieplanung. In: Bildverarbeitung f¨ ur die Medizin (BVM). Informatik aktuell. Springer; 2005. p. 282–286. 2. Ritter F, Hansen C, Preim B, Dicken V, Konrad-Verse O. Real-Time Illustration of Vascular Structures for Surgery. IEEE Transactions on Visualization. 2006;12:877– 884. 3. Isenberg T, Neumann P, Carpendale S, Sousa MC, Jorge JA. Non-photorealistic rendering in context: an observational study. In: Proceedings of the 4th international symposium on Non-photorealistic animation and rendering. ACM; 2006. p. 115–126. 4. Preim B, Tietjen C. Illustrative Rendering for Intervention Planning: Methods, Applications, Experiences. In: Workshop on Eurographics; 2006. 5. Nadernejad E, Sharifzadeh S, Hassanpour H. Edge Detection Techniques: Evaluations and Comparisons. Applied Mathematical Sciences. 2008;2(31):1507 – 1520. 6. Interrante V, Fuchs H, Pizer S. Enhancing Transparent Skin Surfaces with Ridge and Valley Lines. In: Proceedings of the 6th conference on Visualization; 1995. p. 52–. 7. DeCarlo D, Finkelstein A, Rusinkiewicz S, Santella A. Suggestive Contours for Conveying Shape. ACM Transactions on Graphics (Proc SIGGRAPH). 2003 Jul;22(3):848–855. 8. Tilke J, Fr´edo D, Edward A. Apparent ridges for line drawing. In: ACM SIGGRAPH 2007 papers. SIGGRAPH ’07. ACM; 2007. 9. Xie X, He Y, Tian F, Seah HS, Gu X, Qin H. An Effective Illustrative Visualization Framework Based on Photic Extremum Lines (PELs). IEEE Transactions on Visualization and Computer Graphics. 2007;13:1328–1335. 10. Bade R, Haase J, Preim B. Comparison of Fundamental Mesh Smoothing Algorithms for Medical Surface Models. In: Simulation und Visualisierung. SCS-Verlag; 2006. p. 289–304.