meaning that mobility was not considered in the simulations. Table 1: Connection Rates Multiplying factors. Connection rate (bits/s). Kcon rate. 1M. 100. 2M. 200.
Journal of Computer Science 7 (5): 600-604, 2011 ISSN 1549-3636 © 2011 Science Publications
Quality of Service Policy for IEEE 802.11 Networks with Service Rate Selection based on Fairness Index
Lia Toledo Moreira Mota, Alexandre de Assis Mota and Luis Fernando Fontolan 1 Exact, Environmental and Technological Sciences Center, Pontifical Catholic University of Campinas, Brazil Abstract: Problem statement: The IEEE802.11 standard states that all stations have the same probability of accessing the network, but does not consider important parameters such as transmission rates and signal-to-noise ratios. However, these networks present an anomaly that allows a station with a low transmission rate to use the communication channel for a long time. Approach: In this context, this study presents a Quality of Service (QoS) policy, based on the implementation of the IEEE802.11e standard, that aims to keep or find the most fair scenario for IEEE802.11 networks. Hence, an algorithm for determining a fairness index is proposed based on physical parameters such as connection rates, service types and necessary conditions for the communication service. Results: The results obtained using the NS2 simulation software show that the proposed QoS policy was able to improve the network throughput or, at least, to keep a condition similar to the original one, when the proposed policy was not applied. Conclusion: All simulated scenarios presented a network performance gain or, at least, a similar result when compared to the results obtained when the IEEE802.11 standard was applied. Key words: Fairness index, Quality of Service (QoS), Wireless Local Area Networks (WLANs), communication channel, transmission rates, connection rates, Medium Access Control (MAC), Contention Window (CW), fair scenario, Signal-To-Noise Ratio (SNR) STA has the same probability of accessing the network, independently of its transmission rate and its Signal-ToNoise Ratio (SNR) (Prasad and Prasad, 2005; Mota et al., 2010). This assumption promotes the appearance of an anomaly, characterized Heusse et al. (2003), that allows a STA with a low transmission rate to occupy the communication channel for a long time period, to the prejudice of other STAs with higher transmission rates. In order to make IEEE802.11 networks adequate for multimedia contents, the IEEE 802.11e standard was created (Prasad and Prasad, 2005; Adibi et al., 2010). This standard uses the concept of Quality Of Service (QoS) (Adibi et al., 2010, Yin et al., 2010), through the classification of different traffic types. Each traffic type has a different priority and hence, different opportunities to access the network. However, this classification does not take into account the SNR of each STA. Hence when the Medium Access Control (MAC) layer of the IEEE802.11e standard priories a STA with a low transmission rate (because of the type of its content), it can jeopardize the access of other STAs with better transmission capacities and better
INTRODUCTION With the technological advances and the popularization of wireless equipment, wireless networks became a viable alternative from the economical point of view. Consequently, more and more Wireless Local Area Networks (WLANs) are available, including public and private networks, for residential and corporative usage (Adibi et al., 2010; Al-Alawi, 2006). Hence, the IEEE802.11 WLANs, firstly used for “Best-Effort” type traffic mainly, now need to manage real time audio and video applications. So, it is of fundamental importance to find solutions that allow these networks to become more reliable and able to adequately manage multimedia traffic (Singh et al., 2007; Adibi et al., 2010). The IEEE802.11 networks were originally implemented considering equal conditions for all stations (STAs) to access the communication channel, assured through the usage of the Distributed Coordination Function (DCF) method (Prasad and Prasad, 2005; Singh and Sohi, 2008). This implementation is based on the hypothesis that each
Corresponding Author: Alexandre de Assis Mota, Exact, Environmental and Technological Sciences Center, Pontifical Catholic University of Campinas, Brazil Tel: +55- 19-37567370
600
J. Computer Sci., 7 (5): 600-604, 2011 SNRs, but with contents of lower priority. Consequently, a second anomaly is created (Branquinho et al., 2006), which can be understood as a priorization of the first anomaly of IEEE802.11 networks. In this context, this study proposes a QoS policy based on the IEEE802.11e standard implementation, aiming to optimize the usage of wireless networks resources. This policy considers that through the assessment of the STAs parameters (connection rates, service types and necessary conditions for service implementation), the MAC layer is able to interact with each STA, changing its rates and/or limiting its access in order to promote a more efficient usage of network resources.
methodology is based on the same one applied for IEEE802.11e networks (which considers only the priority of services) but it also takes into account the physical characteristics of each STA (represented by the mentioned factors). The multiplying factors adopted in this study are defined in Table 1-3.
MATERIALS AND METHODS Fairness definition: In a distributed system, the network resources must be shared among all devices that compose the system. The way by which these resources are distributed has a direct impact on each device performance and also on the system performance. So, these resources shall be distributed as fairly as possible. According to (Adibi et al., 2010), fairness does not mean, necessarily, equal resources distribution. There are some situations that require that some consumers receive more resources than others. In this study, the fairness concept is defined through the evaluation of a numerical index. A configuration or a scenario is more fair than other if its corresponding fairness index is higher. Hence, it is possible to define and identify the most fair scenario for a specific network, by comparing the obtained indexes for each possible system configuration. Fairness index evaluation: In this study, the fairness policy is based on the fact that it is possible to use the total available network resources in a more efficient way, without altering the services priority at the STAs. This policy is founded on the evaluation of a fairness index, considering three factors: the connection rate between the STA and the Access Point (AP), the service type and the service rate. The fairness index (Jindex) is defined by (1): N
Jindex = ∑ ( K conRate )i .( K servType ) .( K servRate )i i =1
i
(1)
where (KconRate)i, (KservType)i and (KservRate) i correspond, respectively, to multiplying factors for the connection rate, the service type and the service rate and N is the total number of STAs in the network. This
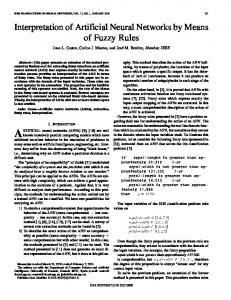
Fig. 1: Flowchart of the fairness index calculation algorithm using SRLM method 601
J. Computer Sci., 7 (5): 600-604, 2011 During the fairness index evaluation, the AP starts a repetition cycle, using the connection/service rate values yielded by the STAs and tests the feasibility of each combination of service rate, service type and connection rate, verifying if the combinations are physically possible. In order to achieve this goal, it determines the time period that each STA needs to access the channel to have its service rate fulfilled. Then, the AP determines the sum of the service rates for all STAs in the network. If this sum is bigger than 100%, the combination is taken as invalid because it is not feasible. If this sum is smaller than 100%, the fairness index for the combination can be evaluated. However, it is important to emphasize that the method evaluates the fairness index for all combinations, adjusting the STAs service rates when these values are higher than the STAs connection rates. According to what happens in real connections, when a STA requires a service rate higher than the connection rate, the fairness index is evaluated considering the service rate value and not the connection rate value. So, instead of discarding a combination that is physically unfeasible, this method, called Service Rates Limiting Method (SRLM), uses an approximation to evaluate the fairness index possible value. The flowchart of the proposed algorithm is presented in Fig. 1. Priority access in the simulated cases is granted by modifying the Contention Window (CW) parameter (Balador et al., 2010) defined in the Distributed Coordination Function in the IEEE 802.11 Medium Access Control layer definition.
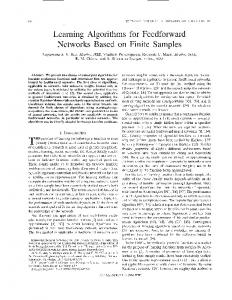
Fig. 2: Network simulated in case I
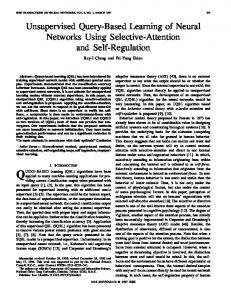
Fig. 3: Policy performance for scenario A, representing the base case (1) and the best case (10)
RESULTS The tests were carried out using a script specially developed for the NS2 (Network Simulator) software, permitting to simulate test cases with various STAs and APs. Each STA was configured as a static station, meaning that mobility was not considered in the simulations. Table 1: Connection Rates Multiplying factors Connection rate (bits/s) 1M 2M 5,5M 11M Table 2: Service Type Multiplying factors Service type Background Best effort Video Voice
Fig. 4: Policy performance for scenario B, representing the base case (1) and the best case (19)
Kcon rate 100 200 300 400
Kserv type 100 200 300 400
Fig. 5: Policy performance for scenario C, representing the base case (1) and the best case (49) 602
J. Computer Sci., 7 (5): 600-604, 2011 Table 3: Service Rates Multiplying factors Service rate (bits/s) Kserv rate 64k 1 128k 3 250k 5 256k 6
Service rate (bits/s) 500k 512k 700k 750k
Kserv rate 10 11 12 13
Service rate (bits/s) 1M 2M 5,5M 11M
Kserv rate 14 15 16 17
Table 4: Parameters for the simulation case A-1 AP and 3 STAs ST1 Connection rate: 1Mbps Service type: Best effort Possible service: 1Mbps Rates: 500kbps
ST2 11Mbps Video 700kbps 250kbps
ST3 5,5Mbps Voice 258kbps 64kbps
Table5: Parameters for the simulation case B-1 AP and 3 STAs STA 1 Connection rate: 1Mbps Service type: Best_Effort Possible service rates: 11Mbps 5,5Mbps 1Mbps
STA2 5,5Mbps Video 2Mbps 1Mbps 512kbps
STA3 11Mbps Voice 512kbps 256kbps 128kbps
Table 6: Parameters for the simulation case C-1 AP and 6 STAs Stations: STA 1 STA 2 Connection rate: 5,5Mbps 2Mbps Service type: Best_Effort Video Possible service rates: 1Mbps 750kbps 750kbps 500kbps 500kbps 250kbps
STA3 1Mbps Voice 256kbps 128kbps 64kbps
Consequently, each simulation corresponds to a static state of a wireless network, regarding the system topology. Stations were configured allowing changes in their connection rates. The standard simulation network was defined as a 3-stations network, with one AP, as shown in Fig. 2. Three different test cases were created, named A, B and C, with the rates and services described in Table 4-6 and the fairness index was evaluated for each possible combination of service parameters and connection rates in all cases. The third case (case C) was simulated in a network with 6 STAs and 1 AP. Test cases A-B have 27 possible combinations of AP service parameters and connection rates, while test case C presents 324 possibilities. For each case, it was possible to determine the most fair network configuration, by selecting the combination that resulted on the higher fairness index. It was also possible to verify the performance of the proposed policy, by comparing the results obtained when the policy was applied, with the results obtained when the IEEE802.1 standard was applied (represented by the combination number 1 and named “base case”). Figures 2-4 illustrate the performance of the proposed policy for cases 1-3 respectively.
STA 4 11Mbps Best_Effort 11Mbps 5,5kbps 1Mbps
STA 5 5,5Mbps Video 2Mbps 1Mbps 512kbps
STA 6 11Mbps Voice 512kbps 256kbps 128kbps
DISCUSSION From Figure 2 (test case A), one can observe that the most fair combination (combination number 10) presented an important gain when compared to the base case. The average rate of STA1 presented an improvement of approximately 30% (from 6127279764 bytes/s). For STA2, this rate didn’t change and for STA3 there was an improvement of approximately 70% (from 19228 bytes/s to 32752 bytes/s). When considering the average of the sum of the rates of all STAs, there was an increase of 18% in the network total throughput. From Fig. 3 (test case B), one can observe that the most fair combination (combination number 19) presented a gain when compared to the base case. The average rate of STA1 remained almost the same (gain of approximately 0,39%). A similar result was found for STA3 (gain of approximately 0,42%). The best result was obtained for STA2, with an improvement of 1,55% in its rate (from 166152 bytes/s to 168728 bytes/s). When considering the average of the sum of the rates of all STAs, there was an increase of approximately 1% in the network total throughput. From Fig. 4 (test case C), it is possible to observe that the most fair combination (combination number 49) presented a very significantly gain when compared to the base case. The average rate of 1, 2 and STA5 603
J. Computer Sci., 7 (5): 600-604, 2011 presented an improvement of approximately 4200% (from 92-3956 bytes/s), 1269% (from 4140- 56672 bytes/s) and 3813% (from 1380-54004 bytes/s), respectively. STA6 also presented a gain – in this case approximately 76% (from 36892-65228 bytes/s). On the other hand, the average rate of STA3 was reduced from 29348-16376 bytes/s (a reduction of approximately 42%). When considering the average of the sum of the rates of all STAs, there was an increase of approximately 182% in the network total throughput. In test case C, one can note that combination 49 yields better results by reducing service rates in service types that have lower priority levels (STA4) and minimizing the anomaly effects by leveling rates of higher priority services (as STA3 and STA5) with other stations in the network, maintaining acceptable quality of service. None of the tested cases presented network throughput deterioration.
REFERENCES Adibi, S., R. Jain, S. Parekh and M. Tofighbakhsh, 2010. Quality of Service Architectures for Wireless Networks: Performance Metrics and Management. 1st Edn., IGI Global snippet, USA., ISBN-10: 1615206809, pp: 691. Al-Alawi, A.I., 2006. WiFi technology: Future market challenges and opportunities. J. Comput. Sci., 2: 13-18. DOI: 10.3844/jcssp.2006.13.18 Balador, A., A. Movaghar and S. Jabbehdari, 2010. History based contention window control in IEEE 802.11 MAC protocol in error prone channel. J. Comput. Sci., 6: 205-209. DOI: 10.3844/jcssp.2010.205.209 Branquinho, O.C. and N. Reggiani and D.M. Ferreira, 2006. Mitigating 802.11 MAC anomaly using SNR to control backoff contention window. Proceedings of the International Conference on Wireless and Mobile Communications, July 29-31, IEEE Xplore, Bucharest, pp: 55-55. DOI: 10.1109/ICWMC.2006.61 Heusse, M., F. Rousseau, G. Berger-Sabbatel and A. Duda, 2003. Performance Anomaly of 802.11b. Proceedings of the 22nd Annual Joint Conference of the IEEE Computer and Communications, Mar. 30-3 Apr., IEEE Xplore, France, pp: 836-843. DOI: 10.1109/INFCOM.2003.1208921 Mota, L., A. Mota and R. Rondon, 2010. Analysis of indoor signal attenuation in wireless networks using fuzzy logic. Int. J. Comput. Sci. Network Sec., 10: 78-85. Prasad, A. and N. Prasad, 2005. 802.11 WLANs and IP Networking: security, QoS, and Mobility. 1st Edn., Artech House, London, ISBN-10: 1580537898, pp: 318. Singh, G. and B.S. Sohi, 2008. Experimental evaluation of medium access schemes in 802.11 wireless networks. J. Comput. Sci., 4: 888-896. DOI: 10.3844/jcssp.2008.888.896 Singh, G., A.P.S. Atwal and B.S. Sohis, 2007. Mobility management technique for real time traffic in 802.11 networks. J. Comput. Sci., 3: 390-398. DOI: 10.3844/jcssp.2007.390.398 Yin, K., B. Zhou, S. Zhang, H. Jiang and J. Cristoforo, 2010. Optimizing services composition in multi-
CONCLUSION This study presented a QoS policy based on the IEEE802.11e standard. The proposed algorithm was implemented and programmed using a microcontroller development board, attesting that the methodology can be used in a real context. Tests and simulations were carried out and the obtained results show a significant improvement on the network performance, since the method was able to determine the fairness index for all possible parameters combinations and consequently, was able to find the most fair scenario for the network. It is important to emphasize that the evaluation of the fairness index takes into account values of parameters that are, in fact, an estimation of their real value, based on the STAs requisitions in the moment the stations are disputing the communication channel. This means that the algorithm does not consider the real parameters of the STAs, since these values come from the application of the proposed policy itself. So, it is possible, in some situations, the policy to take a scenario as the “most fair” when, in fact, there are other situations that could present a higher fairness index. Despite this fact, all simulated scenarios presented a network performance gain or, at least, a similar result when compared to the results obtained when the IEEE802.11 standard was applied.
network environment. Inform. Technol. J., 9: 399-411.
604