Microchemical Journal 137 (2018) 204–207
Contents lists available at ScienceDirect
Microchemical Journal journal homepage: www.elsevier.com/locate/microc
Quantification of paramagnetic ions in solution using time domain NMR. PROS and CONS to optical emission spectrometry method Flávio V.C. Kock a, Maiara P. Machado b, Geisamanda P.B. Athayde b, Luiz A. Colnago c, Lúcio L. Barbosa d,⁎ a
Instituto de Química de São Carlos, Universidade de São Paulo, Avenida Trabalhador São Carlense 400, 13566-590, São Carlos, São Paulo, Brazil Laboratório de Pesquisa e Desenvolvimento de Metodologia para Análises de petróleo-LabPetro. Universidade Federal do Espírito Santo, Av. Fernando Ferrari, 514, CEP 29075-910 Goiabeiras, Vitória – ES, Brazil c Embrapa Instrumentação, Rua XV de Novembro 1452, 13560-970 São Carlos, São Paulo, Brazil d Universidade Federal de São Paulo, Rua Carvalho de Mendonça 144, 11070-010 Santos, São Paulo, Brazil b
a r t i c l e
i n f o
Article history: Received 9 September 2017 Received in revised form 18 October 2017 Accepted 19 October 2017 Available online 22 October 2017 Keywords: Low field NMR ICP-OES Paramagnetic ions
a b s t r a c t Solutions containing paramagnetic ions (PMIs) have been widely used in several industrial and agricultural applications. Although the concentrations of these ions in solutions are very important, they are rarely checked due to the high cost of the measurements. In this paper, we demonstrate the viability of 2 MHz time-domain nuclear magnetic resonance (TD-NMR) relaxometer to quantify PMIs in solution. The method was used to quantify the concentration of Co2+, Cr3+, Cu2+, Fe3+ and Mn2+ and is based on linear correlation between the transverse relaxation rate (T−1 2 ) of the hydrogens of water and PMIs concentration. The method was validated using inductively coupled plasma optical emission spectrometry (ICP-OES), which is the standard method for quantitative elemental analyses. The concentration of PMIs were analyzed between 0.5 and 10 mg·L−1, with r2 ≥ 0.99 between the two methods. Although the limits of detection (LOD) and quantification (LOQ) of TD-NMR are several orders of magnitude higher than those of ICP-OES, they are in the range of concentration normally found in commercial applications. Therefore, this work demonstrate that TD-NMR can be an affordable alternative for certificate the concentration of PMIs concentration in small laboratory in industrial or agricultural facilities. © 2017 Elsevier B.V. All rights reserved.
1. Introduction Solutions containing paramagnetic ions (PMIs) have been widely used in several researches and industrial applications such as electroplating [1,2], tannery [3] and agriculture, specifically, in hydroponics [4] and foliar fertilization [5]. Although, the concentrations of these ions are very important in these areas, they are rarely checked due to the time consuming and laborious procedure of the traditional wet chemical methods or the high cost of emission/absorption spectroscopic standard approaches. In some cases, only the total ionic concentrations are monitored using electrical conductivity [4]. In this paper, we are demonstrating that time-domain nuclear magnetic resonance (TD-NMR) relaxometry can be a simple, rapid, precise and non-destructive method to quantify PMIs in solution [6]. The TDNMR relaxometry can also be applied direct in the storage flash [7] reducing the possibility of contamination and does not need specialized operator [8,9]. The relaxometry analysis is based on linear correlation between the concentration of the PMIs and the longitudinal (1/T1) and transverse relaxation rates (T−1 2 ) of the hydrogens present on the solvent. In 1946, ⁎ Corresponding author. E-mail address:
[email protected] (L.L. Barbosa).
https://doi.org/10.1016/j.microc.2017.10.013 0026-265X/© 2017 Elsevier B.V. All rights reserved.
Bloch, Hansen and Packard observed this phenomenon for the first time using an aqueous solution of Fe3 +. In 1948, Bloomberg, Purcell and Pound explained that the increase on the solvent relaxation rates in presence of PMIs is a function of the hydrogen gyromagnetic ratio (γp), effective magnetic moment (μef), number of the ions by volume unity (Nion), viscosity (η), Boltzmann constant (κ) the and temperature (T) in Kelvins according to Eq. (1).
1 ¼ T1
12πγ 2p μ 2ef N Â η Uon
5kT
ð1Þ
Nothnagel and Weiss in 1970 show the first use of T1 relaxation time, measured with inversion-recovery (IR) pulse sequence, to quantify PMIs in solution using the Eq. (1). Schluter & Weiss in 1970 decade shows the application of the same method to measure T1 in redox and complexometric titration and in the indirect determination of PMIs speare depencies trough precipitation [10–13]. They also show that T−1 2 dent on Eq. (1) and can be used to measure the concentration of PMIs in solution, but they did not use it due to instrumental limitations at that time. Nowadays, Carr-Purcell-Meiboom-Gill (CPMG) pulse sequence, widely in relaxometric measurements, is a standard sequence
F.V.C. Kock et al. / Microchemical Journal 137 (2018) 204–207
205
Fig. 1. Normalized CPMG decay curves of the pure water and aqueous nitric acid (0.02%) solution (a) and five nitric acid aqueous solutions of Co2+ from 0.5 and 10 mg·L−1(b).
in low field NMR spectrometers and much faster that IR method [6,14– 16]. T2 relaxometry have been used by Nunes et al. 2012 [6], Gomes et al., in 2014 [15] and Gomes et al., 2015 [16] to in situ quantify Cu2+ in aqueous solution during an electrodeposition reaction. Cobra et al., 2015 use the T2 relaxometry to determine the concentration of PMIs in aqueous solution in function of pH to determine the solubility product constant (Ksp) of the hydroxides ions [14]. Kock & Colnago in 2015 studied the T1 and T2 relaxometry properties of EDTA-paramagnetic ions chelates in solution, in function of pH using a rapid method that measure both relaxation times in a single shot pulses sequence, named CWFP [17]. Gomes et al., in 2016 compared the quantification of PMIs determined by relaxometry with Atomic Absorption Spectroscopy (AAS) data found in literature [18]. Kock et al., 2017 study the complexation of PMIs with chitosan in function of pH using both T1 and T2 relaxometry measured with CWFPx-x sequence [19]. All the above experiments were performed in 0.23 (9 MHz) or 0.47 T (19.9 MHz) bench top spectrometers. In this paper, we are demonstrating that TD-NMR relaxometry in very low magnetic field 0.05 T (2 MHz for 1H) is a simple, fast, low cost and precise method to quantify paramagnetic ions in aqueous solution. The method was checked using Inductively Coupled Plasma Optical Emission spectrometry ICP-OES that is standard method for quantitative elemental analyses.
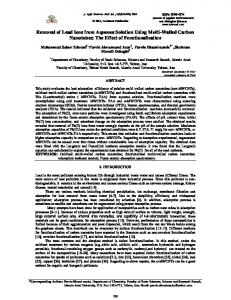
Fig. 2. Variation of transverse relaxation rate (T−1 2 ) of the water versus the concentration of Co2+, Cr3+, Cu+2, Fe3+ and Mn2+ in the solutions.
2. Experimental The HNO3 P.A. (Vetec) used for dilution of samples was previously distilled in a Subboiling Destillacid BSB-939-IR Berghof. The solutions were prepared in the concentration range from 0.5 to 10 mg·L− 1 using ultrapure water with resistivity of 18 MΩ·cm at 25 °C and standard solutions of Mn2+, Cr3+, Fe3+ and Cu2+ (SpecSol®). For Co2+ solution, a salt of CoCl2·6H2O (Vetec) was solubilized in HNO3 0.2% v/v. Finally, dilute nitric acid was used as “blank” solution in the experiments.
2.1. NMR analyses The T2 measurements were performed in a MARAN Ultra-2 equipment, Oxford Instruments Molecular Biotools Ltd., equipped with a magnet of 0.052 T, equivalent to 1H resonance frequency of 2.2 MHz and a 51 mm probe. Three samples (triplicates) of 25 mL of each solution were transferred to the glass sample holder (50 mm diameter and 180 mm height) and left in the probe for about 5 min to stabilize the temperature of 27 ± 1 °C. The T2 values were obtained employing the CPMG pulse sequence, using 90° and 180° pulses of 8.3 and 16.6 μs, respectively, number of echoes equal to 32 K, echo time of 200 μs and eight scans. The recycle time was 12 s that is more than five times the longest T1 that was 1.5 s.
Fig. 3. Correlation between transverse relaxation rates (T−1 2 ) obtained from TD-NMR relaxometry versus optical emission intensity obtained from ICP-OES: (a) Co2+, Cr3+, Fe3+ Cu2+ and Mn2+.
206
F.V.C. Kock et al. / Microchemical Journal 137 (2018) 204–207
Table 1 Comparison of analytical figures of merits (LOD and LOQ) obtained by TD-NMR and ICPOES and the determination coefficients obtained from the validation curve constructed from the relaxation rate and emission intensity data. LOD (mg·L−1)
Co2+ Cr3+ Cu2+ Fe3+ Mn2+
LOQ (mg·L−1)
R2
TD-NMR
ICP-OES
TD-NMR
ICP-OES
0.32 0.13 1.14 0.10 0.11
0.000024 0.00035 0.00020 0.00044 0.00032
1.08 0.43 3.79 0.34 0.37
0.000078 0.0012 0.00067 0.0014 0.0011
0.9996 0.9999 0.9872 0.9989 0.9996
The T2 values were obtained by fitting the CPMG decay with exponential function, using WinFit software (oxford). 2.2. ICP-OES analyses The Inductively Coupled Plasma Optical Emission Spectrometric (ICP-OES) analyses were performed in an Optima 7000 DV spectrometer (PerkinElmer) with dual view (axial/radial), equipped with optics Echelle and RF solid state generator (40 MHz). The concentrations of all PMIs were determined in triplicates. The emission lines at 228.616 nm for Co (I); 327.393 nm for Cu (I); 257.610 nm for Mn (II), 267.716 nm for Cr (II) and 259.939 nm for Fe (II) were used to quantify the respective PMIs in solution. The symbols (I) and (II) indicate atomic and ionic lines respectively. The instrumental parameters used in the analyses were: plasma power of 1300 W, plasma gas flow rate of 15 L·min− 1, auxiliary gas flow rate of 0.2 L·min−1, nebulization gas flow rate of 0.8 mL·min−1, nitrogen purge (2.5 mL·min−1), nebulizer model Munhard and a cyclonic nebulization chamber. 3. Results and discussion Fig. 1 shows the CPMG decay of the pure water and aqueous nitric acid (0.02%) solution (a) and the decays of the five nitric acid aqueous solutions of Co2 + from 0.5 and 10 mg·L− 1 (b) at 0.05 T (2 MHz for 1 H). The CPMG decays of the solutions containing, Cr3+, Fe3 +, Mn2+ and Cu2 + ions are shown in the supplementary material. The signals to noise ratio (SNR) of these signals are not very high as measured in higher field (0.2 to 0.5 T) but it does not interfere in the monoexponential fitting use to measure T2. If necessary the SNR can be improved by data compression [19]. Fig. 1a shows that the water and nitric acid solution has similar T2, approximately 2.77 s. Fig. 1b shows the strong effect of Co2+ concentration in the water relaxation times. The T2 values in this figure range from 2.2 to 0.61 s, for the 0.5 and 10 mg·L−1 solutions. This T2 reduction is associated to dipolar interaction between the magnetic moments of
unpaired electrons from paramagnetic ions and the magnetic moments present on the 1H water nuclei. The relaxation times for the others PMIs for the 0.5 and 10 mg·L−1 solutions varies from 2.12 and 0.40 s for Cr3+, 1.67 to 0.21 s for Fe3+, from 1.49 to 0.12 s for Mn2+ and from 2.77 to 1.55 s for Cu2+. These differences in relaxivity are direct related to the difference in the magnetic moment (μ) of each ion. The μ for μCu2+(2, 0) Cu2+(2,0)b μCr3+(3.8)b μCo2+(5.0) b μFe3+(5.0)b μMn2+(5.9) [20,21]. Fig. 2 show the linear correlation between transverse relaxation rate (T−1 2 ) with the concentration of PMIs. The variation ranges obtained for −1 for Co2+, 0.47 and 2.51 s−1 for Cr3+, 0.36 to (T−1 2 ) were 0.45 to 1.63 s −1 2+ 0.64 s for Cu , 0.59 to 4.67 s−1 for Fe3+ and 0.67 and 8.05 s−1 for Mn2 +. This range values and the difference in the slopes (relaxivity) for each ion experimentally demonstrate the effect of the magnetic moment on the relaxation of 1H of the solvent. The results of Fig. 2 shows that the method can be used to determine the concentration of these ions in solution. However, to certify the solutions concentrations, the same samples were analyzed by ICP-OES. The correlation curves between (T−1 2 ) and the optical emission intensity in counts per seconds rate (cps−1) is shown in Fig. 3. These curves show r2 N 0.99 indicating a high linear correlation between the two methods. As observed in Fig. 2, the slope of the Cu2+ in Fig. 3 shows the smallest slope due to its lower relaxivity. The figures of merit, limit of detection (LOD) and limit of quantification (LOQ) of TD-NMR relaxometry and ICP-OES are shown in Table 1. The NMR measurements were obtaining by measuring ten times the relaxation of 0.5 mg·L−1 solutions and for ICP-OES ten measurements of the blank solution. The results of Table 1 show, as expected, that TDNMR is several orders of magnitude less sensible than ICP-OES. However, the NMR relaxometry technique is suitable for estimating the concentration of PMIs in industrial or agriculture applications. Due to the low relaxivity, the LOD and LOQ of Cu2+ measured by TD-NMR have the higher values or less sensibility. Cu2+ has also the lowest determination correlation with ICP-OES measurements. TD-NMR relaxometry can also be used to check the total content of PMIs or to monitor the precipitation of PMIs as function of pH (Fig. 4a). This figure shows that in strong acidic mediums (pH lower than 2.5), the constant T2 values are lower than ≤100 ms. This result leads to infer that all five PMIs are fully protonated and solubilized in solution and its paramagnetic relaxation contribution is maxima. As the pH increased there is at approximately pH 3 a small increase of T2 that can be related to the precipitation of Fe(OH)3, with a turning point at pH 3.5 [14]. Between pH 4 to 6.5 and from 6.5 to 7.5 T2 increases again due the precipitation of Cr(OH)2, with a turning point at pH 6.5 for this hydroxides and pH 7 for precipitation of Cu(OH)2. The pH shows a rapid increase in the range between 7.5 and 10 that can be related to precipitation of Co(OH)2 and Mn(OH)2 with turning points at pH 8.7 and 9, respectively. From pH 9.5 to 12, the T2 did not varies and is
Fig. 4. a) Variation of T2 of the water of a mixture of Co2+, Cr3+, Cu+2, Fe3+ and Mn2+ versus pH. b) Variation of T2 of the water in a Co2+ solution versus pH.
F.V.C. Kock et al. / Microchemical Journal 137 (2018) 204–207
close to the pH of “pure water” (in this case, the term in quotes is used to refer the alkaline water in the supernatant), indicating that all PMIs were precipitates and are not interfering in the relaxation times. However, for pH N 12 the relaxation times decreases. This decay has been assigned to the presence Co2+ that shows similar behavior when this ion analyzed in solution in this pH range (Fig. 4b). This decay of T2 at pH N 11 indicated an alkaline hydrolysis of Co(OH)2 producing a soluble form of Co2+ ions. From the result of Fig. 4 it is possible to infer that the TD-NMR relaxometry can also been used to monitor the different PMIs (speciation) that is important in commercial solutions. 4. Conclusions Given the results, it is possible to conclude that TD-NMR relaxometry even at very low filed (0.05 T) can be used to quantify the concentration for PMIs in solution, from 0.5 to 10 mg·L−1. Consequently, this spectroscopy can be a simple, rapid and non-destructive method for certifies the concentration of PMI in several trades where this simple method is necessary. Besides, a new generation of small portable Halbach and unilateral magnets [22–24] and NMR spectrometer– on-a-chip [25] can significantly reduce the instrumentation costs. In addition, the development of new pulse sequences that leads the simultaneous estimative for T1 and T2 in a single and fast measurement, can reduce the experimental time and improve the information about the system [26–27]. Therefore, TD-NMR has the potential to be a popular method for measuring PMIs in solution due to its simplicity, speed and no cost with chemicals for the analyses, similarly to high field NMR spectroscopy that already is used to quantify simultaneously several compounds [28]. Acknowledgements The authors thank CAPES and FAPESP grants 2012/23169-8 and 2017/12864-0 and CNPq grant 303837/2013-6 for financial support. Appendix A. Supplementary data Supplementary data to this article can be found online at https://doi. org/10.1016/j.microc.2017.10.013. References [1] M.R.H. de Almeida, E.P. Barbano, M.F. de Carvalho, I.A. Carlos, J.L.P. Siqueira, L.L. Barbosa, Electrodeposition of copper–zinc from an alkaline bath based on EDTA, Surf. Coat. Technol. 206 (2011) 95–102. [2] I.H. Karahan, R. Ozdemir, Effect of Cu concentration on the formation of Cu1 − x -Znx shape memory alloy thin films, Appl. Surf. Sci. 318 (2014) 100–104. [3] M.A. Hashem, M.S. Nur-A-Tomal, M.A. Mondal, Rahman, Hair burning and liming in tanneries is a source of pollution by arsenic, lead, zinc, manganese and iron, Environ. Chem. Lett. 15 (2017) 501–506. [4] M. Wu, C. Kubota, Effects of high electrical conductivity of nutrient solution and its application timing on lycopene, chlorophyll and sugar concentrations of hydroponic tomatoes during ripening, Sci. Hortic. 116 (2008) 122–129. [5] D.L. Ojeda-Barrios, E. Sanchez-Chavez, J.P. Sida-Arreola, R. Valdez-Cepeda, M. Balandran-Valladares, The impact of foliar nickel fertilization on urease activity in pecan trees, J. Soil Sci. Plant Nutr. 16 (2016) 237–247.
207
[6] L.M.S. Nunes, P.F. Cobra, L.F. Cabeça, L.L. Barbosa, L.A. Colnago, In situ quantification of Cu(II) during an electrodeposition reaction using time-domain NMR relaxometry, Anal. Chem. 84 (2012) 6351–6354. [7] L.F. Cabeça, L.V. Marconcini, G.P. Mambrini, R.B.V. Azeredo, L.A. Colnago, Monitoring the transesterification reaction used in biodiesel production, with a low cost unilateral nuclear magnetic resonance sensor, Energy Fuel 25 (2011) 2696–2701. [8] L.A. Colnago, R.B.V. Azeredo, A.M. Netto, F.D. Andrade, T. Venancio, Rapid analyses of oil and fat content in agri-food products using continuous wave free precession time domain NMR, Magn. Reson. Chem. 49 (2011) S113–S120. [9] L.A. Colnago, T.B. Moraes, T. Monaretto, F.D. Andrade, Rapid determination of food quality using steady state free precession sequences in TD-NMR spectroscopy, in: F. Capozzi, L. Laghi, P.S. Belton (Eds.),Magnetic Resonance in Food Science: Defining Food by Magnetic Resonance, Royal Society of Chemistry Special Publications 2015, pp. 1–16. [10] K.H. Nothnagel, A. Weiss, Nuclear magnetic relaxation analysis. An application of relaxation time measurements in analytical chemistry, Ber. Bunsenges. Phys. Chem. 74 (1970) 609–732. [11] A. Schluter, A. Weiss, Nuclear magnetic resonance relaxation titration, Fresenius' Z. Anal. Chem. 266 (1973) 177–186. [12] A. Schlüter, A. Weiss, Nuclear magnetic relaxation titration of Cu2+, Ni2+, Mn2+, Zn2+, and Fe3+ with 1,10-phenanthroline hydrochloride in the presence of thiocyanate, Anal. Chim. Acta 97 (1978) 93–110. [13] A. Schlüter, A. Weiss, Nuclear magnetic relaxation rate as indicator in complexometric titrations, Anal. Chim. Acta 99 (1978) 157–166. [14] P.F. Cobra, B.F. Gomes, C.I.N. Mitre, L.L. Barbosa, L.V. Marconcini, L.A. Colnago, Measuring the solubility product constant of paramagnetic cations using time-domain nuclear magnetic resonance relaxometry, Microchem. J. 121 (2015) 14–17. [15] B.F. Gomes, L.M.S. Nunes, C.M.S. Lobo, L.F. Cabeça, L.A. Colnago, In situ study of the magnetoelectrolysis phenomenon during copper electrodeposition using time domain NMR relaxometry, Anal. Chem. 86 (2014) 9391–9393. [16] B.F. Gomes, L.M.S. Nunes, C.M.S. Lobo, A.S. Carvalho, L.F. Cabeça, L.A. Colnago, In situ analysis of copper electrodeposition reaction using unilateral NMR sensor, J. Magn. Reson. 261 (2015) 83–86. [17] F.V.C. Kock, L.A. Colnago, Rapid and simultaneous relaxometric methods to study paramagnetic ion complexes in solution: an alternative to spectrophotometry, Microchem. J. 122 (2015) 144–148. [18] B.F. Gomes, J.S.D.S. Burato, C.M.S. Lobo, L.A. Colnago, Use of the relaxometry technique for quantification of paramagnetic ions in aqueous solutions and a comparison with other analytical methods, Int, J. Anal. Chem. 2016 (2016) https://doi.org/ 10.1155/2016/8256437. [19] J. Mitchel, E.J. Fordham, Emulation of petroleum well-logging D T2 correlations on a standard benchtop spectrometer, J. Magn. Reson. 212 (2011) 394–401. [20] F.V.C. Kock, T. Monaretto, L.A. Colnago, Time-domain NMR relaxometry as an alternative method for analysis of chitosan-paramagnetic ion interactions in solution, Int. J. Biol. Macromol. 98 (2017) 228–232. [21] R.L. Conger, P.W. Selwood, Proton relaxation in paramagnetic solutions, J. Chem. Phys. 20 (1952) 383–387. [22] L.A. Colnago, F.D. Andrade, A.A. Souza, R.B.V. Azeredo, A.A. Lima, L.M. Cerioni, T.M. Osán, D.J. Pusiol, Why is inline NMR rarely used as industrial sensor? Challenges and opportunities, Chem. Eng. Technol. 37 (2014) 191–203. [23] B. Blumich, S. Haber-Pohlmeier, W. Zia, Compact NMR, 1st edition Walter de Gruyter GmbH, Berlin/Boston, 2014. [24] K. Meyer, S. Kern, N. Zientek, G. Guthausen, M. Maiwald, Process control with compact NMR, Trends Anal. Chem. 83 (2016) 39–52. [25] D. Ha, J. Paulsen, N. Sun, Y.Q. Song, D. Ham, Scalable NMR spectroscopy with semiconductor chips, PNAS 111 (2014) 11955–11960. [26] T. Monaretto, F.D. Andrade, T.B. Moraes, A.A. Souza, E.R. de Azevedo, L.A. Colnago, On resonance phase alternated CWFP sequences for rapid and simultaneous measurement of relaxation times, J. Magn. Reson. 259 (2015) 174–178. [27] T.B. Moraes, T. Monaretto, L.A. Colnago, Rapid and simple determination of T1 relaxation times in time-domain NMR by Continuous Wave Free Precession sequence, J. Magn. Reson. 270 (2016) 1–6. [28] Y. Lian, H. Jiang, J. Feng, X. Wang, X. Hou, P. Deng, Direct and simultaneous quantification of ATP, ADP and AMP by (1)H and (31)P Nuclear Magnetic Resonance spectroscopy, Talanta 150 (2016) 485–492.