is a weighting factor, S is the average slope gradient (after Borselli et al., 2008) ... the full channel network (based
Technical Report
Quantifying the effectiveness of gully remediation on off-site water quality: Preliminary results from demonstration sites in the Burdekin catchment (second wet season)
Rebecca Bartley, Aaron Hawdon, Anne Henderson, Scott Wilkinson, Nick Goodwin, Brett Abbott, Brett Baker, Mel Matthews, Dave Boadle and Ben Jarihani
Quantifying the effectiveness of gully remediation on off-site water quality Preliminary results from demonstration sites in the Burdekin catchment (second wet season)
Rebecca Bartley1, Aaron Hawdon1, Anne Henderson1, Scott Wilkinson1, Nick Goodwin2, Brett Abbott1, Brett Baker1, Mel Matthews1, Dave Boadle1 and Ben Jarihani3 2Queensland
1CSIRO
Department of Science, Information Technology and Innovation (DSITI) 3University of Sunshine Coast
Supported by the Australian Government’s National Environmental Science Program Project 2.1.4 Demonstration and evaluation of gully remediation on downstream water quality and agricultural production in GBR rangelands
© CSIRO, 2018
Creative Commons Attribution Quantifying the effectiveness of gully remediation on off-site water quality: preliminary results from demonstration sites in the Burdekin catchment (second wet season) is licensed by the CSIRO for use under a Creative Commons Attribution 4.0 Australia licence. For licence conditions see: https://creativecommons.org/licenses/by/4.0/ This report should be cited as: Bartley, R., Hawdon, A., Henderson, A., Wilkinson, S., Goodwin, N., Abbott, B., Baker, B., Matthews, M., Boadle, D. and Jarihani, B. (2018) Quantifying the effectiveness of gully remediation on off-site water quality: preliminary results from demonstration sites in the Burdekin catchment (second wet season). Report to the National Environmental Science Program. Reef and Rainforest Research Centre Limited, Cairns (75pp.). Published by the Reef and Rainforest Research Centre on behalf of the Australian Government’s National Environmental Science Program (NESP) Tropical Water Quality (TWQ) Hub. The Tropical Water Quality Hub is part of the Australian Government’s National Environmental Science Program and is administered by the Reef and Rainforest Research Centre Limited (RRRC). The NESP TWQ Hub addresses water quality and coastal management in the World Heritage listed Great Barrier Reef, its catchments and other tropical waters, through the generation and transfer of world-class research and shared knowledge. This publication is copyright. The Copyright Act 1968 permits fair dealing for study, research, information or educational purposes subject to inclusion of a sufficient acknowledgement of the source. The views and opinions expressed in this publication are those of the authors and do not necessarily reflect those of the Australian Government. While reasonable effort has been made to ensure that the contents of this publication are factually correct, the Commonwealth does not accept responsibility for the accuracy or completeness of the contents, and shall not be liable for any loss or damage that may be occasioned directly or indirectly through the use of, or reliance on, the contents of this publication. Cover photographs: Rebecca Bartley This report is available for download from the NESP Tropical Water Quality Hub website: http://www.nesptropical.edu.au
Quantifying the effectiveness of gully remediation on off-site water quality
CONTENTS Contents .................................................................................................................................. i List of Tables ......................................................................................................................... iii List of Figures........................................................................................................................ iv Acronyms ............................................................................................................................. vii Abbreviations ....................................................................................................................... vii Acknowledgements ............................................................................................................. viii Report Overview.................................................................................................................... ix Executive Summary .............................................................................................................. 1 1.0 Introduction ..................................................................................................................... 4 2.0 Experimental Design ....................................................................................................... 6 2.1 General approach ........................................................................................................ 6 2.2 Gully remediation options............................................................................................. 6 3.0 Study Location................................................................................................................10 3.1 The Burdekin catchment .............................................................................................10 3.2 Trial sites ....................................................................................................................10 3.3 Treatments applied at each site ..................................................................................14 4.0 Methods .........................................................................................................................16 4.1 Vegetation and pasture metrics...................................................................................16 4.2 Gully erosion ...............................................................................................................16 4.2.1 Current rates of gully erosion: terrain analysis ......................................................16 4.3 Runoff .........................................................................................................................18 4.4 Water quality and particle size ....................................................................................18 4.5 Soil characterisation and condition metrics .................................................................19 5.0 Results ...........................................................................................................................21 5.1 Treatment location and survival ..................................................................................21 5.1.1 Virginia Park .........................................................................................................21 5.1.2 Meadowvale .........................................................................................................23 5.1.3 Strathbogie ...........................................................................................................26 5.1.4 Minnievale ............................................................................................................28 5.1.5 Mt Wickham..........................................................................................................31 5.2 Landscape condition ...................................................................................................33 5.3 Vegetation and pasture metrics...................................................................................34 5.3.1 Hillslope ................................................................................................................34 5.3.2 Gullies ..................................................................................................................34
i
Bartley et al.
5.3.3 Current rates of gully erosion: terrain analysis ......................................................36 5.4 Rainfall, runoff, water quality and particle size ............................................................43 6.0 Identifying priority hot-spot gullies for remediation at the property scale .........................57 6.1 Using gully upslope catchment area............................................................................57 6.2 The Index of connectivity ............................................................................................58 6.3 Identifying hot-spots areas for remediation..................................................................61 7.0 Discussion ......................................................................................................................62 8.0 Areas of Further Work ....................................................................................................64 References ...........................................................................................................................65 Appendix 1: Water depth, turbidity and sample history for each site .....................................71
ii
Quantifying the effectiveness of gully remediation on off-site water quality
LIST OF TABLES Table 1: Table 2:
Table 3: Table 4: Table 5: Table 6:
Table 7:
Table 8:
Table 9:
Table 10:
Table 11: Table 12: Table 13:
Comparison of removed and new information included in this report (2018) compared with Bartley at el., 2017 .................................................................. ix The range of gully remediation treatment options, expected outcomes and measurement metrics. The number of √’s represents the relative magnitude of expected response. The text in blue highlights legacy or ancillary data not currently covered within the NESP project and green is not reported this year 8 Description of the five study sites (Virginia Park, Meadowvale, Strathbogie, Minnievale and Mt Wickham). ........................................................................11 Description of treatment history at each site. LDC = Burdekin Landholders Driving Change (Major Investment Project) ...................................................14 A, B, C, D Land condition classification for each of the properties in this study. Note no data has yet been collected for Mt Wickham ....................................33 Amount of cover on the hillslope at the end of the dry season (2017) and end of the wet season (2018). Standard deviation shown in parentheses. Where the text is highlighted in blue/bold, there is a significant difference between the hillslopes above the Treatment and Control gullies ........................................35 Average amount of cover on the gully walls and floor at the end of the wet season (April 2018). Standard deviation shown in parentheses. Where the text is highlighted in blue/bold, there is a significant difference between the Treatment and Control gullies. .......................................................................35 Gully volumetric change results for 2017/18 using the RIEGL Terrestrial laser scanner. The Ucrit threshold for defining erosion/deposition was set as 0.1 m at all sites. Bulk density of sediment is set as 1.5 t/m3. Meadowvale treatment gully scanning had errors and no data is available for this wet season...................37 Gully headcut retreat rates in 2016/17 and 2017/18 using the RIEGL Terrestrial laser scanner. Meadowvale treatment gully scanning had errors and no data is available for this wet season. .........................................................................37 Summary of rainfall, runoff, water quality concentration and loads for each of the sites for the 2017/18 wet season. * Note that Mt Wickham was only installed on 21/2/18 and CSIRO is not contracted for land condition monitoring at this site.................................................................................................................45 Summary of progress with velocity data for the 2017/18 wet season .............46 Treatment differences (treatment vs control) emerging in TSS concentrations after 2 wet seasons........................................................................................47 Partition of TSS concentration and particle size of sediments moving in the water column between the hillslope and gully system at Virginia Park ...........47
iii
Bartley et al.
LIST OF FIGURES Figure 1: Figure 2:
Figure 3: Figure 4: Figure 5: Figure 6: Figure 7: Figure 8:
Figure 9:
Figure 10:
Figure 11:
Figure 12:
Figure 13: Figure 14:
Figure 15:
Figure 16: Figure 17:
Figure 18:
iv
The adaptive monitoring framework implemented in this study (Lindenmayer and Likens, 2009) ........................................................................................... 6 Conceptual model of the outcome of various treatment options within a gully (Wilkinson et al., 2015a). The green triangles represent within gully trapping structures such as porous check dams (PCDs). ............................................. 7 Underlying geology at each of the trial properties (Source: GeoScience Australia) .......................................................................................................12 Underlying soil type at each of the properties (Source: Atlas of Australian Soils) ......................................................................................................................12 Rainfall distribution for each of the properties (Source: SILO 5 km grid) ........13 Total ground cover (2015) for each of the properties (Source: Queensland Government fractional ground cover product) ................................................13 (A) Example of a treatment gully set up and (B) and example of a control gully set up including two rising stage samplers .....................................................18 The treatment (left) and control (right) instrumented gullies at each property. (A) Virginia Park (B) Meadowvale (C) Strathbogie, (D) Minnie Vale and (E) Mt Wickham........................................................................................................20 Location of the Virginia Park site (left) and the Treatment and Control gullies. The location of the treatment structures and monitoring equipment/locations are shown. ...........................................................................................................22 Changes in the vegetation adjacent to a check-dam structure (#1) in the Treatment gully (upstream is to the right) at Virginia Park from 2010 to 2018 (adapted from Wilkinson et al., 2015b)...........................................................23 Location of Meadowvale site (left) and the Treatment and Control gullies. The location of the treatment structures and monitoring equipment/locations are shown. ...........................................................................................................25 Location of Strathbogie site (left) and the Treatment and Control gullies. The location of the treatment structures and monitoring equipment/locations are shown. ...........................................................................................................27 Example of the stick traps installed at Minnievale station ...............................28 Location of Minnievale site (left) and the Treatment and Control gullies. The location of the treatment structures and monitoring equipment/locations for the 2016/17 wet season are shown. ....................................................................29 Location of Minnievale site (left) and the Treatment and Control gullies. The location of the treatment structures and monitoring equipment/locations for the 2017/18 wet season are shown. Note the changes to the location and type of structures at this site from the previous wet season. ......................................30 (left) Single channel gully and (right) highly sodic soil resulting in Badlands or alluvial gully formation. Both gully types are found on Mt Wickham Station ...31 Location of the Mt Wickham (left) and the Treatment and Control gullies. The location of the treatment structures and monitoring equipment/locations are shown. ...........................................................................................................32 Relationship between upslope gully catchment area (ha) and the average TLS measured erosion rate (t/m/y) from the combined wet season periods for all gully sites (treatment and control) and control sites separately. .....................38
Quantifying the effectiveness of gully remediation on off-site water quality
Figure 19:
Figure 20:
Figure 21:
Figure 22:
Figure 23:
Figure 24:
Figure 25:
Figure 26:
Figure 27:
Figure 28: Figure 29: Figure 30: Figure 31: Figure 32: Figure 33: Figure 34:
Net sediment movement (tonnes per metre surveyed, t/m) for each of the gully sites (assuming a soil bulk density of 1.5 t/m3) for the 2016-18 period. Erosion is represented by positive (+ve) values and deposition negative (-ve) values. .. ......................................................................................................................39 Virginia Park (A) control gully in 2016 (B) control gully in 2018 and (C) DEM of Difference; (D) treatment gully in 2015, (E) treatment gully in 2018 and (C) DEM of Difference as measured by the RIEGL terrestrial laser scanner, where dark green is deposition and brown is erosion. ......................................................40 Meadowvale (A) control gully in 2017 (B) control gully in 2018 and (C) DEM of Difference; (D) treatment gully in 2017, (E) treatment gully in 2018 and (C) DEM of Difference as measured by the RIEGL terrestrial laser scanner, where dark green is deposition and brown is erosion. Treatment site unavailable due to scanning alignment. .......................................................................................41 Strathbogie (A) control gully in 2016 (B) control gully in 2018 and (C) DEM of Difference; (D) treatment gully in 2016, (E) treatment gully in 2018 and (C) DEM of Difference as measured by the RIEGL terrestrial laser scanner, where dark green is deposition and brown is erosion. ......................................................42 Minnievale (A) control gully in 2016 (B) control gully in 2018 and (C) DEM of Difference; (D) treatment gully in 2016, (E) treatment gully in 2018 and (C) DEM of Difference as measured by the RIEGL terrestrial laser scanner, where dark green is deposition and brown is erosion. ......................................................43 Treatment gully at Virginia Park in (A) 2016 (B) during an event in 2017 and (C) at the end of reporting period in April 2017 and (D) at the end of reporting period in April 2018 ..................................................................................................48 Treatment gully at Meadowvale in (A) 2016 (B) during an event in 2017 and (C) at the end of reporting period in April 2017 and (D) at the end of reporting period in April 2018 ..................................................................................................49 Treatment gully at Strathbogie in (A) 2016 (B) during an event in 2017 and (C) at the end of reporting period in April 2017 and (D) at the end of reporting period in April 2018 ..................................................................................................50 Treatment gully at MinnieVale in (A) 2016 (B) during an event in 2017 and (C) at the end of reporting period in April 2017 and (D) at the end of reporting period in April 2018 ..................................................................................................51 Control gully at Mt Wickham before (left) and during (middle) an event and at the end of reporting period (April 2018)..........................................................51 (A) TSS concentration and (B) TN concentrations at Virginia Park for two wet seasons .........................................................................................................52 (A) TSS concentration and (B) TN concentrations at Meadowvale for two wet seasons .........................................................................................................52 (A) TSS concentration and (B) TN concentrations at Strathbogie for two wet seasons .........................................................................................................52 (A) TSS concentration and (B) TN concentrations at Minnievale for two wet seasons .........................................................................................................53 (A) TSS concentration and (B) TN concentrations at Mt Wickham in 2017/18 wet seasons ..................................................................................................53 (A) comparison of TSS data from un-treated gullies in 2017/18 (B) a comparison of TN data treatment sites as there was insufficient data from control sites alone for TN (using a range of 2016/17 and 2017/18 data) .....................................54 v
Bartley et al.
Figure 35:
Figure 36:
Figure 37: Figure 38:
Figure 39:
Figure 40:
Figure 41: Figure 42: Figure 43: Figure 44: Figure 45: Figure 46: Figure 47: Figure 48: Figure 49: Figure 50:
Figure 51:
vi
(A) Ratio of nutrient speciation contributing to total N loads at three sites (Virginia Park, Meadowvale and Mt Wickham) and (B) the difference in nitrogen forms between a long term treatment and control gully at Virginia Park .........55 Particle size of suspended sediment collected at each of the five properties over the two wet seasons. Note that sediment 10 ha, >5 ha and >1 ha at Virginia Park. ..............................................................................................................57 Input components to the Index of Connectivity (IC), where A = upslope area, W is a weighting factor, S is the average slope gradient (after Borselli et al., 2008) ......................................................................................................................59 Application of the Index of Connectivity to the Weany Creek catchment using a basic stream network. The gully network is not explicitly mapped, and therefore this primarily represents hillslope connectivity................................................59 Application of the Index of Connectivity to the Weany Creek catchment using the full channel network (based on Lidar mapping) which includes the stream and gully network. ..........................................................................................60 The connectivity of each area in the catchment to the catchment outlet.........60 Virginia Park Treatment gully runoff, turbidity, velocity and sample points on the hydrograph. ...................................................................................................71 Virginia Park Control gully runoff, turbidity, velocity and sample points on the hydrograph. ...................................................................................................71 Meadowvale Treatment gully runoff, turbidity, velocity and sample points on the hydrograph ....................................................................................................72 Meadowvale Control gully runoff, turbidity, velocity and sample points on the hydrograph. ...................................................................................................72 Strathbogie Treatment gully runoff, turbidity and sample points on the hydrograph. ...................................................................................................73 Strathbogie Control gully runoff, turbidity and sample points on the hydrograph. ......................................................................................................................73 Minnievale Treatment gully runoff, turbidity and sample points on the hydrograph. ...................................................................................................74 Minnievale Control gully runoff, turbidity, velocity and sample points on the hydrograph. ...................................................................................................74 Mt Wickham Treatment gully runoff, turbidity and sample points on the hydrograph. Electronic issue prevented sample collection at this site for the first event. Sample marker where the sampler would have sampled.....................75 Mt Wickham control gully runoff, turbidity and sample points on the hydrograph. ......................................................................................................................75
Quantifying the effectiveness of gully remediation on off-site water quality
ACRONYMS CSIRO........... Commonwealth Scientific and Industrial Research Organisation DEHP ............ Department of Environment and Heritage Protection DEMs ............ Digital Elevation Models DoDs............. Digital Elevation Models of Difference DSITI ............. Department of Science, Information Technology and Innovation GBR .............. Great Barrier Reef LDC............... Landholders Driving Change NESP ............ National Environmental Science Program P2R ............... Paddock to Reef PCD .............. Porous check dams QDES ............ Queensland Department of Environment and Science RTK............... Real time kinematic TLS ............... Terrestrial Laser Scanner TWQ.............. Tropical Water Quality
ABBREVIATIONS BACI ............. before, after, control, impact DON .............. dissolved organic nitrogen ML ................. mega litres PN ................. particulate nitrogen SD ................. standard deviation SE ................. standard error TN ................. total nitrogen TSS ............... total suspended sediment
vii
Bartley et al.
ACKNOWLEDGEMENTS We would like to thank the Australian Government’s National Environmental Science Program (NESP) Tropical Water Quality (TWQ) Hub, Commonwealth Scientific and Industrial Research Organisation (CSIRO) and the Queensland State Government Department of Environment and Heritage Protection (DEHP) and the Department of Science, Information Technology and Innovation (DSITI) for funding this research. I would also like to thank Peter Zund, Queensland Department of Environment and Science (QDES) and Seonaid Philip (CSIRO) for supporting the soil sampling at three of the properties in 2018, so we now have consistent soil descriptions for all of the sites. We would also like to thank the Property owners for allowing access to their properties and involvement in the projects. Thank you to Rob, Sue and Matt Bennetto, John Ramsay and Family, Darren Watts and Family, and Barney and Juanita Gordon. Thankyou also to Dr Elisabeth Bui (CSIRO) for reviewing an earlier version of this report. Team member contributions to the project: Rebecca Bartley designed the project, managed the contracts and project milestones, analysed the water quality and particle size data and wrote the report. Aaron Hawdon lead the design of the water quality instrumentation set-up and installation at all sites, instrument trouble-shooting and maintenance and prepared the hydrograph data. Anne Henderson processed the velocity and flow data, calculated spatial data analysis metrics and prepared the maps and figures for the report. Scott Wilkinson co-designed the project (including experimental design) and facilitated the collaborative links with the Reef Trust projects and previous Paddock to Reef (P2R) work at Virginia Park. Nick Goodwin was responsible for the terrestrial laser scanning at all of the gully sites and developed the DEMs of difference and volumetric erosion change data. Brett Abbott was responsible for the design, collection, analysis and presentation of the land condition and hillslope vegetation data. Brett Baker supported the collection and submission of the water quality data, assisted with field installation and maintenance, and collected the RTK surveys. He also prepared the field sampling manual for our delivery partners. Mel Matthews was responsible for the collection, submission and maintenance of the water quality data, and assisted with field installation and maintenance. David Boadle assisted with the water quality instrumentation set up and testing. Ben Jarihani ran the Index of Connectivity analysis.
viii
Quantifying the effectiveness of gully remediation on off-site water quality
REPORT OVERVIEW This document represents the 2017/18 annual research report for NESP TWQ Hub Project 2.1.4 (Demonstration and evaluation of gully remediation on downstream water quality and agricultural production in GBR rangelands). The results from the first wet season (2016/17) for four grazing properties were presented in Bartley et al., (2017). This current report presents the results for the 2017/18 wet season for the four original sites, and it now includes a fifth property, Mt Wickham, which is part of the Burdekin Landholders Driving Change network. This report is written as a stand-alone report, and therefore there is considerable repetition from the previous 2017 report. Table 1 outlines the differences between the 2017 and 2018 reports. To reduce the size of the report, some information has been removed (e.g. air photo interpretation). This document presents the technical information from the field sites only. Table 1: Comparison of removed and new information included in this report (2018) compared with Bartley at el., 2017
Data/information in Year 1 only (2017) Historical Air photo interpretation Review of remediation effectiveness from across the world Zebedee terrain scanning results
New data information in Year 2 (2018) Inclusion of the new Landholders Driving Change Mt Wickham site New velocity sensors installed and initial data analysed in anticipation of measuring flow discharge for constituent load estimation More detailed analysis of the nitrogen speciation at the various sites Comparison of hillslope vs gully TSS concentration and particle size data Options for identifying high risk gullies at the catchment/property scale
ix
Quantifying the effectiveness of gully remediation on off-site water quality
EXECUTIVE SUMMARY Gully erosion contributes ~40% of the excess soil erosion to the Great Barrier Reef (GBR) from just ~0.1% of the catchment area, however, methods and approaches for reducing this erosion source are not well tested in this environment. Gully erosion is a complex process influenced by soil properties, terrain, surface and sub-surface runoff and vegetation. There is significant Government investment in GBR water quality improvement focused on reducing gully erosion, and there is an urgent need to evaluate the most cost-effective methods for reducing the sediment and particulate nutrients generated and delivered from this erosion source. This study was designed to evaluate the effectiveness of a range of remediation options for the smaller more ubiquitous hillslope gullies found within rangeland systems of the Burdekin basin, however, in 2018, an additional property (Mt Wickham), containing alluvial gullies, was added to the analysis. A total of five properties are being evaluated in this report. Two properties located in the Upper Burdekin, one in the Bogie, one in the Don River catchment and one in the Bowen. Paired gully sites (treatment and control) were identified at each property. The remediation options implemented on the treatment gullies include a mixture of fencing, stock exclusion, sediment trapping structures (within the gullies) and hillslope vegetation management. Remediation at the Mt Wickham property will be more intensive (and expensive) commensurate with the contribution of sediment from this source. Of the five properties being monitored, only three had active treatments installed prior to the 2017/18 wet season, however, one of the sites with active remediation now has eight years of treatment data. To quantify the effectiveness of the various treatment options a suite of monitoring equipment and sites have been set up on both the treatment and control gully at each location. These metrics include (i) estimates of land condition, vegetation cover, biomass and species diversity on the hillslopes above each gully as well as within the gullies, (ii) repeated 3D laser scanning of terrain to estimate changes in erosion and deposition, and (iii) water quality and quantity monitoring equipment that allows the measurement of water stage, runoff volume, turbidity, sediment and nutrient concentration and particle size. Water quality samples from these sites have also been shared with other projects looking at the bio-availability of nutrients, geochemical tracing and nutrient isotope analysis. The hydrological reporting period presented in this report is primarily from the November 1st 2017 until April 30th 2018, however, where appropriate data from both wet seasons is presented. The key results so far suggest that: ➢ Gully catchment land condition at all sites remains in C or D class, and the pasture species are dominated by the exotic perennial grass Indian couch, forbs, and/or exotic legumes. Indian couch is known to indicate relatively poor infiltration compared to that associated with native perennial species. ➢ Porous check dams (or PCDs) constructed from sticks and logs, in combination with stock exclusion fencing, appear to have a statistically significant impact on the amount of vegetation (% cover and/or biomass) that stabilises gullies floors and walls. This, in turn, appears to have significantly reduced the total suspended sediment (TSS) concentrations
1
Bartley et al.
within the gullies treated with PCDs, although several more years of average to above average rainfall is required to validate this finding. There is also a commensurate reduction in the total nitrogen following remediation with PCDs. ➢ Erosion of the gully headcuts during the 2017/18 wet season, as measured using the RIEGL Terrestrial Laser Scanner (TLS), ranged from 0.10 m at Minnievale Treatment site, to 7.8 m at Strathbogie. The maximum rate in 2017/18 was much lower than the 18.1 m headcut retreat measured at Strathbogie in 2016/17. However, the Strathbogie site, which is located on Vertosol soils continues to have much higher erosion and headcut retreat rates than gullies on other soil types, despite the reduced rainfall in 2017/18. ➢ Sediment yield from the gullies ranges from 0.06 tonnes per metres (t/m/yr) at the Virginia Park treatment gully to 1.08 t/m/y at Strathbogie which has no treatment. The linear extent or change was not measured at Mt Wickham, as this is part of the Landholders Driving Change (LDC) Project, however, the erosion mechanism is likely to be very different at that site as sub-surface tunnel erosion is present. ➢ After the second wet season, there is still a strong relationship between the catchment area above the gully and average sediment yield (t/m/yr) for untreated gully sites (r 2 = ~0.86). Catchment area is a surrogate for runoff volume or energy and is the strongest predictor of sediment yield found in this study so far. ➢ The total suspended sediment (TSS) concentrations vary considerably between sites with the highest mean concentrations being measured at Mt Wickham at ~ 57,000 mg/l. This gully has very highly sodic sub-surface soils. The other gullies had peak concentrations between ~5000 and ~11,000 mg/l. The total nitrogen (TN) concentrations follow a similar pattern to TSS when comparing the control and treatment sites. Interestingly, although Mt Wickham has much higher TSS concentrations than the other sites, the TN values are not statistically different. ➢ At the long running treatment site (Virginia Park) the amount of nitrogen coming off the untreated control site is ~5080 µg/l which is more than three times the nitrogen concentration from the treatment site (~1550 µg/l). In addition, the form of nitrogen varies between the treatments. That is, at the control site, ~92% of the total nitrogen (TN) is in particulate form (PN), whereas at the treatment site, only ~60% of the TN is in particulate form, the remainder is largely dissolved organic nitrogen (DON). This most likely reflects the increased vegetation cover at the treatment site reducing the amount of particulate nitrogen (PN), but also contributing some nitrogen via the breakdown of vegetative matter. ➢ The proportion of particulate nitrogen (PN) in the total nitrogen (TN) concentrations varies between ~60-90% for different sites. ➢ The high sediment concentrations measured at Mt Wickham help justify this site as part of the LDC program. These types of remediation projects will potentially have high effectiveness, but they will also come at a high cost and are confined to certain locations. Therefore, understanding the effect of improved land management and gully remediation is still a priority for more ubiquitous smaller gullies. In addition, it is important to understand how we can improve the eco-hydrological function of these landscapes as a whole, so that we can potentially reduce the runoff and sediment loss from all erosion sources, including hillslopes and streambanks.
2
Quantifying the effectiveness of gully remediation on off-site water quality
The next 6 months of this project will be focusing on: ➢ Maintaining and servicing the monitoring equipment to collect a third wet season of data to estimate the effectiveness of treatments across four, hopefully five sites; ➢ Using a range of data metrics collected in this study to calculate estimates of the costeffectiveness for treatments at all of the sites. These estimates will be used to help inform the future investments in gully erosion control; and ➢ Developing methods for identifying ‘hot-spot’ gullies within catchments to prioritise sites for remediation. The data from the instrumented sites can then be used to run what-if scenarios for the properties under a range of remediation options.
3
Bartley et al.
1.0 INTRODUCTION There is considerable evidence demonstrating that excess sediment and associated nutrients from catchments adjacent to the Great Barrier Reef (GBR) are having a deleterious influence on seagrass beds (Waycott et al., 2005) and inshore coral reef ecosystems (De’ath et al., 2012). Gully erosion covers just 0.1% of the catchment area draining to the GBR, however, sediment source tracing, erosion mapping and load monitoring indicates that gully erosion supplies ~40% of the fine sediment (silt and clay, 1 ha at Virginia Park.
57
Bartley et al.
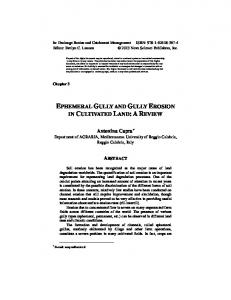
6.2 The Index of connectivity The index calculates the relative connectivity of sub-catchments to both (i) the channel network and (ii) the catchment outlet. It is a relative risk approach that estimates the connectivity of catchment area based on the upslope area, average slope and a weighting factor that can incorporate estimates of ground cover or soil type. The connectivity is primarily about the potential ‘connectivity’ of water or runoff, but it can also represent sediment or nutrients or any constituent that moves in runoff. The methods for this approach are described in more detail in Borselli at el., (2008) and Sidle et al., (2017). In brief, the Index of Connectivity (IC) is defined by Equation 1 and described in Figure 38. The strength of the IC approach is that it explicitly represents the distributed flow path that water would take moving through a landscape, as opposed to the lumped representation of hydrology within other approaches such as the Universal Soil Loss Equation (USLE). The IC approach also considers the potential for deposition (or dis-connectivity) within each segment. We applied the Index of Connectivity to the Virginia Park NESP study site to highlight which sub-catchments would have the highest relative connectivity to (i) the main stream channel network (Figure 39), (ii) to the entire channel network including mapped gullies (Figure 40) and (ii) to the catchment outlet (Figure 41). For each of these scenarios, the ground cover was represented as a consistent 50%, however, in future scenarios, spatially explicit ground cover can be used via the weighting factor. The results suggest that there are specific parts of the catchment that have higher connectivity (red and orange areas) and therefore higher potential or relative risk of delivery of water and sediment/nutrients to the stream network. Having a gullied landscape increases the connectivity of many areas of a catchment (Figure 40). In terms of the delivery of water and sediment to the end of a catchment, the areas closest to the catchment outlet will generally be the highest risk, all other things (such as soil type and ground cover) being equal (Figure 41).
58
Quantifying the effectiveness of gully remediation on off-site water quality
𝐷𝑢𝑝 𝐼𝐶 = 𝐿𝑜𝑔10 ( ) 𝐷𝑑𝑛
Equation 1
Figure 38: Input components to the Index of Connectivity (IC), where A = upslope area, W is a weighting factor, S is the average slope gradient (after Borselli et al., 2008)
Figure 39: Application of the Index of Connectivity to the Weany Creek catchment using a basic stream network. The gully network is not explicitly mapped, and therefore this primarily represents hillslope connectivity.
59
Bartley et al.
Figure 40: Application of the Index of Connectivity to the Weany Creek catchment using the full channel network (based on Lidar mapping) which includes the stream and gully network.
Figure 41: The connectivity of each area in the catchment to the catchment outlet.
60
Quantifying the effectiveness of gully remediation on off-site water quality
6.3 Identifying hot-spots areas for remediation These approaches together help identify areas with high erosive potential (upslope catchment areas) and then the potential of those areas to have high delivery or connectivity to the stream network and beyond. Using these approaches could be a more efficient way to identify high risk areas within a property that are worthy of remediation investment. Given that significant (often >$1m) is being spent on remediation at some sites, these approaches could improve the identification of high risk areas worthy of investment. The Universal Soil Loss Equation (USLE) approaches within the SedNet (or SourceCatchments) framework have traditionally been used to estimate the relative contribution from sub-catchments within a property (e.g. Kinsey-Henderson et al., 2005), and future NESP work will be undertaken to evaluate how these approaches vary at a range of catchment scales. Where appropriate, the specific gully data collected as part of the NESP project will be used to help calibrate and validate the modelling approaches.
61
Bartley et al.
7.0 DISCUSSION The main aim of this project is to quantify the effectiveness of gully erosion control activities (gully remediation) on erosion processes and water quality. Achieving this within a diverse biophysical landscape is challenging because erosion is dependent on many variables including climate variations. We are accounting for and monitoring as many of the landscape attributes which affect gully erosion (e.g. soil type, geology, rainfall, vegetation, terrain) to increase our ability to identify the effects of erosion remediation activities separate from other factors. The initial aim of this project was to monitor sites that were part of the Reef Trust Gully Erosion Control Programme. However, due to the timing of activities at those sites, and our requirement for well-matched control gullies at each site, only two out of the four sites are in the Reef Trust Programme. We have consequently also included additional sites used in previous CSIRO research funded by Meat and Livestock Australia and the Paddock to Reef Program. In 2018, we also included the Mt Wickham Landholders Driving Change site, although it is not formerly funded by the NESP program. Cover metrics The ground based landscape condition analysis determined that all of these sites are in C or D condition, with a small proportion (10 years) of wet season rest and reduced forage utilisation, with pasture composition returning only gradually towards native perennial tussock grasses (Bartley et al., 2014). Mechanical intervention such as ploughing and reseeding may accelerate the process but is not proven. The initial wet season monitoring of forage has indicated that while the % cover and biomass (kg/ha) may be higher at Virginia Park, which has undergone grazing land management over the last decade, the plant basal area is still low. This highlights that a combination of pasture metrics is required to quantify the functional vegetation attributes at these sites, and that reinstating eco-hydrological function in these degraded landscapes is challenging. The cover results from within the gullies suggests that those sites that have been fenced off and cattle excluded are showing a measurable increase in pasture cover and biomass. This provides greater support to the need for cattle to be removed from gullied areas to allow pasture to recover. Terrain analysis The results from the terrain analysis have been very useful for highlighting how variable gully erosion and deposition can be between gullies in the same soil type, and between the same gully in different years. For the second year in a row, the most reliable predictor of gully erosion rate is the upslope catchment area draining to the gully headcut. There was no significant relationship with rainfall or ground cover. The main limitation to the terrain analysis is that it
62
Quantifying the effectiveness of gully remediation on off-site water quality
captures all of the sediment fractions (fine and coarse) and so it is best used in conjunction with the water quality data which represents the fractions of sediment/nutrients that are mobilised in the runoff and moved downstream. Water Quality The results from the second wet season suggest that there is a statistically significant difference in the TSS concentrations measured between the treatment and control sites at both Virginia Park and Minnievale. This is a good sign given that the 2016/17 and 2017/18 wet seasons were quite different. This suggests that a combination of gully fencing, stock exclusion and porous check dam instream structures are potentially effective at improving downstream water quality. The significant difference in the cover and/or biomass between the treatment and control gullies at these sites supports these results. A third wet season of results will help to confirm this trend. The water quality results also highlight that Mt Wickham has much higher sediment concentrations than any of the other sites. It is therefore justified as a high priority remediation site for the LDC program. It is well established that the Bowen catchment has much larger sediment yields (t/km2/yr) compared to any other catchment in the GBR catchments, and these results help provide another line of evidence for that investment. Importantly, however, there will be a limited number of willing landholders prepared to undertake remediation on the scale of Mt Wickham (and Strathalbyn). These types of remediation projects will potentially have high effectiveness, but they will also come at a high cost. Hence understanding the effect of improved land management and gully remediation is still a priority for the smaller gullies. In addition, it is important to understand how we can improve the eco-hydrological function of these landscapes as a whole, so that we can potentially reduce the runoff and sediment loss from other erosion sources including hillslopes and streambanks. Identifying hotspot gully areas at the property scale In response to the need for relatively rapid approaches for identifying hot-spot areas with highly gullied properties, two approaches were trialled at one of the NESP properties (Virginia Park) to demonstrate the potential of (i) gully upslope catchment area and (ii) the index of connectivity, for differentiating high risk gully sites. Further work will be undertaken to further integrate these approaches with the specific data collected at each of the NESP research sites.
63
Bartley et al.
8.0 AREAS OF FURTHER WORK In the remainder of this project we will: • Estimate the cost-effectiveness of the gully treatments at the three treatment sites. These results will be compared with the approach used in the Reef Trust sediment savings calculator; • Continue to monitor the control and treatment sites for a third wet season; • Work with our research partners to provide insights into how the results from this study link with the studies on nutrient geochemical tracing, nutrient bio-availability and marine impact. • Continue exploring options for scaling up the results from the individual gullies to demonstrate effectiveness at larger scales. This will also involve improved approaches for rapidly assessing high priority gully sites for remediation.
64
Quantifying the effectiveness of gully remediation on off-site water quality
REFERENCES Abbott, B.N. and Corfield, J.P., 2012. A patch based land condition framework for rangeland assessment and monitoring: Background information and users guide CSIRO - Land and Water Flagship - Rangeland and Savannas. Aisthorp, J.L. and Paton, C.J., 2004. Stocktake - Balancing Supply and Demand, Workshop Manual. Brisbane, DPI&F. Ash, A.J., Corfield, J.P., McIvor, J.G. and Ksiksi, T.S., 2011. Grazing Management in Tropical Savannas: Utilization and Rest Strategies to Manipulate Rangeland Condition. Rangeland Ecology & Management, 64(3): 223-239, 10.2111/rem-d-09-00111.1. Bainbridge, Z., Bartley, R., Lewis, S., Fabricius, K., Collier, C.J., Waterhouse, J., GarzonGarcia, A., Robson, B.J., Burton, J., Wenger, A.S. and Brodie, J., In Review. Understanding ridge-to-reef connections to set management goals for fine sediment and particulate organic matter. Marine Pollution Bulletin. Bainbridge, Z., Lewis, S., Smithers, S., Wilkinson, S., Douglas, G., Hillier, S. and Brodie, J., 2016. Clay mineral source tracing and characterisation of Burdekin River (NE Australia) and flood plume fine sediment. Journal of Soils and Sediments, 16(2): 687-706, 10.1007/s11368-015-1282-4. Bainbridge, Z.T., Lewis, S.E., Smithers, S.G., Kuhnert, P.M., Henderson, B.L. and Brodie, J.E., 2014. Fine suspended sediment and water budgets for a large, seasonally dry tropical catchment: Burdekin River catchment, Queensland, Australia. Water Resources Research, 50(11): 9067-9087, 10.1002/2013wr014386. Baker, B., Hawdon, A. and Bartley, R., 2016. Gully remediation sites: water quality monitoring procedures, CSIRO Land and Water, Australia. Bartley, R., Corfield, J.P., Abbott, B.N., Hawdon, A.A., Wilkinson, S.N. and Nelson, B., 2010. Impacts of improved grazing land management on sediment yields, Part I: hillslope processes. Journal of Hydrology, 389(3-4): 237-248. Bartley, R., Corfield, J.P., Hawdon, A.A., Kinsey-Henderson, A.E., Abbott, B.N., Wilkinson, S.N. and Keen, R.J., 2014. Can changes to pasture management reduce runoff and sediment loss to the Great Barrier Reef? The results of a 10-year study in the Burdekin catchment, Australia. The Rangeland Journal, 36(1): 67-84, http://dx.doi.org/10.1071/RJ13013. Bartley, R., Croke, J., Bainbridge, Z.T., Austin, J.M. and Kuhnert, P.M., 2015. Combining contemporary and long-term erosion rates to target erosion hot-spots in the Great Barrier Reef, Australia. Anthropocene, 10(1-2), http://dx.doi.org/10.1016/j.ancene.2015.08.002. Bartley, R., Goodwin, N., Henderson, A.E., Hawdon, A., Tindall, D., Wilkinson, S.N. and Baker, B., 2016. A comparison of tools for monitoring and evaluating channel change, Report to NESP, Project 1.2b. Bartley, R., Hawdon, A., Henderson, A., Wilkinson, S., Goodwin, N., Abbott, B., Baker, B., Matthews, M., Boadle, D., Telfer, D., Smith, B., Jarihani, B. and Burkin, B., 2017. Quantifying the effectiveness of gully remediation on off-site water quality: preliminary results from demonstration sites in the Burdekin catchment. NESP Project 2.1.4. Milestone report, June 2017. Bernhardt, E.S., Palmer, M.A., Allan, J.D., Alexander, G., Barnas, K., Brooks, S., Carr, J., Clayton, S., Dahm, C., Follstad-Shah, J., Galat, D., Gloss, S., Goodwin, P., Hart, D., Hassett, B., Jenkinson, R., Katz, S., Kondolf, G.M., Lake, P.S., Lave, R., Meyer, J.L.,
65
Bartley et al.
O'Donnell, T.K., Pagano, L., Powell, B. and Sudduth, E., 2005. Ecology - Synthesizing US river restoration efforts. Science, 308(5722): 636-637, 10.1126/science.1109769. Borselli, L., Cassi, P. and Torri, D., 2008. Prolegomena to sediment and flow connectivity in the landscape: A GIS and field numerical assessment. Catena, 75(3): 268-277, http://dx.doi.org/10.1016/j.catena.2008.07.006. Brinkman, R., Tonin, H., Furnas, M., Schaffelke, B. and Fabricius, K., 2014. Targeted analysis of the linkages between river runoff and risks for crown of thorns starfish outbreaks in the Northern GBR, Australian Institute of Marine Science Report. Castillo, C. and Gómez, J.A., 2016. A century of gully erosion research: Urgency, complexity and study approaches. Earth-Science Reviews, 160: 300-319, http://dx.doi.org/10.1016/j.earscirev.2016.07.009. Chaplot, V., 2013. Impact of terrain attributes, parent material and soil types on gully erosion. Geomorphology, 186(0): 1-11, http://dx.doi.org/10.1016/j.geomorph.2012.10.031. Chilcott, C., Quirk, M., Paton, C., Nelson, B. and Oxley, T., 2005. Development of a grazing land management education program for northern Australia’s grasslands and grassy woodlands. In XX International Grasslands Congress: Offered papers, ed. By O’Mara, F.P., Wlikins, R.J., ‘t Mannetje L., Lovett, D.K., Rogers, P.A.M. and Boland, T.M., Academic Publishers, The Netherlands, pp. 793. De Baets, S., Poesen, J., Reubens, B., Muys, B., De Baerdemaeker, J. and Meersmans, J., 2009. Methodological framework to select plant species for controlling rill and gully erosion: application to a Mediterranean ecosystem. Earth Surface Processes and Landforms, 34(10): 1374-1392, 10.1002/esp.1826. De’ath, G., Fabricius, K.E., Sweatman, H. and Puotinen, M., 2012. The 27–year decline of coral cover on the Great Barrier Reef and its causes. Proceedings of the National Academy of Sciences, 109 (44): 17995-17999, 10.1073/pnas.1208909109. Devlin, M.J., Harkness, P., McKinna, L., Abbott, B.N. and Brodie, J., 2012. Exposure of riverine plume waters in the Great Barrier Reef: mapping of exposure and risk to GBR ecosystems. Marine Pollution Bulletin, 65(4/9): 224-235. Doolittle, W.E., 1985. The use of check dams for protecting agricultural lands in the Prehistoric Southwest - a contextual analysis. Journal of Anthropological Research, 41(3): 279305. Evans, M. and Lindsay, J., 2010. High resolution quantification of gully erosion in upland peatlands at the landscape scale. Earth Surface Processes and Landforms, 35(8): 876886, 10.1002/esp.1918. Furuichi, T., Olley, J., Wilkinson, S., Lewis, S., Bainbridge, Z. and Burton, J., 2016. Paired geochemical tracing and load monitoring analysis for identifying sediment sources in a large catchment draining into the Great Barrier Reef Lagoon. Geomorphology, 266: 4152, http://dx.doi.org/10.1016/j.geomorph.2016.05.008. Gallant, J.C., Dowling, T.I., Read, A.M., Wilson, N., Tickle, P. and Inskeep, C., 2011. 1 second SRTM Derived Digital Elevation Models User Guide, Geoscience Australia. http://www.ga.gov.au/topographic-mapping/digital-elevation-data.html. Gellis, A.C., Cheama, A., Laahty, V. and Lalio, S., 1995. Assessment of gully-control structures in the Rio-Nutria Watershed, Zuni Reservation, New-Mexico. Water Resources Bulletin, 31(4): 633-646. Goodwin, N.R., Armston, J., Stiller, I. and Muir, J., 2016. Assessing the repeatability of terrestrial laser scanning for monitoring gully topography: A case study from Aratula, Queensland, Australia. Geomorphology, http://dx.doi.org/10.1016/j.geomorph.2016.03.007.
66
Quantifying the effectiveness of gully remediation on off-site water quality
Goodwin, N.R., Armston, J.D., Muir, J. and Stiller, I., 2017. Monitoring gully change: A comparison of airborne and terrestrial laser scanning using a case study from Aratula, Queensland. Geomorphology, 282: 195-208, http://dx.doi.org/10.1016/j.geomorph.2017.01.001. Green, R.H., 1979. Sampling Design and Statistical Methods for Environmental Biologists. Wiley-Interscience, New York. Guyassa, E., Frankl, A., Zenebe, A., Poesen, J. and Nyssen, J., 2017. Effects of check dams on runoff characteristics along gully reaches, the case of Northern Ethiopia. Journal of Hydrology, 545: 299-309, http://dx.doi.org/10.1016/j.jhydrol.2016.12.019. Gyssels, G., Poesen, J., Bochet, E. and Li, Y., 2005. The impact of plant roots on the resistance of soils to erosion by water: a critical review. Progress in Physical Geography, 29(2): 189-217. Hawdon, A., Keen, R.J., Post, D.A. and Wilkinson, S.N., 2008. Hydrological recovery of rangeland following cattle exclusion. In: J. Schmidt, T. Cochrane, C. Phillips, S. Elliott, T. Davies and L. Basher (Eds), Sediment Dynamics in Changing Environments IAHS Publ. 325, Christchurch New Zealand, pp. 532-539. Hevia, J.N., de Araujo, J.C. and Manso, J.M., 2014. Assessment of 80 years of ancientbadlands restoration in Saldana, Spain. Earth Surface Processes and Landforms, 39(12): 1563-1575, 10.1002/esp.3541. Kinsey-Henderson, A.E., Post, D.A. and Prosser, I.P., 2005. Modelling sources of sediment at sub-catchment scale: an example from the Burdekin Catchment, North Queensland, Australia. Mathematics and Computers in Simulation, 69(1-2): 90-102. Kondolf, G.M., Angermeier, P.L., Cummins, K., Dunne, T., Healey, M., Kimmerer, W., Moyle, P.B., Murphy, D., Patten, D., Railsback, S., Reed, D.J., Spies, R. and Twiss, R., 2008. Projecting Cumulative Benefits of Multiple River Restoration Projects: An Example from the Sacramento-San Joaquin River System in California. Environmental Management, 42(6): 933-945, 10.1007/s00267-008-9162-y. Kroon, F.J., Kuhnert, P.M., Henderson, B.L., Wilkinson, S.N., Kinsey-Henderson, A., Abbott, B., Brodie, J.E. and Turner, R.D.R., 2012. River loads of suspended solids, nitrogen, phosphorus and herbicides delivered to the Great Barrier Reef lagoon. Marine Pollution Bulletin, 65(4-9): 167-181, 10.1016/j.marpolbul.2011.10.018. Kroon, F.J., Schaffelke, B. and Bartley, R., 2014. Informing policy to protect coastal coral reefs: Insight from a global review of reducing agricultural pollution to coastal ecosystems. Marine Pollution Bulletin, 85(1): 33-41, http://dx.doi.org/10.1016/j.marpolbul.2014.06.003. Kurth, A.M. and Schirmer, M., 2014. Thirty years of river restoration in Switzerland: implemented measures and lessons learned. Environmental Earth Sciences, 72(6): 2065-2079, 10.1007/s12665-014-3115-y. Lindenmayer, D.B. and Likens, G.E., 2009. Adaptive monitoring: a new paradigm for long-term research and monitoring. Trends in Ecology & Evolution, 24(9): 482-486, 10.1016/j.tree.2009.03.005. McCloskey, G.L., Wasson, R.J., Boggs, G.S. and Douglas, M., 2016. Timing and causes of gully erosion in the riparian zone of the semi-arid tropical Victoria River, Australia: Management implications. Geomorphology, 266: 96-104, 10.1016/j.geomorph.2016.05.009. McDonald, R.C., Isbell, R.F., Speight, J.G., Walker, J. and Hopkins, M.S., 2009. Australian soil and land survey field handbook. Australian soil and land survey field handbook. CSIRO Publishing, Collingwood, Australia, xvii + 246 pp.
67
Bartley et al.
McGough, J.J. and Faraone, S.V., 2009. Estimating the Size of Treatment Effects: Moving Beyond P Values. Psychiatry (Edgmont), 6(10): 21-29. McIvor, J.G. and Scanlan, J.C., 1994. State and Transition models for Rangelands .8. A State and Transition model for the Northern Speargrass Zone. Tropical Grasslands, 28(4): 256-259. Nichols, M.H., Polyakov, V.O., Nearing, M.A. and Hernandez, M., 2016. Semiarid Watershed Response to Low-Tech Porous Rock Check Dams. Soil Science, 181(7): 275-282, 10.1097/ss.0000000000000160. Nyssen, J., Veyret-Picot, M., Poesen, J., Moeyersons, J., Haile, M., Deckers, J. and Govers, G., 2004. The effectiveness of loose rock check dams for gully control in Tigray, northern Ethiopia. Soil Use and Management, 20(1): 55-64, 10.1111/j.14752743.2004.tb00337.x. Olley, J., Brooks, A., Spencer, J., Pietsch, T. and Borombovits, D., 2013. Subsoil erosion dominates the supply of fine sediment to rivers draining into Princess Charlotte Bay, Australia. Journal of Environmental Radioactivity, 124(0): 121-129, http://dx.doi.org/10.1016/j.jenvrad.2013.04.010. Polyakov, V.O., Nichols, M.H., McClaran, M.P. and Nearing, M.A., 2014. Effect of check dams on runoff, sediment yield, and retention on small semiarid watersheds. Journal of Soil and Water Conservation, 69(5): 414-421, 10.2489/jswc.69.5.414. Prosser, I.P. and Slade, C.J., 1994. Gully formation and the role of valley-floor vegetation, southeastern Australia. Geology, 22(12): 1127-1130. Quinonero-Rubio, J.M., Nadeu, E., Boix-Fayos, C. and de Vente, J., 2016. Evaluation of the effectiveness of forest restoration and check-dams to reduce catchment sediment yield. Land Degradation & Development, 27(4): 1018-1031, 10.1002/ldr.2331. Ranga, V., Poesen, J., Van Rompaey, A., Mohapatra, S.N. and Pani, P., 2016. Detection and analysis of badlands dynamics in the Chambal River Valley (India), during the last 40 (1971–2010) years. Environmental Earth Sciences, 75(3): 183, 10.1007/s12665-0155017-z. Rogers, L., Cannon, M. and Barry, E., 1999. Land Resources of the Dalrymple Shire, Department of Natural Resources and CSIRO, Brisbane. Roth, C., 2004. A framework relating soil surface condition to infiltration and sediment and nutrient mobilisation in grazed rangelands of north-eastern Queensland. Earth Surface Processes and Landforms, 29: 1093-1104. Shellberg, J., Brooks, A. and Spencer, J., 2010. Land-use change from indigenous management to cattle grazing initiates the gullying of alluvial soils in northern Australia. Proceedings of the 19th World Congress of Soil Science: Soil solutions for a changing world, Brisbane, Australia, 1-6 August 2010. Symposium 4.3.1 Impacts of land use change in unsustainable ecosystems: 59-62. Shellberg, J.G., Spencer, J., Brooks, A.P. and Pietsch, T.J., 2016. Degradation of the Mitchell River fluvial megafan by alluvial gully erosion increased by post-European land use change, Queensland, Australia. Geomorphology, 266: 105-120, http://dx.doi.org/10.1016/j.geomorph.2016.04.021. Sidle, R.C., Gomi, T., Loaiza Usuga, J.C. and Jarihani, B., 2017. Hydrogeomorphic processes and scaling issues in the continuum from soil pedons to catchments. Earth-Science Reviews, 175(Supplement C): 75-96, https://doi.org/10.1016/j.earscirev.2017.10.010. Tongway, D. and Hindley, N., 1995. Manual for Soil Condition Assessment of Tropical Grasslands, CSIRO Publishing, Canberra.
68
Quantifying the effectiveness of gully remediation on off-site water quality
Tothill, J.C., McDonald, C.K., Jones, R.M. and Hargreaves, J.N.G., 1992. BOTANAL: A Comprehensive Sampling and Computing Procedure for Estimating Pasture Yield and Composition. Field sampling. CSIRO Division of Tropical Crops and Pastures, St Lucia, Brisbane. Underwood, A.J., 1994. On beyond BACI - sampling designs that might reliably detect environmental disturbances. Ecological Applications, 4(1): 3-15, 10.2307/1942110. Vanmaercke, M., Poesen, J., Van Mele, B., Demuzere, M., Bruynseels, A., Golosov, V., Bezerra, J.F.R., Bolysov, S., Dvinskih, A., Frankl, A., Fuseina, Y., Guerra, A.J.T., Haregeweyn, N., Ionita, I., Makanzu Imwangana, F., Moeyersons, J., Moshe, I., Nazari Samani, A., Niacsu, L., Nyssen, J., Otsuki, Y., Radoane, M., Rysin, I., Ryzhov, Y.V. and Yermolaev, O., 2016. How fast do gully headcuts retreat? Earth-Science Reviews, 154: 336-355, http://dx.doi.org/10.1016/j.earscirev.2016.01.009. Waterhouse, J., Brodie, J., Tracey, D., Lewis, S., da Silva, E., Coppo, C., Devlin. M., Maynard, J., Heron, S. and Petus, C., 2015. Assessment of the relative risk of water quality to ecosystems of the Burdekin Region, Great Barrier Reef, A report to NQ Dry Tropics, TropWATER Report 15/xx, Townsville, Australia. Waycott, M., Longstaff, B.J. and Mellors, J., 2005. Seagrass population dynamics and water quality in the Great Barrier Reef region: A review and future research directions. Marine Pollution Bulletin, 51(1-4): 343-350, 10.1016/j.marpolbul.2005.01.017. Wei, Y., He, Z., Li, Y., Jiao, J., Zhao, G. and Mu, X., 2016. Sediment Yield Deduction from Check–dams Deposition in the Weathered Sandstone Watershed on the North Loess Plateau, China. Land Degradation & Development: n/a-n/a, 10.1002/ldr.2628. Wilkinson, S.N., Bartley, R., Hairsine, P.B., Bui, E.N., Gregory, L. and Henderson, A.E., 2015a. Managing gully erosion as an efficient approach to improving water quality in the Great Barrier Reef lagoon, CSIRO, Report to the Department of the Environment (Reef Program). Wilkinson, S.N., Bastin, G., Stokes, C.J., Hawdon, A.A., Chewings, V.H., Kinsey-Henderson, A.E., Nicholas, D.M., Abbott, B.N., McKellar, K. and Kemei, J., 2014. Improving grazing management practices to enhance ground cover and reduce sediment loads, Report to the Reef Rescue Water Quality Research & Development Program. Reef and Rainforest Research Centre Limited, Cairns. Wilkinson, S.N., Brooks, A., Hairsine, P.B., Crawford, D., Bartley, R. and Pietsch, T., 2016. Gully and Stream Bank Toolbox: A technical guide for the Reef Trust Phase IV Gully and Stream Bank Erosion Control Program, CSIRO, Report to the Department of the Environment (Reef Program). Wilkinson, S.N., Hawdon, A., Henderson, A.E. and Baker, B., 2015b. Paddock to Reef Monitoring Modelling and Reporting Program - Burdekin Gully Erosion Monitoring Summary Report - July 2015, Paddock to Reef (P2R) Program Wilkinson, S.N., Hawdon, A.A., Hairsine, P.B. and Austin, J., 2015c. Gully Toolbox: A technical guide for the Reef Trust Gully Erosion Control Programme 2015-16, CSIRO, Report to the Department of the Environment (Reef Program). Wilkinson, S.N., Kinsey-Henderson, A.E., Hawdon, A., Ellis, T.W. and Nicholas, M., 2013. Gully erosion and its response to grazing practices in the Upper Burdekin catchment., CSIRO Water for a Healthy Country Flagship, Australia, A report to NQ Dry Tropics for the Paddock to Reef program. Wilkinson, S.N., Kinsey-Henderson, A.E., Hawdon, A.A., Hairsine, P.B., Bartley, R. and Baker, B., 2018. Grazing impacts on gully dynamics indicate approaches for gully erosion
69
Bartley et al.
control in northeast Australia. Earth Surface Processes and Landforms, 10.1002/esp.4339. Wohl, E., Lane, S.N. and Wilcox, A.C., 2015. The science and practice of river restoration. Water Resources Research: n/a-n/a, 10.1002/2014wr016874. Zhang, J., Zhang, X., Li, R., Chen, L. and Lin, P., 2017. Did streamflow or suspended sediment concentration changes reduce sediment load in the middle reaches of the Yellow River? Journal of Hydrology, 546: 357-369, http://dx.doi.org/10.1016/j.jhydrol.2017.01.002.
70
Quantifying the effectiveness of gully remediation on off-site water quality
APPENDIX 1: WATER DEPTH, TURBIDITY AND SAMPLE HISTORY FOR EACH SITE
Figure 42: Virginia Park Treatment gully runoff, turbidity, velocity and sample points on the hydrograph.
Figure 43: Virginia Park Control gully runoff, turbidity, velocity and sample points on the hydrograph.
71
Bartley et al.
Figure 44: Meadowvale Treatment gully runoff, turbidity, velocity and sample points on the hydrograph
Figure 45: Meadowvale Control gully runoff, turbidity, velocity and sample points on the hydrograph.
72
Quantifying the effectiveness of gully remediation on off-site water quality
Figure 46: Strathbogie Treatment gully runoff, turbidity and sample points on the hydrograph.
Figure 47: Strathbogie Control gully runoff, turbidity and sample points on the hydrograph.
73
Bartley et al.
Figure 48: Minnievale Treatment gully runoff, turbidity and sample points on the hydrograph.
Figure 49: Minnievale Control gully runoff, turbidity, velocity and sample points on the hydrograph.
74
Quantifying the effectiveness of gully remediation on off-site water quality
Figure 50: Mt Wickham Treatment gully runoff, turbidity and sample points on the hydrograph. Electronic issue prevented sample collection at this site for the first event. Sample marker where the sampler would have sampled.
Figure 51: Mt Wickham control gully runoff, turbidity and sample points on the hydrograph.
75
www.nesptropical.edu.au