linkage disequilibrium generated by migration is shown to be relatively small and ... strong, both linkage disequilibrium and changes in the genetic variance as a ...
Genet. Res., Camb. (2000), 76, pp. 285–293. With 3 figures. Printed in the United Kingdom # 2000 Cambridge University Press
285
Quantitative genetic models for the balance between migration and stabilizing selection
JARLE TUFTO* Department of Mathematical Sciences – Lade section, Norwegian Uniersity of Science and Technology, 7491 Trondheim, Norway (Receied 15 July 1999 and in reised form 10 Noember 1999)
Summary The evolution of a quantitative trait subject to stabilizing selection and immigration, with the immigrants deviating from the local optimum, is considered under a number of different models of the underlying genetic basis of the trait. By comparing exact predictions under the infinitesimal model obtained using numerical methods with predictions of a simplified approximate model based on ignoring linkage disequilibrium, the increase in the expressed genetic variance as a result of linkage disequilibrium generated by migration is shown to be relatively small and negligible, provided that the genetic variance relative to the squared deviation of immigrants from the local optimum is sufficiently large or selection and migration is sufficiently weak. Deviation from normality is shown to be less important by comparing predictions of the infinitesimal model with a model presupposing normality. For a more realistic symmetric model, involving a finite number of loci only, no linkage and equal effects and frequencies across loci, additional changes in the genetic variance arise as a result of changes in underlying allele frequencies. Again, provided that the genetic variance relative to the squared deviation of the immigrants from the local optimum is small, the difference between the predictions of infinitesimal and the symmetric model are small unless the number of loci is very small. However, if the genetic variance relative to the squared deviation of the immigrants from the local optimum is large, or if selection and migration are strong, both linkage disequilibrium and changes in the genetic variance as a result of changes in underlying allele frequencies become important. 1. Introduction Most species are divided into a number of smaller subpopulations connected by migration. Migration, in general, tends to homogenize a population and can prevent adaptation of subpopulations to local environmental conditions. This is a relatively well understood phenomenon when differences in fitness are caused by genes at a single locus only (e.g. Haldane, 1930 ; Slatkin, 1973, 1985 ; Nagylaki & Lucier, 1979). Most traits, however, are quantitative, that is, influenced by genes at many loci (Lande, 1982).Quantitative genetic theory involving both selection and migration, despite being an important problem, is more sparse, although some theory focusing on geographic variation in quantitative traits between demes (Bulmer, 1980, p. 180) and in clines * Tel : j47 73591888. Fax : j47 73591038. e-mail : jarlet! math.ntnu.no
(e.g. Felsenstein, 1977 ; Slatkin, 1978 ; Barton, 1999) is available. In general, exact predictions about the evolution of quantitative traits assuming Mendelian inheritance cannot be made unless a large amount of detailed information about the genetic basis of the trait is available (Barton & Turelli, 1989). For a trait determined by n diallelic loci, there are 2n different haplotypes, which, assuming random mating, implies that general analytic treatment of the effect of evolutionary forces such as selection, migration and reproduction seldom is possible. For only about 10 loci, the number of haplotypes also becomes so large that numerical analysis becomes infeasible. Similarly, while not increasing exponentially if one assumes additivity, the number of parameters to be estimated in order to make prediction based on explicit multilocus models would typically require very large amounts of data.
286
J. Tufto Quantitative genetic evolutionary theory therefore has to be based on models relying on different degrees of simplifying assumptions. The infinitesimal model (Fisher, 1918 ; Bulmer, 1980) can be seen as a way of overcoming the difficulties of explicit multilocus models by assuming that the number of loci effectively is infinite and the allelic effects at individual loci are additive and small. This approach reduces all genetic details to one parameter : the genetic variance at linkage disequilibrium VLE. Further simplifications of the infinitesimal model, based on assuming normality or by ignoring the dynamics of the genetic variance, are sometimes made in order to enable analytic treatment of models of more specific evolutionary situations. This is done, for example, in theory for the evolution of plasticity (Via & Lande, 1985 ; van Tienderen, 1997), theory of source-sink dynamics (Kirkpatrick & Barton, 1997) and in some non-spatial models (e.g. Lande et al., 1997). An important question is therefore how well these different approximations predict the evolutionary dynamics relative to more realistic models assuming finite number of loci, deviations from normality and linkage disequilibrium. Here I consider different approaches to modelling the evolution of a population subject to local stabilizing selection with one-way immigration of individuals deviating from the local phenotypic optimum. This situation arises, for example, in models of source-sink dynamics (Holt & Gomulkiewicz, 1997 a, b) and in conservation genetics in the context of reintroduction and intentional or unintentional supplementation of a wild population with individuals kept in captivity (Hindar et al., 1991). In general, both stabilizing selection and migration will generate linkage disequilibrium and consequently changes in the genetic variance. Unlike stabilizing Gaussian selection, however, migration will make the distribution of genotypic values depart from normality (e.g. Grant & Grant, 1994). More importantly, migration will also pull the genotypic mean away from the local optimum, and thereby change the underlying allele frequencies. The complexities of this situation make it a good test of the various approaches to modelling quantitative traits that have been proposed in the literature. In the first part of the paper, exact predictions for the infinitesimal model obtained using numerical methods are compared with less realistic and simpler approaches based on ignoring departures from normality and ignoring linkage disequilibrium altogether. In the latter case a simple analytic result is available. In the second part of the paper, exact results for the infinitesimal model are compared with a more realistic model involving a finite number of loci only and more specific details about the underlying genetic basis of the trait. The details of the general evolutionary situation are
as follows. In each generation, a proportion m of the population is replaced by immigrants with mean breeding value z and variance V . For simplicity, it is " " assumed that there is no linkage disequilibrium within the immigrants. This will be approximately true if the immigrants originate from a single panmictic population, deviating from the optimum as a result of, for example, artificial selection. Migration is followed by stabilizing selection with fitness of individuals with phenotype P l ZjE equal to W (P ) l exp ! (ks (Pkz )#\2) such that the mean fitness of indi! ! viduals with breeding value Z is proportional to W(Z) l exp (ks(Zkz )#\2) where 1\s l 1\s jVE. Without ! ! any loss of generality, we can let z l 0 and z l 1, ! " which is essentially equivalent to rescaling the model in terms of z- by the deviation of the immigrants from the local optimum z kz , remembering the VLE and s " ! are now measured on this new dimensionless scale. 2. The infinitesimal model The assumption of the infinitesimal model that the trait is affected by genes at an infinite number of loci with infinitesimal and additive effects implies that allele frequency changes will be infinitesimally small so that there will be no change in the genetic variance of the genotypic values at linkage disequilibrium, VLE. In addition, except for some patterns of strong linkage disequilibrium (Dawson, 1997), the distribution of genotypic values among offspring, conditional on the genotypic values X and Y of selected parents, will always be normal with expectation equal to the midparental value (XjY)\2 and variance equal to one half the genetic variance at linkage equilibrium VLE (Bulmer, 1980 ; Turelli & Barton, 1994). The full unconditional offspring distribution after reproduction, however, will depend on the distribution of parental genotypic values in the previous generation, and does not need to be normal. (i) Exact Fourier transform method Based on these general results, the joint effects of migration, stabilizing selection and recombination on the distribution genotypic values can be found numerically using the method of Turelli & Barton (1994). Let ψ(z) be the initial distribution of the trait. Migration changes this distribution to ψh(z) l (1km)ψ(z)jmψ (z), (1) " where ψ (z) is the (normal) distribution of the trait " among the immigrants. After selection the distribution of z is ψd(z) l
W(z)ψh(z) . W(z)ψh(z)
(2)
The life cycle is completed by reproduction, which is equivalent to taking the mean of two randomly
287
Quantitatie genetic models for migration and stabilizing selection After migration
After selection
After reproduction
4 2 0 4 2 0 4
Generations 1–7
2 0 4 2 0 4 2 0 4 2 0 4 2 0 –0·4
0
0·4
0·8
1·2
– 0·4
0
0·4
0·8
1·2
– 0·4
0
0·4
0·8
1·2
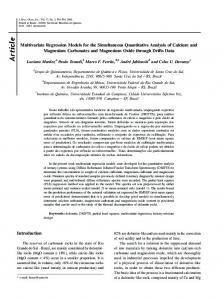
Fig. 1. Iterations of the infinitesimal mode for 7 generations (rows 1–7) with z l 0, z l 1, s l 1, m l 0n2, and ! " VLE l 0n005, that is, immigrants deviating 14 genetic standard deviations from the optimum. Each subplot shows the distribution of genotypic values (z) after migration (left-hand column), selection (middle column) and reproduction (right-hand column). F1 and F2 crosses and backcrosses with the local and immigrant population can be seen as clear modes in the distribution in generations 2 and 3. The parameter values are chosen for illustrative purposes. It might be noted that the distribution for the above parameter values eventually (after about 85 generations by the criteria in the main text) reached an equilibrium at which z- l 0n974 and Var(z) l 0n00506, that is, very little linkage disequilibrium.
selected parents X and Y sampled from (2) and adding a normal variate with zero mean and variance VLE\2. The resulting distribution, the convolution of ψd(z\2) with itself and conditional offspring distribution, can be found by taking the product of the corresponding Fourier transforms of ψd(z\2) and the appropriate normal density representing the conditional offspring distribution (for details see Turelli & Barton, 1994). These operations can be iterated numerically using discrete approximations of the above continuous distributions (Fig. 1). Equilibrium values for quantities of interest can be found by running the iterations until the change in subsequent values on the grid are sufficiently small, say 10−'. Using this method with 256 evenly spaced grid points, the numerical error, for the model iterated with s l 0 and m l 0, was at the most of the order of 10−' for the variance and 10−% for the kurtosis. A Mathematica function (Wolfram, 1996) for carrying out these calculations is available from the author.
(ii) Approximation based on normality If we ignore deviations from normality caused by migration but allow for changes in the variance
generated by migration and selection, the mean and variance after migration become z` h l (1km)z` jmz and
"
(3)
Vh l (1km)VjmV jm(1km) (zkz )#. (4) " " With both the fitness function and the density function for the distribution of genotypic values being of a Gaussian form, it follows that the distribution after selection and reproduction has mean and variance sz j(1\Vh)z` h z` d l ! sj1\Vh
(5)
and Vd l
1 1 j V . 2(1\Vhjs) 2 LE
(6)
The two non-linear equations obtained by setting z` d l z` and Vd l V can be solved numerically using, for example, the Newton–Raphson method for the equilibrium mean and variance zV and VV . The above approach is essentially the one used by Bulmer (1980, p. 180) in his treatment of geographic differentiation between two niches connected by symmetric migration and with different local optima.
288
J. Tufto (a)
VLE = 1 1
VLE = 0·1
s = 0·04
Trait mean, z
0·8 0·6
0·8 0·2
0·4
s = 0·4
0·6
0·8
0·2
2
0·4
0·6
0·8
1
100
0·4 10 0·2
0·2 0·2
20
0·6
0·4
1
VLE = 0·01 s=4
1
1
0·2
0·4
0·6
0·8
1
0·2
0·4
0·6
0·8
1
Migration rate, m (b)
VLE = 1
50
VLE = 0·1
5
VLE = 0·01
0·5 s=4
10
1
5
0·5 s = 0·4
s = 0·04
Genetic variance, V ′
0·01 0·005
0·1 0·05
1 0·5 50
0·1 0·05
0·2
0·4
0·6
0·8
1
5
0·2
0·4
0·6
0·8
1 0·5
0·5
0·4
0·6
0·8
1
0·6
0·8
1
0·8
1
20
0·1 0·05
1
10 5
0·2
2 0·2
1 0·5 50
0·2
0·4
0·01 0·005
0·1 0·05 0·6
0·8
1
5
0·2
0·4
0·6
0·8
1 0·5
0·4
100
0·1
1
10 5
0·2
10
0·5
0·05
1 0·01 0·005
0·1 0·05
1 0·5 0·2
0·4
0·6
0·8
1
0·2
0·4
0·6
0·8
1
0·2
0·4
0·6
Migration rate, m
Fig. 2. (a) The mean genotypic value (z) as a function of the migration rate (m) at equilibrium between migration and stabilizing selection for the infinitesimal model (continuous lines), the approximation ignoring deviations from normality (dashed lines) and the approximation ignoring linkage disequilibrium altogether (dotted lines). Each subplot corresponds to different values of VLE (shown in the plot) and each subset of curves within each subplot corresponds to different strengths of selection s. (b) The genetic variance corresponding to each set of curves in (a). Continuous, dashed and dotted lines as in (a).
and after selection
(iii) No linkage disequilibrium The second approximation is based on ignoring linkage disequilibrium altogether, so that the genetic variance remains constant and equal to VLE and the distribution of z remains normal. This assumption will be valid if selection and migration are sufficiently slow relative to recombination. It then follows that the mean, after migration is given by z` h l (1km)zjmz , "
(7)
sz j(1\VLE)z` h z` d l ! , sj1\VLE
(8)
which implies that the mean breeding value at equilibrium is V sz jmz ". zV l LE ! VLEsjm
(9)
This result for the above discrete-time model coincides
Quantitatie genetic models for migration and stabilizing selection with the result for the same model formulated with continuous-time. (iv) Results The equilibrium mean z` (after selection) based on the exact numerical solution, the approximation ignoring linkage disequilibrium (9), and the approximation based on ignoring deviations from normality (equations (3) to (6)) are shown in Fig. 2 a. Several points can be noted. First, for weak selection or a large genetic variance, both approximations closely match the exact results obtained using Fourier methods. In general, as the strength of selection is increased or the genetic variance VLE is reduced, however, the approximations gradually break down. The approximation incorporating the dynamics in the genetic variance caused by linkage disequilibrium in general gives a much better and, in many cases, almost perfect match to the exact numerical solution based on Fourier transforms that the approximation ignoring linkage disequilibrium altogether. For VLE l 0n01 (or equivalently, if the immigrants deviate from the optimum by 10 genetic standard deviations) it does break down, however, mainly because the distribution of z then becomes strongly non-normal. It can be further noted that the approximation which ignores linkage disequilibrium does not do too badly. For VLE l 0n1 and as long as the strength of selection s 2, the predicted deviation from the optimum differs by at most a factor of about 1n25. Because migration leads to an increase in positive linkage disequilibrium and in the genetic variance, migration will in general indirectly increase the response to selection. This is illustrated in Fig. 2 b, which shows the equilibrium variance at the point in the life cycle after migration (but before selection). The relative increase is at its largest when VLE is small and when the deviation of the mean from the immigrants, z kz` , is large. This explains why ap" proximation (9), which ignores this indirect effect, always overestimates the deviation from the equilibrium (Fig. 2 a). For small m, as a result of stabilizing selection, the variance is smaller than that at linkage equilibrium ; for strong selection the variance approaches the within-family variance of VLE\2 (Fig. 2 b, lower left subplot). As is found in models of clines in quantitative traits (Barton, 1999), the dependence of the variance on the deviation of the mean from the optimum creates a positive feedback mechanism. If the rate of migration is decreased so that the mean is allowed to adapt more closely to the optimum, the genetic variance increases, producing an increased response to selection and a further increase in the genetic variance. For small V, this creates an abrupt change in the mean z` with decreasing rates of migration m (Fig. 2 a, right-
289
hand plot). It should also be noted that Fig. 2 is based on numerical iterations with z- initially at the optimum. This gave the same result as for z` initially equal to the mean among the immigrants for nearly all parameter values. Only for small genetic variances, strong selection and high rates of migration did several equilibria appear to exist ; for example, for V l 0n01, m l 0n85 and s l 10 the iterations converged to means of z` l 0n27 and z` l 0n88 for initial values of z` l 0 and z- l 1, respectively, indicating the existence of several equilibria produced by the above positive feedback mechanism. 3. Finite number of loci n (i) A symmetric model In this section a more realistic model involving a finite number of loci is considered with the objective of evaluating the performance of the infinitesimal model when the number of loci is small. Both Barton (1992) and Phillips (1993, 1996) use models based on the assumptions that individual loci are diallelic and ‘ exchangeable ’, meaning that there is no linkage, and that the alleles, named ‘j’ and ‘k’, at different loci all have identical effects on fitness, and that allele frequencies are the same across all loci. With these assumptions, deterministic iterations of the model for large number of loci are feasible because only the frequencies of haplotypes carrying 0, 1, …, n copies of the ‘j’ allele need to be tracked, instead of the frequencies of all 2n different haplotypes. In what follows, I will refer to this as the symmetric model. The following assumption specifies a model of this form. The allelic effect of the ‘j’ and ‘k’ alleles differs by α. The allele frequencies of ‘j’ alleles are initially p in the local population and remain equal to ! p over time in the immigrant population. In order to " facilitate comparison with the infinitesimal model, we choose p and α such that the genetic variance at ! linkage equilibrium is 2nα#p (1kp ) l VLE. (10) ! ! In addition, with a reduction by a factor of θ in the variance at linkage equilibrium among the immigrants, we must have p (1kp ) " " l θ. (11) p (1kp ) ! ! Finally, because the mean breeding value differs by z kz between the locals and the immigrants, " ! 2nα(p kp ) l z kz (12) " ! " ! Equations (10), (11) and (12) have one lengthy analytical solution (which is not given here) satisfying α � 0, determining α, p and p . As a numerical ! " example, for VLE l 0n1#, θ l 0n5, z kz l 1 and n l " ! 10, this solution is p l 0n14, p l 0n93 and α l 0n063. ! "
290
J. Tufto VLE = 1 1
VLE = 0·1
s = 0·04
s = 0·4
h =1 Trait mean, z h =1/2
0·8
0·8
0·8 0·2
0·6
0·6
0·4
1
0·2
0·4
0·6
0·8
0·2
10
1
0·2
0·4
0·6
0·8
1
0·8
0·2
0·4
0·6
0·8
1
1
1 0·04
20
0·4
0·2
1
s=4
0·6
2
0·4
0·2
0·8
VLE = 0·01 1
1
0·4
4
0·8
0·2
0·6
0·6 1
0·4
0·6
2
0·2
0·2 0·2
0·4
0·6
0·8
1
20
0·4
0·4
0·2
10 0·2
0·4
0·6
0·8
1
0·2
0·4
0·6
0·8
1
Migration rate, m
Fig. 3. (a) The mean genotypic value (z) as a function of the migration rate (m) at equilibrium between migration and stabilizing selection for the infinitesimal model (continuous lines), symmetric model with 5 loci (dashed line), 2 loci (dashed dotted line) and 1 locus (dotted line). Parameters are chosen so that the genetic variances at linkage disequilibrium are the same for the initial local and immigrant population (θ l 1). The plot is otherwise organized as in Fig. 2 a. (b) Same as (a) but with θ l 1\2 instead of θ l 1.
Using these initial allele frequencies, the proportion of haplotypes carrying 1, 2, …, n ‘j’ alleles at the balance between migration and selection can be found by iterating the appropriate recursions (for details, see the appendix in Barton, 1992). These recursions are exact and take linkage disequilibrium generated by selection and migration into account. The difference between the results based on the symmetric model and the result based on the infinitesimal model iterated using Fourier transform should therefore only be a result of the discrete (non-normal) distribution of genotypic values and changes in the genetic variance as a result of changes in the underlying allele frequencies under the symmetric model. (ii) Results The genotypic mean at the balance between migration and selection for the infinitesimal model compared with the above symmetric model for 5, 2 and 1 locus is shown in Fig. 3 a with θ l 1 (equal genetic variance in the initial local and immigrant population), and in Fig. 3 b with θ l 1\2 (reduced variance among the immigrants). Several patterns can be noted. First, as the number of loci decreases, the discrepancy between predictions based on the infinitesimal and the symmetric model becomes larger. However, the infinitesimal model in general gives a remarkably good approximation to the equilibrium mean down to 2 loci for VLE � 0n1. For θ l 1, the infinitesimal model in nearly all cases overestimates the deviation from the optimum. This result is expected because differences in allele frequencies between the initial local and
immigrant population will result in increased heterozygosity when the populations are mixed, producing a further increase in the genetic variance in addition to that caused by linkage disequilibrium. This further enhances the response to selection and pulls the mean closer to the optimum. For θ l 1\2 (Fig. 3 b), a similar pattern is apparent, but with the additional effect of the reduced variance among the immigrants causing a reduction in the response to selection and a larger deviation from the optimum. For both θ l 1 and θ l 1\2, when the number of loci is small so that the genetic variance is strongly coupled with the mean through the assumption of identical allele frequencies across loci, the equilibrium mean at m l 0 somewhat surprisingly does not coincide with the phenotypic optimum. However, the effect of stabilizing selection, at least for populations in approximate linkage equilibrium, can be understood as a compromise between selection reducing the deviation of the mean from the phenotype optimum and selection reducing the genetic variance. The coupling of the genetic variance (at linkage disequilibrium) with the mean implies that selection for reduced genetic variance also leads to a shift in the mean away from the optimum. 4. Discussion Using a combination of numerical and analytic methods a number of different approaches to modelling the balance between local stabilizing selection and migration based on varying degrees of realism
291
Quantitatie genetic models for migration and stabilizing selection have been examined. In general, the discrepancy between the simplest possible approximation (9) and the symmetric model, being the most realistic model considered, is a result mainly of the increased genetic variance generated by migration and only to a small extent a result of deviations from normality. As shown by the numerical results, this error will be relatively small as long as selection is not too strong, or the deviation of the immigrants is not too large (in which case VLE would be small). Turelli (1984) reviews estimates of the strength of stabilizing selection and concludes that 1\s $ 20VE where VE is the variance of environmental effects on the phenotype. For typical heritabilities h# $ 1\2 (Mousseau & Roff, 1987), this implies that the product VLE s $ 0n05 in the model considered here (regardless of whether V and s are scaled against z kz ). This value of VLE s corresponds " ! to the weakest strengths of selection plotted in Fig. 2 a and b. Thus, if we rely on Turelli’s (1984) figure, for realistic values of s, and as long as the genetic variance is not too small relative to the z kz , the error caused " ! by ignoring linkage disequilibrium should not be large in most cases. On the other hand, according to Endler’s (1986) review, stabilizing selection can be more than an order of magnitude stronger than that suggested by Turelli (1984), in which case modelling the dynamics of the variance would become necessary. It should be noted, however, that this review may include some publication bias. In addition, sampling variance is not subtracted from the overall between species distribution of the strength stabilizing (and disruptive) selection (Endler, 1986, fig. 7.4). An additional discrepancy between (9) and the symmetric model arises as a result of changes in the underlying allele frequencies, which generate additional changes in genetic variance and produces an additional shift in the equilibrium mean. This error will be small if the number of loci influencing the traits is sufficiently large. Unless the genetic variance is too small, V 0n1 (or, equivalently, if the deviation over which evolution occurs z kz is too large), the " ! infinitesimal model provides a good approximation to the symmetric model even when the number of loci is n l 2. Based on the increased genetic variance that will be observed in the F2 generation of crosses between parental lines which have diverged in their means, the effective number of loci nE influencing quantitative traits have been estimated to be in the range from 5 up to 20 (Lande, 1981). While the actual number of loci can be much greater (Zeng, 1992), nE is the relevant parameter in the present context, because the symmetric model, like Lande’s (1981) procedure, relies on the assumption of no variation in allelic effects between loci. The above estimates therefore suggest that changes in underlying allele frequencies may be relatively unimportant in most situations. If a reduction in the genetic variance
among the immigrants is observed, say as a result of artificial selection or small effective population size, this can be modelled by adjusting the parameters of the symmetric model as in Fig. 3 b. Thus, much of the simple theory used to predict the outcome of various evolutionary situations based on ignoring the dynamics of the variance (see Section 1) may be reasonably accurate in many circumstances. The more technical assumption of the symmetric model that allele frequencies are equal across all loci may be questionable, however. Such differences can be generated by, for example, a balance between mutation and stabilizing selection, producing a ‘ U ’shaped distribution (Bulmer, 1989) or, similarly, by weak migration and population subdivision (Phillips, 1996 ; Lythgoe, 1997). First, if we allow allele frequencies to differ between loci and take into account disruptive selection at individual loci as a result of stabilizing selection on the genotypic values, the dynamics of the variance VLE will, in contrast to the situation under the symmetric model, no longer necessarily be coupled to the dynamics of the mean. In general, if we for a moment ignore linkage disequilibrium, the change in allele frequency at some locus i is given by
0
1
pq ∆pi l i i ksαi(z` kz )jsα#i (pik") km(pikpi, ), ! # " 2 (13) where pi, is the allele frequency at locus i among " immigrants (Wright, 1935 ; Barton, 1986). Because the squared allelic effects at individual loci α#i " V\n, the coefficient representing the strength of disruptive selection before the second term on the right-hand side of (13) is sα# " V s\n. The focus here has been on rates of migration of the same order of magnitude as the product between the strength of election and the genetic variance m " V s such that the mean z- is maintained at some intermediate value between z and ! z (see (9)). Thus, the strength of disruptive selection " at individual loci will be smaller than the stabilizing effect of migration by a factor approximately equal to the number of loci n. (This is not to say that we are in the realm of the infinitesimal model ; changes in allele frequencies will still be important and of the order of 1\Nn for a given genetic variance VLE and change in the mean ∆z- .) Therefore, for a moderate number of loci, and for the rates of migration considered here, a single equilibrium variance will be coupled to the equilibrium mean maintained under different parameter combinations through some functional relationship. Differences in allele frequencies between loci may give this functional relationship a complicated form, however. Under the symmetric model, the relationship between the variance at linkage equilibrium, VLE, and the mean, z- , is a simple ‘ bell-shaped ’ second-order
J. Tufto polynomial function. When allele frequencies differ between loci, the change in allele frequency at some locus i will be approximately proportional to its contribution α#i pi(1kpi) to the total variance (13). Thus, different loci will respond differently to different strengths of selection, such that the relationship between the total variance and the mean z- becomes more complex. However, in terms of observable quantities such as the mean and the variance, it seems unlikely that approximations involving more unknown parameters than the symmetric model (already having two parameters more than the infinitesimal model) will be justified from an estimation and prediction point of view. Note that this in general only applies to the genetic variance at the selection–migration equilibrium. Because different gene combinations can produce the same genotypic value (Goldstein & Holsinger, 1992), different subpopulations can be near fixation for different alleles at different loci if the rate of migration between them has been sufficiently low (Phillips, 1996). After a subsequent increase in the rate of migration there will therefore be a transitional phase during which the genetic variance may greatly increase. In conclusion, simple approximations relying on the infinitesimal model and ignoring linkage disequilibrium may in many cases provide sufficiently accurate predictions of the evolutionary dynamics. In specific situations, if more precise predictions are required, linkage disequilibrium can be taken into account numerically by solving (3) to (6). Provided that a sufficiently large number of loci of small effect are affecting the trait, as expected from theory on mutation–selection balance, predictions based on the infinitesimal model should be robust and not strongly dependent on the underlying genetic basis of the trait. I thank N. H. Barton for ideas, helpful discussion, and for providing Mathematica packages for carrying out simulations of the symmetric model. I also thank K. Hindar and the reviewers for helpful comments on the manuscript. This study was financially supported by a postdoctoral research fellowship from the Norwegian Research Council’s programme ‘ Biological diversity – Dynamics, Threats and Management ’.
References Barton, N. H. (1986). The maintenance of polygenic variation through a balance between mutation and stabilizing selection. Genetical Research 47, 209–216. Barton, N. H. (1992). On the spread of new gene combinations in the third phase of Wright’s shifting balance theory. Eolution 46, 551–557. Barton, N. H. (1999). Clines in polygenic traits. Genetical Research 74, 223–236. Barton, N. H. & Turelli, M. (1989). Evolutionary quantitative genetics – how little do we know ? Annual Reiew of Genetics 23, 337–370. Bulmer, M. (1989). Maintenance of genetic variability by
292 mutation–selection balance : a child’s guide through the jungle. Genome 31, 761–767. Bulmer, M. G. (1980). The Mathematical Theory of Quantitatie Genetics. Oxford : Clarendon Press. Dawson, K. J. (1997). Linkage disequilibrium and the infinitesimal limit. Theoretical Population Biology 52, 137–154. Endler, J. A. (1986). Natural Selection in the Wild. Princeton : Princeton University Press. Felsenstein, J. (1977). Multivariate normal genetic models with a finite number of loci. In Proceedings of the International Conference on Quantitatie Genetics (ed. E. Pollak, O. Kempthorne & J. T. B. Bailey), pp. 227–46. Ames, Iowa : Iowa State University. Fisher, R. A. (1918). The correlation between relatives under the supposition of Mendelian inheritance. Transactions of the Royal Society of Edinburgh 52, 399–433. Goldstein, D. B. & Holsinger, K. E. (1992). Maintenance of genetic variability in spatially structured populations : roles for local mating and genetic redundancy. Eolution 46, 412–429. Grant, P. R. & Grant, B. R. (1994). Phenotypic and genetic effects of hybridization in Darwin’s finches. Eolution 48, 297–316. Haldane, J. B. S. (1930). A mathematical theory of natural and artificial selection. VI. Isolation. Proceedings of the Cambridge Philosophical Society 26, 220–230. Hindar, K., Ryman, N. & Utter, F. (1991). Genetic effects of cultured fish on natural fish populations. Canadian Journal of Fisheries and Aquatic Sciences 48, 945–957. Holt, R. D. & Gomulkiewicz, R. (1997 a). The evolution of species’ niches : a population dynamic perspective. In Case Studies in Mathematical Modeling : Ecology, Physiology, and Cell Biology (ed. H. G. Othmer, F. A. Adler, M. A. Lewis & J. C. Dallon), pp. 25–50. New Jersey : Prentice Hall. Holt, R. D. & Gomulkiewicz, R. (1997 b). How does immigration influence local adaptation ? A reexamination of a familiar paradigm. American Naturalist 149, 563–572. Kirkpatrick, M. & Barton, N. H. (1997). Evolution of species’ range. American Naturalist 150, 1–23. Lande, R. (1981). The minimum number of genes contributing to quantitative variation between and within populations. Genetics 99, 541–553. Lande, R. (1982). A quantitative genetic theory of life history evolution. Ecology 63, 607–615. Lande, R., Sæther, B.-E. & Engen, S. (1997). Threshold harvesting for sustainability of fluctuating resources. Ecology 78, 1341–1350. Lythgoe, K. A. (1997). Consequences of gene flow in spatially structured populations. Genetical Research 69, 49–60. Mousseau, T. A. & Roff, D. A. (1987). Natural selection and the heritability of fitness components. Heredity 59, 181–197. Nagylaki, T. & Lucier, B. (1979). Numerical analysis of random drift in a cline. Genetics 94, 497–517. Phillips, P. C. (1993). Peak shifts and polymorphism during phase three of wright’s shifting-balance process. Eolution 47, 1733–1743. Phillips, P. C. (1996). Maintenance of polygenic variation via a migration–selection balance under uniform selection. Eolution 50, 1334–1339. Slatkin, M. (1973). Gene flow and selection in a cline. Genetics 75, 733–756. Slatkin, M. (1978). Spatial patterns in the distribution of polygenic characters. Journal of Theoretical Biology 70, 213–228.
Quantitatie genetic models for migration and stabilizing selection Slatkin, M. (1985). Gene flow in natural populations. Annual Reiew of Ecology and Systematics 16, 393–430. Turelli, M. (1984). Heritable genetic variation via mutation– selection balance : Lerch’s zeta meets the abdominal bristle. Theoretical Population Biology 25, 138–193. Turelli, M. & Barton, N. H. (1994). Genetic and statistical analysis of strong selection on polygenic traits : What, me normal ? Genetics 138, 913–941. van Tienderen, P. H. (1997). Generalists, specialists, and the evolution of phenotypic plasticity in sympatric populations of distinct species. Eolution 51, 1372–1380.
293
Via, S. & Lande, R. (1985). Genotype–environment interaction and the evolution of phenotypic plasticity. Eolution 39, 505–522. Wolfram, S. (1996). The Mathematica Book. Cambridge : Cambridge University Press. Wright, S. (1935). The analysis of variance and the correlation between relatives with respect to deviations from an optimum. Journal of Genetics 30, 243–256. Zeng, Z. B. (1992) Correcting the bias of Wright estimates of the number of genes affecting a quantitative character : a further improved method. Genetics 131, 987–1001.