Query-Driven Visualization in the Cloud with MapReduce Bill Howe
Huy Vo
Claudio Silva
University of Washington
University of Utah
University of Utah
[email protected]
[email protected]
[email protected]
1.
INTRODUCTION
We explore the MapReduce programming model for massivescale query-driven visual analytics. Massively parallel programming frameworks such as MapReduce are increasingly popular for simplifying data processing on hundreds and thousands of cores, offering fault tolerance, linear scale-up, and a high-level programming interface. However, these tools are batch-oriented and are awkward to use directly for visualization. Informed by the success and popularity of MapReduce in the database research community, we evaluate the tradeoffs of using MapReduce to support massivescale query-driven visualization, where “query" implies not just simple subsetting, but database-style algebraic manipulation. Cloud computing promises an economy of scale for hardware, power, facilities, management, and, increasingly, software by moving computation and data to large, shared data centers. Two categories of cloud computing, Software-as-a-Service (SaaS) and Infrastructure-as-a-Service (IaaS), exemplified by companies such as Force.com and Amazon, respectively, are joined by a third category, Platform-as-a-Service (PaaS) providing data management, analytics, processing, and visualization services. Most current PaaS offerings are focused on application hosting (c.f., [4]), where a programming environment backed by some form of scalable storage is provided. Increasingly, though, massively parallel data analytics and visualization are needed to accomodate the data avalanche occurring in both commerce and science. One popular tool for parallel data analytics is MapReduce [3], implemented in the open source project Hadoop [5]. The promise of Hadoop/MapReduce is that it significantly simplifies data-intensive scalable computing on thousands of cores, at least for those tasks that can be expressed in a particular way. The framework provides fault tolerance, scheduling, rack-awareness, and limited optimization in addition to parallel execution. One limitation, however, is latency – Hadoop is primarily a batch processing system. Therefore, Hadoop is not appropriate as an interactive visualization engine. Instead, it can be used as just one part of a large-scale parallel "query-driven visualization" system (c.f. [1]). For example, we use Hadoop to prepare the working set that the client interacts with, but jobs are not executed in direct response to user actions. Hadoop jobs may also be fired speculatively to prepare data "nearby" to the user’s current working set. Finally, Hadoop can be used to index or preprocess data to make it more amenable to visualization. To use MapReduce, the programmer implements two functions: map(in_key, in_val) → list(out_key, intermediate_val) reduce(out_key, list(intermediate_val)) → list(out_val) The intermediate values produced in the map phase are then sorted by out_key, in parallel, and provided to the reduce function as a group. The reduce phase then generates a single output
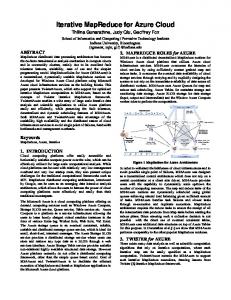
Figure 1: A section of the mouth of the Columbia River Estuary colored by salinity with a single streamline illustrating flow. This visualization is query-driven in the sense that a data manipulation step is performed prior to application of visualization algorithms. By adopting an algebraic approach, we can optimize and parallelize the data manipulation step independently of the visualization step. value. The power of this paradigm is that the programmer is only responsible for defining the program semantics over an individual data item; the framework provides the parallelism. This abstraction is not expressive enough for many visualization algorithms. In particular, algorithms requiring recursion or significant intercommunication between processes are difficult to cast as a MapReduce program. However, preliminary data processing is a natural fit. In this work, we explore the limits of this abstraction for query-driven visualization.
2.
ALGEBRAIC QUERY-DRIVEN VIZ
The data management community has begun to recognize the need for visual analytics [6], and the visualization community has begun to couple visualization techniques with remote query facilities. However, the “query" capabilities in “query-driven visualization" systems are generally limited to simple subsetting — the user specifies a region of interest as a “working set", and the system retrieves it and feeds it into visualization pipeline. We take a database-centric view of query capabilities, and argue that the more computation you can express in the data management layer, the better. Therefore, we are exploring the use of Hadoop for highlyscalable visualization pre-processing in fewer lines of code. Database researchers hold these truths to be self-evident: • It is better to move the computation to the data than the data
Operator scan/bind restrict cross merge accrete regrid/apply fixpoint
Description Associate data with an existing grid. Cull cells that do not satisfy a predicate. “Multiply" one gridfield by another. Combine multiple gridfields over their intersection. “Grow” a gridfield by adding neighboring cells. Map one gridfield onto another, aggregating values. Allow recursive execution of recipes.
Table 1: List of gridfield operators and their descriptions is implemented over a stream of 020 stencils: the data value at each vertex is replaced by the average value from adjacent vertices.
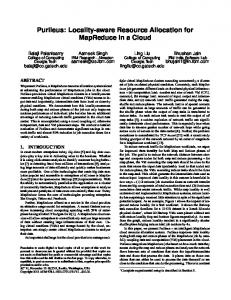
3. Figure 2: Two equivalent query plans powering the same visualization of the salinity at mouth of the Columbia River Estuary. The system can automatically derive the optimized plan at right from the unoptimized plan at left thanks to the algebraic data model. This simple optimization involves reducing the dataset size before generating the 3D structure of the data.
to the computation. • Declarative query languages are better than imperative programming languages. • Reasoning about data manipulation algebraically facilitates automatic optimization and automatic parallelization. Codd observed in 1979 that all the database products at the time were all processing tabular data, and basically used only about six underlying operations. If these operations could be formalized and made explicit, he reasoned, most of the work in accessing and manipulating data could be off-loaded to the database system instead of the programmer. Thirty years later, relational databases are a $18 billion dollar industry that powers most of the Internet. A similar revolution may be possible for visualization with an appropriate change to the underlying data model and operators — a topological mesh, not a table, is the unit of data manipulation. We have developed an algebra of mesh data called GridFields [6] to facilitate reasoning and optimization. In the context of the NSF Science and Tecnology Center for Coastal Margin Observation and Prediction [2], we formalized, implemented, and deployed the GridField data model for file-based manipulation of simulation results of the Columbia River Estuary (Figure 1). Our current effort involves porting this work to the cloud by designing parallel implementations of the GridField operators using MapReduce. The fundamental data structure of the algebra is the gridfield, an abstract data structure that separates topology from geometry and other data to expose equivalences and afford optimization. The data structure is manipulated by applying a composition of simple operators. Some of our operators are analogous to relational operators, but grid-enabled, while others are novel. For example, the restrict operator implements grid-safe subsetting, while the regrid operator maps data from one grid onto another. A list of operators in the core algebra is enumerated in Table 1. To parallelize these operators, we model a mesh as a set of keyvalue pairs in accordance with the MapReduce data model. Each key-value pair corresponds to a local topological neighborhood called a stencil. A stencil can be specified by a simple sequence of integers. The simplest stencil of the mesh vertices is written 0, while a stencil of triangles along with their vertices and adjacent triangles is written 202. Using MapReduce, we can organize and process a large mesh as a stream of stencils. For example, a smoothing filter
WORKFLOW AND PROVENANCE
To simplify the expression and management of cloud-based computations with GridFields and MapReduce, we adopt the VisTrails scientific workflow and provenance system [6]. VisTrails combines features of both workflow and visualization systems. It provides support for the creation and exploration of 3D visualizations which are required in our project. The system transparently captures all the steps in the pipeline design process: the provenance for both data products and analysis pipelines. Similar to a version control system, users can make modifications to analysis pipelines and check in their changes to a central repository. This repository be comes a sharing point, allowing others to review and merge these changes. VisTrails also provides intuitive user interfaces that allow users to explore the information in the repository, including operators allowing users to compare, refine, and extend pipeline versions. We integrated the gridfield library into VisTrails using the plug-in feature. The GridField package provides access to GridField operators as VisTrails modules, and a generalized interface for expressing MapReduce computations is under development.
4.
TALK SYNPOSIS
In the proposed talk, we will describe our experiments using MapReduce to implement algebraic query-driven visualization techniques using the NSF CluE cluster, the GridFields algebra, the VisTrails workflow and provenance system, and the Hadoop parallel data manipulation framework. We will present results from concrete examples in oceanography using multi-terabyte simulations of ocean circulation. Specifically, we will show how we used these tools to implement an example from the visualization domain (an animated isosurface extraction), the science domain (a decade-scale climate analysis), and the database domain (a parallel join and aggregate query).
5.
REFERENCES
[1] E. W. Bethel, S. Campbell, E. Dart, J. Shalf, K. Stockinger, and K. Wu. High Performance Visualization Using Query-Driven Visualization and Analytics. Technical Report LBNL/PUB-959, Lawrence Berkeley National Laboratory, Berkeley, CA, USA, 94720, July 2006. [2] NSF Center for Coastal Margin Observation and Prediction (CMOP). http://www.stccmop.org. [3] J. Dean and S. Ghemawat. MapReduce: simplified data processing on large clusters. In OSDI, 2004. [4] Google App Engine. http://code.google.com/appengine/. [5] Hadoop. http://hadoop.apache.org/. [6] B. Howe, P. Lawson, R. Bellinger, E. Anderson, E. Santos, J. Freire, C. Scheidegger, A. Baptista, , and C. T. Silva. End-to-End eScience: Integrating Workflow, Query, Visualization, and Provenance at an Ocean Observatory. In eScience, 2008.