OF THE UNIVERSITY OF MINNESOTA. BY. Seshan Srirangarajan ... I would also like to thank Professor Larry Kinney for his support and encouragement, and.
Ranging and Positioning in Wireless Sensor Networks
A DISSERTATION SUBMITTED TO THE FACULTY OF THE GRADUATE SCHOOL OF THE UNIVERSITY OF MINNESOTA BY
Seshan Srirangarajan
IN PARTIAL FULFILLMENT OF THE REQUIREMENTS FOR THE DEGREE OF DOCTOR OF PHILOSOPHY
Professor Ahmed H. Tewfik, Adviser
August 2008
c Seshan Srirangarajan 2008 °
i
Acknowledgements I would like to take this opportunity to express my gratitude to my adviser Professor Ahmed H. Tewfik, for his guidance, encouragement and advice throughout the course of my graduate studies. His insights, observations and suggestions have contributed immensely to the success of the research presented in this dissertation. I am thankful to Professor Zhi-Quan (Tom) Luo for initiating the work presented in Chapter 4 on SOCP relaxation and for serving on the preliminary oral examining committee. I would also like to thank the members of my final defense examining committee, Professor Nihar Jindal, Professor Mostafa Kaveh and Professor Yongdae Kim, for the time and effort spent by them. Their comments and suggestions have helped improve this dissertation. I would also like to gratefully acknowledge the support received from Honeywell International under the Honeywell University Affiliate Program during the first year of this research. Comments and suggestions provided by Mr. Ramakrishna Budampati and Mr. Patrick Gonia of Honeywell during this period have also contributed immensely to this research. I also thank Mr. Anoop Mathur, Dr. Soumitri Kolavennu and Mr. Steve Huseth of Honeywell for giving me the opportunity to intern with the Wireless Technologies group at the Honeywell Research Labs in Minneapolis. This provided me valuable experience of working in an industry research lab and also helped me in my own research. I am also grateful for the company of and the numerous discussions I had with my officemates Dr. Alain Tchagang, Fikri Goksu, Vikrham Gowreesunker, Dr. Faisal Shah, Dr. Firat Ince, and other fellow graduate students. I am glad to have got the opportunity to work with my friend Dr. Shah. I have learnt a lot from him and have thoroughly enjoyed working with him. The research presented in Chapter 5 of this dissertation would not have been possible without his collaboration. I would also like to acknowledge the help and support I received from my friend Ms. Shen Dong. I would also like to thank Professor Larry Kinney for his support and encouragement, and the opportunities he provided to help develop my teaching skills. I am also thankful to Professor David Lilja for the invaluable support he provided towards the end of my doctoral program. I also thank the Department of Electrical and Computer Engineering and the University of Minnesota for giving me the opportunity to pursue graduate studies. And finally, but not the least, I would like to express my deepest gratitude to my parents. I am grateful for their love and support all through these years, and for the values they inculcated
ii in me. They have not only made this doctoral degree possible but have also enabled me become a better human being.
iii
This dissertation is dedicated to
MY PAREN T S
iv
Ranging and Positioning in Wireless Sensor Networks
ABSTRACT
Ranging and positioning in wireless sensor networks refers to the ability to determine the positions of all nodes in a sensor network using the known positions of a few nodes called reference nodes and pairwise distance or range estimates between neighboring nodes. This is also known as the sensor network localization problem. In this thesis we first present two time-of-arrival based localization algorithms for indoor quasi-static environments based on statistical modeling of the ultra-wideband multipath channel. A model of the multipath channel in the form of the signal return and noise characterization is derived, and utilized to distinguish signal components from noise. The first localization algorithm uses multiple (ranging) signal receptions at each reference node, to differentiate between line-of-sight and non-line-of-sight components, and to accurately estimate the position of the line-of-sight component in the received multipath signal. The location is estimated through a mathematical programming problem formulation. The second localization algorithm employs a time-of-arrival based algorithm to obtain pseudo range estimates which are then used in a spatial domain quasi-maximum likelihood method for location estimation. Using a synthesized bandwidth of 2 GHz, a 4-bit analog-to-digital converter and with 5-10 dB signalto-noise ratio, location estimation with close to sub-meter accuracy is achieved. Furthermore, the associated range estimation error does not increase with increase in the transmitter-receiver range. We next present a distributed solution of the sensor network localization problem based on second-order cone programming relaxation. This algorithm is independent of the ranging technique being used and is computationally more efficient than most contemporary approaches, and scalable to networks with thousands of nodes. We show that the nodes can estimate their positions based on local information. Unlike previous approaches, we also consider the effect of inaccurate reference node positions. In the presence of reference node position errors, the localization is performed in three steps. First, the unlocalized nodes estimate their positions using information from their neighbors. In the second step, the reference nodes refine their positions using relative distance information exchanged with their neighbors and finally, the previously unlocalized nodes refine their position estimates. We demonstrate the convergence of the algorithm numerically. The simulation
v results, shown for both uniform and irregular network topologies, illustrate the robustness of the algorithm to reference node position and distance estimation errors. We also present the prototype implementation of a directional beacon based positioning algorithm using radio frequency signals. This algorithm allows each unlocalized node to compute its position with respect to a set of reference nodes which are equipped with rotating directional antenna. The directional beacon based algorithm eliminates the need for strict synchronization between the reference nodes and the unlocalized node. In contrast to time-of-arrival based positioning algorithms that rely on signal propagation time and bandwidth, the directional beacon based algorithm depends on the width of the antenna beampattern and the rotational speed of the directional antenna. We will show that these parameters can be optimized in a low cost solution while providing good position estimates. The system implementation is based on the GNU Radio software platform and the Universal Software Radio Peripheral as the hardware component. To deal with obstructed line-of-sight scenarios, we do not rely purely on the received signal strength and instead formulate a least squares problem to estimate the line-of-sight component in a multipath environment. These signal processing techniques yield a more accurate estimation of the bearing of the unlocalized node with respect to each of the reference nodes. We demonstrate the ability to obtain unlocalized node position estimates with sub-meter accuracy by transmitting a narrowband signal of 1 KHz bandwidth in the 2.4 GHz band. Finally, event detection scenarios in sensor networks are considered. The goal in these network deployments is to detect certain critical or emergency conditions with minimum possible delay. We propose a heuristic based sensor selection and a sequential detection procedure that significantly improves the detection speed, measured in terms of the number of measurements needed for detection. In the proposed model, the fusion center selects one sensor at a time for measurement while maximizing a greedy heuristic. Instead of collecting a fixed number of measurements, the fusion center collects one measurement at each time step, until by some sequential decision rule the collection stops and a decision is made. The sequential detection procedure significantly outperforms a non-sequential (or fixed sample size) detector in that it always needs fewer measurements on average to achieve the same detection performance. In addition, we derive a simplified heuristic under the Gaussian probabilistic model. It is seen that the simplified heuristic performs as good as or slightly better than the greedy heuristic. The greedy heuristic based sensor selection provides a general framework for probabilistic models where a simplified heuristic is difficult to obtain.
vi
Contents Acknowledgements
i
Dedication
iii
Abstract
iv
List of Tables
x
List of Figures
xi
1 Introduction
1
1.1
Motivation
. . . . . . . . . . . . . . . . . . . . . . . . . . . . . . . . . . . . . . . .
1
1.2
Contributions and Thesis Organization . . . . . . . . . . . . . . . . . . . . . . . . .
2
1.2.1
Localization Algorithms for UWB Multipath Environments . . . . . . . . .
2
1.2.2
Distributed Sensor Network Localization using SOCP Relaxation . . . . . .
3
1.2.3
Implementation of a Directional Beacon based Positioning Algorithm . . . .
4
1.2.4
Sensor Selection and Event Detection using Heuristic based Sequential Hypothesis Testing . . . . . . . . . . . . . . . . . . . . . . . . . . . . . . . . .
2 Related Work
4 6
2.1
Localization in UWB Multipath Environments . . . . . . . . . . . . . . . . . . . .
6
2.2
Sensor Network Localization using Optimization Techniques . . . . . . . . . . . . .
7
2.3
Range-Free Sensor Network Localization Approaches . . . . . . . . . . . . . . . . .
9
2.4
Directionality based Position Location Algorithms . . . . . . . . . . . . . . . . . .
10
2.5
Sensor Selection and Event Detection Schemes . . . . . . . . . . . . . . . . . . . .
10
vii 3 Localization Algorithms for UWB Multipath Environments
12
3.1
Localization Model . . . . . . . . . . . . . . . . . . . . . . . . . . . . . . . . . . . .
13
3.2
Statistical Modeling: Offline Calibration Phase . . . . . . . . . . . . . . . . . . . .
15
3.3
Ranging and Location Estimation Algorithm using Multiple Signal Receptions . .
16
3.3.1
Overview of the Ranging Approach . . . . . . . . . . . . . . . . . . . . . . .
16
3.3.2
Identifying Candidate LOS Component . . . . . . . . . . . . . . . . . . . .
16
3.3.3
Location Estimation Algorithm . . . . . . . . . . . . . . . . . . . . . . . . .
21
Spatial Domain Quasi-Maximum Likelihood Location Estimation Algorithm . . . .
22
3.4.1
Identifying Pseudo Range Estimates . . . . . . . . . . . . . . . . . . . . . .
24
3.4.2
Location Estimation Algorithm using Pseudo Range Estimates . . . . . . .
24
Simulation Results . . . . . . . . . . . . . . . . . . . . . . . . . . . . . . . . . . . .
27
3.5.1
Location Estimation Algorithm using Multiple Signal Receptions . . . . . .
27
3.5.2
Spatial Domain Quasi-Maximum Likelihood Location Estimation Algorithm
30
Conclusion . . . . . . . . . . . . . . . . . . . . . . . . . . . . . . . . . . . . . . . .
32
3.4
3.5
3.6
4 Distributed Sensor Network Localization using SOCP Relaxation
33
4.1
Sensor Network Localization: Problem Formulation . . . . . . . . . . . . . . . . . .
34
4.2
Distributed SOCP Localization Algorithm . . . . . . . . . . . . . . . . . . . . . . .
35
4.3
Localization with Accurate Reference Node Position Information . . . . . . . . . .
37
4.4
Localization with Reference Node Position Errors . . . . . . . . . . . . . . . . . . .
42
4.5
Tracking a Mobile Sensor Node . . . . . . . . . . . . . . . . . . . . . . . . . . . . .
46
4.6
Asynchronous Distributed Algorithm . . . . . . . . . . . . . . . . . . . . . . . . . .
52
4.6.1
Synchronous vs. Asynchronous . . . . . . . . . . . . . . . . . . . . . . . . .
52
4.6.2
Localization with fewer RNs using the asynchronous algorithm . . . . . . .
52
Conclusion . . . . . . . . . . . . . . . . . . . . . . . . . . . . . . . . . . . . . . . .
56
4.7
5 Implementation of a Directional Beacon based Positioning Algorithm 5.1
5.2
57
Localization Principle, Signal Model and Positioning Algorithm . . . . . . . . . . .
58
5.1.1
Localization Principle and System Model . . . . . . . . . . . . . . . . . . .
58
5.1.2
Signal Model . . . . . . . . . . . . . . . . . . . . . . . . . . . . . . . . . . .
59
5.1.3
Directional Beacon based Positioning Algorithm . . . . . . . . . . . . . . .
60
Prototype Implementation . . . . . . . . . . . . . . . . . . . . . . . . . . . . . . . .
61
viii
5.3
5.4
5.5
5.6
5.2.1
Hardware Platform . . . . . . . . . . . . . . . . . . . . . . . . . . . . . . . .
62
5.2.2
Software Platform . . . . . . . . . . . . . . . . . . . . . . . . . . . . . . . .
63
5.2.3
Experimental Setup . . . . . . . . . . . . . . . . . . . . . . . . . . . . . . .
63
5.2.4
Data Collection and Processing . . . . . . . . . . . . . . . . . . . . . . . . .
64
Signal Detection and Enhanced Amplitude Estimation . . . . . . . . . . . . . . . .
65
5.3.1
Signal Detection . . . . . . . . . . . . . . . . . . . . . . . . . . . . . . . . .
65
5.3.2
Enhanced Amplitude Estimation . . . . . . . . . . . . . . . . . . . . . . . .
66
Estimating the LOS Component in Multipath Environment . . . . . . . . . . . . .
67
5.4.1
LOS Estimation using Data from Multiple Repeated Antenna Rotations . .
69
Experimental Results . . . . . . . . . . . . . . . . . . . . . . . . . . . . . . . . . . .
70
5.5.1
Estimation of Amplitude Profile . . . . . . . . . . . . . . . . . . . . . . . .
70
5.5.2
Estimation of the LOS Component . . . . . . . . . . . . . . . . . . . . . . .
71
5.5.3
Position estimation and lower bound on estimation error variance . . . . . .
74
5.5.4
Effect of Time Delay Estimation, Synchronization and Motor Speed Step Errors on Position Estimation . . . . . . . . . . . . . . . . . . . . . . . . . .
75
Conclusion . . . . . . . . . . . . . . . . . . . . . . . . . . . . . . . . . . . . . . . .
76
6 Sensor Selection and Event Detection using Heuristic based Sequential Hypothesis Testing
78
6.1
Sensor Selection and Event Detection: System Model . . . . . . . . . . . . . . . . .
79
6.2
Binary Sequential Hypothesis Testing . . . . . . . . . . . . . . . . . . . . . . . . .
80
6.3
Greedy Heuristic based Sensor Selection . . . . . . . . . . . . . . . . . . . . . . . .
81
6.3.1
Greedy sensor selection and sequential detection . . . . . . . . . . . . . . .
82
6.4
Optimal Sensor Selection . . . . . . . . . . . . . . . . . . . . . . . . . . . . . . . .
83
6.5
Analytical Evaluation under Gaussian Modeling . . . . . . . . . . . . . . . . . . . .
84
6.5.1
Homogeneous Model: Each sensor has the same variance across hypotheses
85
6.5.2
Heterogeneous Model: Each sensor has different variance across hypotheses
86
Sensor Selection based on Distance between Hypotheses: Simplified Heuristic . . .
86
6.6.1
Homogeneous Model . . . . . . . . . . . . . . . . . . . . . . . . . . . . . . .
86
6.6.2
Heterogeneous Model . . . . . . . . . . . . . . . . . . . . . . . . . . . . . .
87
Fixed Sample Size Detector . . . . . . . . . . . . . . . . . . . . . . . . . . . . . . .
88
6.7.1
88
6.6
6.7
Homogeneous Model . . . . . . . . . . . . . . . . . . . . . . . . . . . . . . .
ix 6.7.2
Heterogeneous Model . . . . . . . . . . . . . . . . . . . . . . . . . . . . . .
89
6.8
Sensor Selection for M-ary Hypothesis Testing . . . . . . . . . . . . . . . . . . . . .
89
6.9
Sensor Selection and Detection Performance under Gaussian Modeling . . . . . . .
91
6.9.1
Performance under Homogeneous Model . . . . . . . . . . . . . . . . . . . .
92
6.9.2
Performance under Heterogeneous Model . . . . . . . . . . . . . . . . . . .
93
6.9.3
M-ary Hypothesis Testing . . . . . . . . . . . . . . . . . . . . . . . . . . . .
95
6.10 Conclusion . . . . . . . . . . . . . . . . . . . . . . . . . . . . . . . . . . . . . . . .
97
7 Conclusions and Future Directions
98
7.1
Conclusions . . . . . . . . . . . . . . . . . . . . . . . . . . . . . . . . . . . . . . . .
98
7.2
Future Directions . . . . . . . . . . . . . . . . . . . . . . . . . . . . . . . . . . . . .
99
7.2.1
Implementation of Localization Algorithms for UWB Multipath Environments 99
7.2.2
Distributed SOCP Algorithm for RSSI based Localization . . . . . . . . . .
99
7.2.3
Sensor Selection with Unknown Parameters and other Probabilistic Models
100
APPENDICES
101
A SOCP Problem Formulation in SeDuMi form
101
B Lower Bound on Position Estimation Error Variance
103
C Gaussian Modeling for Binary Hypothesis Testing
106
BIBLIOGRAPHY
108
x
List of Tables 4.1
Distributed SOCP: Input parameters for the test cases, corresponding SOCP (4.5) dimensions and CPU times. (p gives the percentage of reference nodes, and Noise figure nfd = 0.05 for all test cases). . . . . . . . . . . . . . . . . . . . . . . . . . . .
4.2
MDS-MAP(P, R): Input parameters for the test cases and CPU times. (p gives the percentage of reference nodes, and Noise figure nfd = 0.05 for all test cases). . . .
4.3
43
Simulation parameters for the tracking results. f is the fading coefficient, total number of RNs = 8, nfa = 0.10 for all test runs. . . . . . . . . . . . . . . . . . . .
4.4
43
48
Comparison of Synchronous and Asynchronous Algorithm Execution. Simulation parameters: n = 1000, nfd = 0.05, nfa = 0.10, p = 0.15, RadioRangeRef = 0.15, RadioRangeSensor = 0.10. . . . . . . . . . . . . . . . . . . . . . . . . . . . . . . .
4.5
53
Comparison of different localization algorithms on random Uniform networks. L represents the number of iterations needed for the algorithm to converge (typically a small number). † Experimental data and results from [1]. ‡ Simulation results from [2].
. . . . . . . . . . . . . . . . . . . . . . . . . . . . . . . . . . . . . . . . .
55
xi
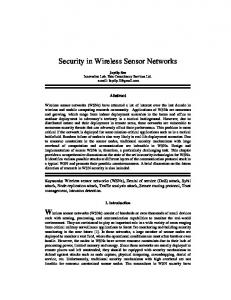
List of Figures 3.1
Block diagram of the proposed UWB ranging and localization system. . . . . . . .
14
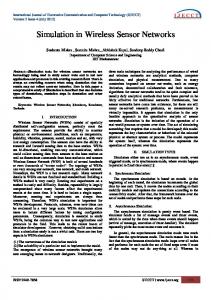
3.2
Matched-filter output in the presence of Gaussian noise. . . . . . . . . . . . . . . .
15
3.3
Relative strength (ρ) distribution for the: (a) signal (LOS/NLOS) peaks and (b) noise peaks. . . . . . . . . . . . . . . . . . . . . . . . . . . . . . . . . . . . . . . . .
3.4
17
Time difference (δ) distribution for the: (a) signal (LOS/NLOS) peaks and (b) noise peaks. . . . . . . . . . . . . . . . . . . . . . . . . . . . . . . . . . . . . . . . . . . .
18
3.5
Illustration of Likelihood evaluation. . . . . . . . . . . . . . . . . . . . . . . . . . .
20
3.6
Illustration of Likelihood function evaluation. . . . . . . . . . . . . . . . . . . . . .
21
3.7
Location Estimation with 1 NLOS range estimate (M = 1). . . . . . . . . . . . . .
23
3.8
Pseudo range estimates from 4 RNs to an unlocalized node; the UN is located at the intersection of the LOS ranges. . . . . . . . . . . . . . . . . . . . . . . . . . . .
25
Range estimation error vs. TX-RX distance using multiple signal receptions. . . .
29
3.10 Range estimation error vs. SNR using multiple signal receptions. . . . . . . . . . .
29
3.11 Range estimation error histogram. . . . . . . . . . . . . . . . . . . . . . . . . . . .
30
3.9
3.12 Position estimation results from 5 trials using the spatial domain QML location estimation algorithm. True locations of the RN (¦) and UN (◦) along with the estimated UN locations (+). Solid lines indicate the error between the estimated and true UN locations. The node locations for each of the 5 trials are numbered distinctly. . . . . . . . . . . . . . . . . . . . . . . . . . . . . . . . . . . . . . . . . .
31
3.13 Position estimation error vs. SNR using spatial domain QML location estimation algorithm. . . . . . . . . . . . . . . . . . . . . . . . . . . . . . . . . . . . . . . . . .
31
xii 4.1
Distributed SOCP results for Uniform topology: n = 500, RadioRange = 0.15, p = 0.15 and nfd = 0.05. err = 0.032 and errmax = 0.232. True positions of the UNs (◦) and RNs (¦) along with the estimated node positions (+). The solid lines indicate the error between the estimated and true UN positions. . . . . . . . . . .
4.2
39
Average positioning error as a function of the network size (n) for two different percentages of RNs. (RadioRange = 0.10, nfd = 0.05 and average node connectivity ≈ 30) . . . . . . . . . . . . . . . . . . . . . . . . . . . . . . . . . . . . . . . . . . .
4.3
Average positioning error as a function of RadioRange. (n = 1000, p = 0.15 and nfd = 0.05) . . . . . . . . . . . . . . . . . . . . . . . . . . . . . . . . . . . . . . . .
4.4
40
40
Distributed SOCP results for irregular (C-shaped) topology: n = 300, RadioRange = 0.15, p = 0.15 and nfd = 0.05. err = 0.048 and errmax = 0.448. True positions of the UNs (◦) and RNs (¦) along with the estimated node positions (+). The solid lines indicate the error between the estimated and true UN positions.
4.5
. . . . . . .
Average positioning error as a function of the Noise Factor nfd . (n = 500, RadioRange = 0.15, p = 0.15 and nfa = 0.10) . . . . . . . . . . . . . . . . . . . . . . . . . . . . .
4.6
45
Average positioning error as a function of nfa and p. (n = 500, RadioRange = 0.10 and nfd = 0.01) . . . . . . . . . . . . . . . . . . . . . . . . . . . . . . . . . . . . . .
4.7
41
45
Average UN positioning error as a function of the radio range of the reference nodes (RadioRangeRef ). (n = 1000, p = 0.15, nfd = 0.05, nfa = 0.10, RadioRangeSensor = 0.10) . . . . . . . . . . . . . . . . . . . . . . . . . . . . . . . . . . . . . . . . . . . .
4.8
47
Distributed SOCP results for irregular (C-shaped) topology: n = 300, RadioRangeSensor = 0.15, RadioRangeRef = 0.20, p = 0.15 and nfd = 0.05. err = 0.031 and errmax = 0.444. True positions of the UNs (◦) and RNs (¦) along with the estimated node positions (+). The solid lines indicate the error between the estimated and true UN positions. . . . . . . . . . . . . . . . . . . . . . . . . . . . . . . . . . . . . . . . . .
4.9
48
Distributed SOCP results for irregular (C-shaped) topology: n = 300, RadioRangeSensor = 0.15, RadioRangeRef = 0.25, p = 0.15 and nfd = 0.05. err = 0.025 and errmax = 0.429. True positions of the UNs (◦) and RNs (¦) along with the estimated node positions (+). The solid lines indicate the error between the estimated and true UN positions. . . . . . . . . . . . . . . . . . . . . . . . . . . . . . . . . . . . . . . . . .
49
xiii 4.10 Tracking Results: Circles (◦) on the [−0.5, 0.5]2 square grid represent the true RN positions, the diamonds (¦) represent the inaccurate RN positions used for the experiments. ⊕ indicates mobile node positions along the actual path. Solid lines indicate the actual path followed by the mobile node. Estimated paths are indicated by dash-dot lines for test run 1 and dotted lines for test run 2. (Test Run 1: nfd = 0.15, f = 0.50. Test Run 2: nfd = 0.15, f = 0.40 ) . . . . . . . . . . . . . .
50
4.11 Tracking Results: Circles (◦) on the [−0.5, 0.5]2 square grid represent the true RN positions, the diamonds (¦) represent the inaccurate RN positions used for the experiments. ⊕ indicates mobile node positions along the actual path. Solid lines indicate the actual path followed by the mobile node. Estimated paths are indicated by dash-dot lines for test run 3 and dotted lines for test run 4. (Test Run 3: nfd = 0.10, f = 0.50. Test Run 4: nfd = 0.10, f = 0.40) . . . . . . . . . . . . . . .
51
4.12 Asynchronous distributed SOCP using low percentage of RNs: n = 500, p = 0.05, RadioRangeRef = 0.16, RadioRangeSensor = 0.16, nfd = 0.10 and nfa = 0. Positioning error err = 0.0346. True positions of the UNs (◦) and RNs (¦) along with the estimated node positions (+). The solid lines indicate the error between the estimated and true UN positions. . . . . . . . . . . . . . . . . . . . . . . . . . .
54
5.1
Arrangement of the reference nodes and the coordinate system. . . . . . . . . . . .
59
5.2
Hardware setup for the transmitter (or RN) with rotating directional antenna. . .
62
5.3
Hardware setup for the receiver (or UN). . . . . . . . . . . . . . . . . . . . . . . . .
62
5.4
Experimental Setup: The unlocalized node whose position is to be determined. . .
63
5.5
Experimental Setup: The reference node equipped with directional antenna. . . . .
64
5.6
Post processing of the experimental data using statistical signal processing techniques. 65
5.7
Received signal from 90◦ rotation of the RN-2. . . . . . . . . . . . . . . . . . . . .
71
5.8
Estimated amplitude profile of the received signal from RN-2 (Fig. 5.7). . . . . . .
72
5.9
Experimental results based on the received signal from RN-3. . . . . . . . . . . . .
73
5.10 Position estimation error variance as a function of the number of rotations of the antenna. . . . . . . . . . . . . . . . . . . . . . . . . . . . . . . . . . . . . . . . . . .
75
5.11 Comparison of the Directional Beacon and TOA based position estimation methods in terms of their sensitivity to time delay estimation error. . . . . . . . . . . . . . .
77
xiv 6.1
Typical Wireless Sensor Network System Model . . . . . . . . . . . . . . . . . . . .
6.2
Optimal sensor selection with two sensors (or observation/data sources) for n time
80
steps. yiki represents the sample observation from the kith sensor at the ith time step. 84 6.3
Comparison of the greedy heuristic based sensor selection with the optimal sensor selection. . . . . . . . . . . . . . . . . . . . . . . . . . . . . . . . . . . . . . . . . .
92
6.4
Gaussian Homogeneous Model with time invariant mean. . . . . . . . . . . . . . .
93
6.5
Gaussian Homogeneous Model with time varying mean. . . . . . . . . . . . . . . .
94
6.6
Gaussian Homogeneous Model with time varying mean for the case with four sensors (N = 4). . . . . . . . . . . . . . . . . . . . . . . . . . . . . . . . . . . . . . . . . . .
94
6.7
Gaussian Heterogenous Model with time invariant mean. . . . . . . . . . . . . . . .
95
6.8
Gaussian Heterogenous Model with time varying mean. . . . . . . . . . . . . . . .
96
6.9
M-ary sequential hypothesis testing. Three hypotheses and two sensors (M = 3, N = 2). Sensor-selection strategy 1: maximally separate most likely hypothesis from all other hypotheses. Sensor-selection strategy 2: maximally separate the two most likely hypotheses. . . . . . . . . . . . . . . . . . . . . . . . . . . . . . . . . . . . . .
96
1
Chapter 1
Introduction Advances in low-power circuit design, simple yet reasonably efficient wireless communication equipment, reduced manufacturing costs and relative ease of deployment has made wireless communication technology ubiquitous. Ranging and location awareness are desirable features in a wireless network, with applications in asset tracking, locating people in emergency situations and robotics. Ranging refers to the ability to determine the distance between two neighboring nodes and location awareness refers to the knowledge of a nodes’ position. Recent years have also seen wireless sensor networks become extremely popular with the largescale deployment of these networks with thousands of sensor nodes [3]. These networks typically combine wireless communication components, minimal computation capabilities and some sensing of the physical environment into a network that can be deeply embedded into the physical environment. All these components together in a single device form a sensor node. Some of the application areas for sensor networks are industrial automation (process control), military (realtime monitoring of troop movements), utilities (automated meter reading), building control and environmental monitoring [4].
1.1
Motivation
Sensor nodes measure some physical quantity(s) at a given position. In most applications, the data reported by the sensors is relevant only if tagged with the accurate location of the sensor nodes. Thus knowledge of the node positions becomes imperative. Using nodes equipped with Global
2 Positioning System (GPS) is a costly option. The location awareness feature is also emphasized in the IEEE 802.15.4a wireless personal area networks [5]. The principle interest of this standard is to provide communications and high precision ranging/location capability with 1 m accuracy or better. Position location in wireless personal area networks (WPANs) has found a number of applications ranging from commercial and residential (tracking people in assisted-living places and assets in a manufacturing facility) to public safety and military (tracking fire fighters and soldiers during their missions) [6]. The sensor network localization problem can be stated as follows. Assuming knowledge of the positions of some nodes and some pairwise distance measurements, determine the position of all nodes in the network. We will refer to nodes whose positions are known a priori as the reference nodes (RN) and nodes whose positions are unknown as the unlocalized nodes (UN). The sensor network localization problem typically consists of two main sub-problems: (i) the ranging sub-problem, to determine the distance (or range) between two neighboring nodes and (ii) the positioning sub-problem, to determine the position or location of the nodes given some pairwise distances. This thesis examines several problems related to positioning in wireless networks with specific focus on wireless sensor networks. In Chapter 3 we present localization algorithms based on statistical modeling of the ultra-wideband physical layer channel. In Chapter 4 we present a distributed solution of the positioning sub-problem. This algorithm, based on second-order cone programming relaxation, is independent of the ranging technique used to obtain the pairwise distances. Chapter 5 presents the prototype implementation of a directional beacon-based positioning algorithm and signal processing solutions for the analysis of the experimental data. In Chapter 6 we focus on the problem of selecting sensors for measurement in event detection scenarios so as to achieve faster detection while meeting certain performance criterion.
1.2 1.2.1
Contributions and Thesis Organization Localization Algorithms for UWB Multipath Environments
The use of ultra-wideband (UWB) communications at the physical layer of wireless systems allows for very precise ranging due to the high time resolution of UWB signals. In indoor environments the presence of reflectors and obstructions between the transmitter and receiver results in multiple
3 copies of the transmitted signal being received at the receiver. This phenomenon is known as multipath propagation. The high time resolution of UWB signals aids in mitigating the effect of multipath propagation. The signal received following the direct path from the transmitter to the receiver is referred to as the line-of-sight (LOS) component. The signals received following reflection, scattering etc are referred to as the non-line-of-sight (NLOS) components. In Chapter 3 we present two time-of-arrival (TOA) based localization algorithms for indoor quasi-static environments based on statistical modeling of the ultra-wideband multipath channel. A statistical model of the multipath channel in the form of the signal return and noise characterization is derived. The first algorithm uses multiple (ranging) signal receptions to distinguish signal components (LOS/NLOS) from noise and accurately estimate the LOS component. The second algorithm fuses the range and position estimation phases in such a way that the geometric relationship between the TOAs aids in the range estimation as well. Using a bandwidth of 2 GHz, a 4-bit analog-to-digital converter and with 5-10 dB signal-to-noise ratio, location estimation with close to sub-meter accuracy is achieved. It will also be shown that the associated range estimation error does not increase with increase in the transmitter-receiver range [7, 8, 9].
1.2.2
Distributed Sensor Network Localization using SOCP Relaxation
In Chapter 4 we focus on the positioning sub-problem. The distance measurements between neighboring nodes can be obtained via time of arrival (TOA) [10, 11], time difference of arrival (TDOA) [12], angle of arrival (AOA) [13], received signal strength (RSS) [14] or other techniques [15, 16]. However due to the resource constraints on the sensor nodes the distance measurements are inaccurate or noisy. In addition, the reference node positions may be inaccurate even when determined with the use of GPS or other techniques. Most approaches in the literature do not account for inaccuracies in the reference node positions. The computational efficiency and scalability of the algorithms are important considerations in addition to the localization accuracy. A number of methods, based on minimizing some global error function, have been explored to account for the measurement uncertainties. It is observed that the computational complexity varies based on the optimization model chosen. We present a distributed algorithm, based on the second-order cone programming (SOCP) relaxation, to determine the position of all nodes in the network given a few reference nodes and some pairwise distance measurements. This algorithm is independent of the ranging technique used
4 to obtain pairwise distances between neighboring nodes. An extensive simulation study, on uniform and irregular network topologies, will be presented demonstrating the robustness of the proposed algorithm to reference node position and distance estimation errors. The performance gains, in terms of problem size reduction and computational efficiency, are achieved without sacrificing localization accuracy [17, 18].
1.2.3
Implementation of a Directional Beacon based Positioning Algorithm
In Chapter 5 we present the implementation of a directional beacon based positioning algorithm using radio frequency (RF) signals. The existing localization systems can be broadly classified into two categories. The first category consists of systems which develop a signaling system and support infrastructure focused primarily on the positioning and tracking application. Systems in the second category tend to use existing wireless network infrastructure with minimal modifications to locate unlocalized nodes. The first category systems are designed for a desired positioning accuracy and tend to use expensive, dedicated devices for the purpose. Examples of such systems include GPS. The second category of systems, in the absence of dedicated devices, use smart algorithms to overcome the low accuracy of the measured quantities. We demonstrate a system that fits in this second category. In the proposed implementation each UN computes its position with respect to a set of RNs equipped with rotating directional antenna. This algorithm does not need synchronization between RNs and the UN. We demonstrate the ability to obtain UN position estimates with sub-meter accuracy by transmitting a narrowband signal of 1 KHz bandwidth in the 2.4 GHz band [19, 20]. This implementation will be shown to be resilient to timing and synchronization errors.
1.2.4
Sensor Selection and Event Detection using Heuristic based Sequential Hypothesis Testing
The development of extremely small sensing devices has led to the use of large scale networks of these devices in numerous applications. Sensor nodes have enabled us to monitor/detect environments that have not been reachable until now. Sensor networks are typically designed to monitor physical environments for days, months or even years. To obtain a complete picture of
5 the environment it is desirable to collect information from all sensor nodes in the network. On the other hand, sensor networks have energy constraints that do not allow taking measurements from many sensors and transmitting these measurements reduces the network lifetime. Thus, in order to extend the network lifetime it is essential to carefully select the sensor nodes from which information will be collected. Several algorithms have been proposed in the literature for sensor selection. In Chapter 6 sensor networks used for event detection scenarios are considered. The goal in these network deployments is to detect certain critical events or emergency conditions with minimum possible delay. We propose a heuristic based sensor selection and a sequential detection procedure that significantly improves the detection speed, measured in terms of the number of measurements needed for the detection.
6
Chapter 2
Related Work 2.1
Localization in UWB Multipath Environments
Ranging and location estimation in wireless networks has received considerable attention from the research community recently. Some survey articles on the research area and its applications are [15, 16, 21, 4]. Traditional localization techniques use one or more of the following measures: received signal strength (RSS) indicators [14], time of arrival (TOA) [10, 11], time difference of arrival (TDOA) [12], or angle of arrival (AOA) [13]. Techniques based purely on signal strength are prone to inaccuracies and large variances in position estimates [6, 22]. TOA/TDOA techniques using ultrasound signals have also been explored. These provide limited range and need additional hardware. Ultra-wideband (UWB) signals have been employed in position location systems [10, 11, 23, 24]. The use of ultra-wideband (UWB) communications allows for very precise ranging due to the high time resolution of UWB signals. However the presence of multipath components in the received signal due to non-line-of-sight (NLOS) propagation makes the problem of estimating the line-of-sight (LOS) position and determining the range especially challenging. The LOS time delay estimation and hence positioning accuracy is inversely proportional to the bandwidth of the signals and inversely proportional to the square root of the observation time [25]. Most of the work reported in the literature is based on assumptions that the line-of-sight (LOS) signal is always present [10, 11]. In [10] it is assumed that the LOS component is the earliest arrival and a threshold is used in a window of the received signal to estimate the LOS component. The results showed that the estimation error increases rapidly with the transmitter
7 (TX) - receiver (RX) range. These approaches, despite using bandwidths in excess of 1 GHz, do not achieve the sub-meter (< 1 m) ranging accuracy that some applications require. Many approaches have been proposed in the literature that attempt to find some distinct properties of NLOS range measurements to distinguish them from LOS measurements [26, 27, 28]. In [26] it is observed that the NLOS range measurements have greater variance than the LOS measurements. Reference [27] models NLOS and LOS range measurements as Gaussian random variables, and derives the theoretical framework for nonparametric and parametric hypothesis tests. In [28], the authors present an algorithm to detect LOS measurements when NLOS error is intermittently present in a time series of range measurements. These attempts and our own work on NLOS identification suggest that using pure statistical characteristics to distinguish NLOS measurements from LOS measurements is a difficult problem. Location estimation algorithms for NLOS propagation have been studied in the literature. In [29] the property that NLOS errors are always positive is used to estimate the location by adding some constraints or penalty function.
2.2
Sensor Network Localization using Optimization Techniques
Sensor network localization has been an area of active research in recent years with a large number of current and future applications. Most localization systems estimate the node positions using some kind of range or distance information between nodes. However, some systems such as [21] perform localization using connectivity information. Such systems depend on a high density of reference nodes (RNs) and result in relatively low positioning accuracy. It will be shown in Chapter 4 that the localization problem in its original form is a nonconvex optimization problem with many local minima. Doherty et al. in [30] formulate the localization problem as a feasibility problem with convex radial constraints. However, this method requires centralized computation which is not suitable for large-scale networks. Shang proposed a distributed localization method MDS-MAP(P, R) based on multi-dimensional scaling (MDS) [2]. This method builds for each node a local map of the small sub-network in the node’s vicinity and then merges these local maps to form a global map followed by a refinement step. This method needs only a few RNs (or in the absence of RNs generates a relative map) and partly overcomes the drawback associated with centralized computation. However, the construction of local maps for
8 each node results in enormous amount of redundant computation as it is seen that most local maps are not used in building the global map. MDS-MAP(P, R) is not entirely suitable for large networks as the cost of refining and merging the local maps grows faster than linear due to the larger maps being manipulated. Also the cost of refining the global map, a single global optimization step, becomes dominant for large networks. Costa et al. [1] apply distributed weighted MDS (dwMDS) to the sensor network localization problem and formulate the problem using a general form of the cost function we use in Chapter 4. They solve the minimization problem using majorizing functions. Biswas and Ye solve the problem using the semidefinite programming (SDP) relaxation [31]. The SDP relaxation approach can solve small problems effectively. The authors report a few seconds of PC execution time for a 50 node network. They have also proposed two techniques to improve the accuracy of the SDP solution [32]. The first technique adds a regularization term to the objective function to force the SDP solution to lie close to a low dimensional subspace of Rd and the second technique improves the SDP estimated solution using a gradient-descent method. ¡ ¢ However, the number of constraints in the SDP model is O n2 , where n is the number of nodes in the network Most SDP solvers can handle problems with at most 100 variables, while sensor networks typically have 100’s of nodes resulting in problem dimensions in the 10,000’s. To overcome this difficulty, Biswas and Ye proposed a distributed method for solving the SDP [33]. In this iterative distributed scheme, the RNs are first partitioned into many clusters according to their physical locations. A sensor is assigned to a cluster if the sensor has a direct link to one of the RNs. Then semidefinite programs are solved independently for each cluster. The nodes whose position becomes known are used to iteratively locate the remaining unlocalized nodes (UNs). The authors report a few minutes of PC execution time for a network with 4000 nodes. But, since the clustering is done based on geographic locations [34], each cluster may have only partial connection information for the border nodes if these have connections with multiple clusters. Thus nodes on the border of each cluster may not get positioned accurately [35]. We consider the second-order cone programming (SOCP) relaxation due to its simpler structure and the potential to be solved faster. The SOCP relaxation for the localization problem was first studied by Tseng [36]. It has been shown in [36] that even though the SOCP relaxation is weaker than the SDP relaxation, it can accurately position a large percentage of the sensors up to the
9 square root of the distance error. The localization approach presented in Chapter 4 enables the SOCP relaxation problem to be solved in a completely distributed fashion. Each UN executes the localization algorithm independently using distance information to the RNs and nodes with which it is directly linked. A number of existing approaches consider the distance (or range) estimation errors [37, 38], however most do not consider the inaccuracy in RN positions which is also a significant source of error. The RNs are typically positioned using GPS or by means of surveying by humans. Civilian GPS accuracy is limited to about 15m while surveying is prone to human observation errors. In Section 4.4, we demonstrate the ability of the distributed SOCP approach to provide good localization accuracy even in the presence of significant errors in the RN positions.
2.3
Range-Free Sensor Network Localization Approaches
There have been investigations into range-free techniques for sensor network localization. These are attractive as a cost-effective alternative to range-based schemes but rely on high density of nodes and tend to offer lower localization accuracy. UNs use primarily connectivity information for inferring proximity to a set of RNs. In the Centroid localization scheme [21], UN localizes itself to the centroid of its proximate RNs. In APIT [39], each UN decides its position based on the possibility of being inside or outside of a triangle formed by any three RNs within its communication range. Spotlight system [40] creates well controlled (in time and space) events in the network while the sensor nodes detect and timestamp these events. From the spatio-temporal knowledge for the created events and the temporal information provided by sensor nodes, nodes’ spatial information can be obtained. In the StarDust system [41], sensor nodes are equipped with optical retro-reflectors. An aerial device projects light towards the deployed sensor network, and records an image of the reflected light. An image processing algorithm is developed for obtaining the locations of sensor nodes. The Lighthouse system [42] uses a parallel light beam, that is emitted by a RN which rotates with a certain period. The UN detects the light beam for a period of time, which is dependent on the distance between it and the light emitting device.
10
2.4
Directionality based Position Location Algorithms
The TOA/TDOA based techniques need large bandwidths and long observations times which might be difficult to meet in some real world applications. TOA/TDOA techniques using radio frequency (RF) signals are sensitive to timing estimation errors. Small timing errors of the order of micro-seconds result in very large position errors because of the high propagation speed (3 × 10⁸ m/s) of the electromagnetic waves. AOA information has been used earlier in the literature for determining the position of a node [43, 44, 45]. For AOA techniques, the error in time delay estimation translates into error in angle estimation which results in significantly smaller position error. The proposed implementation of the directional beacon based algorithm results in a position estimation error of only 0.5 m with a 500 msec error in delay estimation (refer Section 5.5 for further discussion on this matter). Thus, directionality based techniques can provide good accuracy with relatively inexpensive hardware. McGillem and Rappaport [44] were one of the earliest to propose the use of AOA information for positioning and navigation along with a system implementation demonstrating the technique. They used infrared beacons with a rotational optical receiving system to obtain angular measurements using beacons. Nasipuri presented a directionality based positioning scheme in [45]. Later in [46] they proposed a system implementation using rotating optical beacon generators and sensor nodes equipped with photo sensors. Shah and Tewfik in [43] presented an enhanced positioning scheme based on directional beacons using the time of earliest arrival for detecting the LOS component. Although many directionality based positioning techniques have been described in the literature, very few have presented practical system implementations, and to our knowledge none based on radio signals has been presented. A positioning system based on radio signals allows the use of the existing transceiver circuitry on wireless devices for positioning. However, the hostile wireless propagation environment introduces distortion in the radio signals and poses unique challenges to the system design. Smart algorithms to address these issues are presented in Chapter 5.
2.5
Sensor Selection and Event Detection Schemes
A survey of various sensor selection schemes is presented in [47]. Information theoretic approaches to sensor management are presented in [48]. An information-driven sensor query approach is proposed in [49]. Sensor selection method based on mutual information is presented in [50]. An
11 entropy-based heuristic approach is proposed in [51] which greedily selects the next sensor to reduce overall uncertainty. Bounds on the performance of information theoretic measures, based on the notion of submodularity, are obtained in [52, 53]. It has been noted that most of the information theoretic measures for sensor selection are computationally expensive. A statistical approach to decide which sensors to use in answering a query was proposed in [54].
12
Chapter 3
Localization Algorithms for UWB Multipath Environments In this chapter we present two novel localizations algorithms. The first algorithm solves the nonline-of-sight (NLOS) identification problem by using multiple signal receptions in a maximum likelihood estimation framework to differentiate between LOS, NLOS components and noise. The ranging algorithm is based on statistical modeling of the multipath channel. The multipath channel is modeled based on the IEEE 802.15.3a channel model 3 (CM3). The signal (LOS or NLOS) and noise components are characterized during an initial calibration phase, which is used to distinguish signal components from noise. Multiple signal receptions at each reference node (RN) are used to differentiate between LOS and NLOS components, and accurately estimate the LOS position in the received signal. The mathematical programming approach presented here assumes that all the range estimates are LOS and uses two bounds (lower and upper) on each range estimate. The bounds are determined by the Cramer-Rao bound on the estimation error. Infeasibility of the constraints helps to identify NLOS estimates. This method will be shown to give more accurate position estimates than the previously reported approaches. Simulations also show that the range estimation error with this approach does not increase with the range. It is seen that traditional localization methods can be decomposed into two steps. In the first step, the TOA (or TDOA) measurements associated with the visible RNs are obtained. In the
13 second step, a location algorithm is implemented, fusing the measurements obtained in the first step into a position estimate. It is seen that the geometric relationship between the TOAs (or TDOAs) is logically exploited in the second step to obtain the position estimate but is not used to assist in the TOA estimation of the first step [55]. The second algorithm we present in this chapter fuses the range (or TOA) estimation and location estimation phases in such a way that the geometric relationship of the TOAs also aids in the range estimation. This lowers the probability of reporting NLOS range estimates. This additional information is available while estimating the range and improves the localization accuracy dramatically compared to the traditional approaches. At the same time the proposed algorithm is computationally efficient. The ranging algorithm, using the statistical characterization of signal (LOS/NLOS) and noise components, obtains multiple pseudo range estimates. One of these estimates will be due to the LOS component while others will be due to NLOS components or noise. The range estimates from all visible RNs are combined in a spatial-domain quasi-maximum likelihood (QML) estimation technique to arrive at the final location estimate. The approaches presented here achieve better results by exploiting the knowledge of the channel statistics. These statistics are determined during an initial calibration phase and thereafter used during the localization phase. It will also be shown that the calibration phase is sufficient to gather all the necessary channel information and no other prior information about the channel is needed. Suitable modifications enable these algorithms to be used in low bandwidth (BW) and multi-band systems.
3.1
Localization Model
We refer to the nodes whose positions are known a priori as the reference nodes (RN) and nodes whose positions are to be estimated as the unlocalized nodes (UN). Consider a setup in which a number of UNs and RNs communicate with each other for estimating locations of the UNs. The RNs and UNs can be time-synchronized using techniques such as [56]. In the absence of such time synchronization, the range to a reference node is calculated using the Two-Way Time Transfer (TWTT) method, originally developed to permit precise synchronization and range estimation between satellites and ground stations. In our implementation of the TWTT, reference node A
14 sends a message to unlocalized node B along with the time at which it was sent. After a turnaround time T, B sends a message back to A along with the time at which it was sent and the arrival time of the message it received from A. Both A and B determine the arrival times of the message they receive by determining the time of earliest arrival corresponding to the message. Using the message transmission times and the earliest arrival times of the messages at both A and B, A can determine the time of flight between A and B. This information is sent to a central location where it is fused with similar information from other RNs to produce a location estimate of B. The UNs and/or RNs transmit a short duration Gaussian monopulse (the ranging pulse) for the purpose of ranging and location estimation. The transmit signal, after going through the multipath channel, is input to a matched filter receiver. The matched filter output is subjected to thresholding to detect local peaks. A threshold is chosen based on the desired error performance and the estimated signal-to-noise ratio (SNR). This system model is depicted in Fig 3.1. Fig 3.2 shows the matched filter output in the presence of Gaussian noise. The waveform has significant multipath components and the signal peak does not occur at the leading edge of the waveform. A calibration phase, explained in the next section, aids in differentiating noise from LOS/NLOS peaks and multiple measurements are used to distinguish LOS from NLOS components. In multi-band communication systems, the whole bandwidth is divided into several sub-bands. In each time interval, a signal is transmitted in one of the sub-bands. We assume that the UNs and RNs transmit a short duration Gaussian monopulse with a bandwidth of 528 MHz. Signals from 4 sub-bands are combined to give a virtual large bandwidth (2 GHz) signal using the technique in [57]. Signal in each sub-band is sampled at 1 GHz and then upsampled by a factor of 4 to give an effective sampling rate of 4 GHz. Higher sampling rates are achieved via processing in the digital domain. The sample rate for the waveform in Fig 3.2 is 20 GHz.
Multipath Channel (modeled using IEEE 802.15.3a CM3) Ranging signal (Gaussian monopulse)
Record peaks detected by thresholding
Matched Filter Receiver
Matched filter output
Figure 3.1: Block diagram of the proposed UWB ranging and localization system.
15
Figure 3.2: Matched-filter output in the presence of Gaussian noise.
3.2
Statistical Modeling: Offline Calibration Phase
In the calibration phase, two sets of training runs are carried out. The first set of training is done in an ideal noise free or virtual high SNR environment achieved by averaging several measurements over a short time interval. Alternatively, we can use a reliable channel model, such as the IEEE 802.15.3a. Here we report results using the IEEE 802.15.3a channel model 3 (CM3) which is based on NLOS (4-10 m) channel measurements reported in [58, 59]. Similar UWB channel models have been proposed in [60, 61, 62]. In a high SNR environment the local peaks detected will either be due to the LOS or NLOS components. It is reasonable to assume that under high SNR conditions and over a set of simulations, the first detected peak would be due to the direct path or the LOS and all other peaks are due to NLOS components. The measured peak strengths are normalized by the strength of the global peak in the output of the matched filter. Global peak is defined as the largest peak detected in a single received ranging pulse. Histograms are estimated for the strengths of the LOS and NLOS peaks using these measurements. The second set of training runs are carried out in the presence of Gaussian noise but in the absence of a transmit signal, i.e., under noise-only conditions. The procedure outlined above is followed to estimate a histogram for the relative strength of the noise peaks. The histograms obtained from simulations performed using 250 different channel realizations are shown in Fig 3.3. It is seen
16 that the relative strength of the signal (LOS/NLOS) peaks follows an exponential distribution, whereas that of the noise peaks follows a lognormal distribution. By normalizing these histograms to unit area we obtain probability density functions for the relative strengths of the signal and noise peaks, which we denote by fsignal (ρ) and fnoise (ρ), respectively. µ ¶ ρ 1 fsignal (ρ) = exp − β β ³ ´ 2 ρ ln ρ0 1 fnoise (ρ) = √ exp − 2σ 2 σ 2π
(3.1)
The histograms for the time difference between the location of the local peaks and the global peak in the matched filter output are also estimated, shown in Fig. 3.4. These results agree with the IEEE 802.15.3a channel model and illustrate an alternative approach for estimating these characteristics in the absence of a channel model. This characterization of the LOS/NLOS and noise peaks is used in the two ranging and location estimation algorithms which are described in the next two sections.
3.3
Ranging and Location Estimation Algorithm using Multiple Signal Receptions
3.3.1
Overview of the Ranging Approach
We assume all the nodes in the network are quasi-static or slow moving. Each UN transmits multiple copies of the ranging pulse at fixed intervals of time. All RNs within the radio range of a given UN record these multiple signal receptions to be used for range estimation. We detect the received signal peaks due to multiple pulses by thresholding and estimate the LOS component as the earliest peak across all receptions (the underlying assumption). Using multiple signal receptions helps to average over noise and increases the effective signal power and SNR, resulting in improved ranging accuracy.
3.3.2
Identifying Candidate LOS Component
To estimate the position of the LOS component, the time axis is divided into a number of small time bins. Each detected peak in a time bin is also referred to as a return. For each time bin two
17
(a)
(b)
Figure 3.3: Relative strength (ρ) distribution for the: (a) signal (LOS/NLOS) peaks and (b) noise peaks.
18
(a)
(b)
Figure 3.4: Time difference (δ) distribution for the: (a) signal (LOS/NLOS) peaks and (b) noise peaks.
19 hypotheses are proposed: (i) the bin contains returns due to noise or (ii) the returns are due to a LOS or NLOS component. The likelihood of the peaks coming from the LOS or NLOS distribution is calculated looking across all of the collected signal receptions and using the histogram for the relative strengths of the LOS/NLOS components. Similarly, for each bin the likelihood of the returns being due to noise is calculated using the histogram for the relative strength of the noise peaks. Based on which likelihood function turns out to be larger, each bin is estimated to contain either a LOS or NLOS component or noise. The earliest time bin that has a higher likelihood of containing a signal (LOS or NLOS) component is chosen as the estimate of the direct path or LOS signal position. The likelihood function under each hypothesis is evaluated as a product of the probabilities of the returns in a bin, across all the collected signal receptions, being either due to LOS/NLOS components or due to noise. The likelihood function evaluation procedure is shown in Figs. 3.5 and 3.6.
Consider the case where we use three signal receptions for ranging at each node. We
record all the (normalized) peaks detected in the three receptions in a given time bin. For each detected peak, the relative strength is calculated, say ρ1 . The probability of the peak being due to noise, P (ρ1 ), is found by locating ρ1 on the relative strength distribution (x-axis) for the noise peaks and reading the corresponding value on the y-axis. This computation is shown in Fig 3.6. The product of these probabilities for all peaks in a given bin, gives the likelihood of the bin containing a noise peak. If a time bin does not contain any return, the probability of the return being less than the threshold is used to evaluate the likelihood function. Pnoise (ti ) =
S Y
P (peak detected in time bin i in signal j is due to noise)
j=1
where S is the number of signal receptions collected at each RN. Similar computation is done to obtain the likelihood associated with the time bin containing a signal return (LOS or NLOS peak) denoted by Psignal (ti ). The earliest time bin ti with Psignal (ti ) ≥ Pnoise (ti ) is chosen as the LOS position estimate. Note that the peak chosen as the LOS estimate may actually correspond to a NLOS component. The location algorithm described next takes this possibility into account while estimating the location.
20
Figure 3.5: Illustration of Likelihood evaluation.
21
�� ��
�
Figure 3.6: Illustration of Likelihood function evaluation.
3.3.3
Location Estimation Algorithm
In our localization set-up, range estimates to a given UN from a number of other nodes are used for location estimation. Each range estimate provides a circle centered on the corresponding node, on which the UN lies. In the absence of measurement error, the position of the UN is given by the intersection of the circles derived from the range estimates. However due to measurement error, the estimates correspond to circular rings whose width depends on the estimation error. Let (x,y) be the unlocalized nodes’ position, (xi ,yi ) the position of the ith RN and ri the range estimate from the ith RN to the UN. The range estimation error (²r ) is chosen to be a multiple of the Cramer-Rao lower bound (CRLB) on the range estimation error variance [57]. For each range estimate ri : (ri − ²r )2 ≤ (xi − x)2 + (yi − y)2 ≤ (ri + ²r )2 where i = 1, . . . , N . Let Ki = x2i + yi2 and R = x2 + y 2 . Then (3.2) can be rewritten as: (ri − ²r )2 − Ki ≤ −2xi x − 2yi y + R ≤ (ri + ²r )2 − Ki . In matrix form, h1 ≤ GZ ≤ h2
(3.2)
22 where
2
2
(r1 − ²r ) − K1 (r1 + ²r ) − K1 2 (r2 − ²r ) − K2 (r2 + ²r )2 − K2 h1 := , h2 := .. .. . . 2 (rN − ²r ) − KN (rN + ²r )2 − KN −2x1 −2y1 1 x −2x2 −2y2 1 and Z := G := . y .. .. .. . . . R −2xN −2yN 1
,
Thus the location estimation can be formulated as a constrained minimization that tries to find the maximum-likelihood (ML) location estimate assuming all the range estimates to be LOS [63]. min {(h2 − GZ)T Ψ−1 (h2 − GZ)} subject to
(3.3)
h1 ≤ GZ ≤ h2
where Ψ = 4c2 BQB, B = diag{r1 , . . . , rN }, Q is the noise covariance matrix and c is the signal propagation speed. Infeasibility of the constraints will imply that one or more of the range estimates are NLOS and need to be dropped from the location estimation procedure. It is seen that if at most M estimates can be NLOS, then at least (M +1) or more accurately max(M +1, 4) LOS estimates are needed to obtain an unambiguous location estimate. Figs. 3.7(a) and 3.7(b) illustrate the case with M = 1; four estimates give more than one possible location estimate, hence 5 range estimates are needed to resolve this ambiguity.
3.4
Spatial Domain Quasi-Maximum Likelihood Location Estimation Algorithm
Each node that needs to be localized transmits a ranging pulse. All RNs (and previously localized nodes) which receive the transmission, record the received pulse. Each of these RNs (or nodes)
23
NLOS estimate
(a) 1 NLOS and 3 LOS range estimates; resulting in location ambiguity.
NLOS estimate
(b) 1 NLOS and 4 LOS range estimates; location ambiguity resolved.
Figure 3.7: Location Estimation with 1 NLOS range estimate (M = 1).
24 executes the first phase of the localization algorithm to identify the pseudo range estimates. These range estimates are referred to as pseudo since only one estimate is due to the LOS component while the others are due to NLOS components or noise. The pseudo range estimates are then communicated to a central processing node along with the position of the node that measured them. At the central node this information is fused with similar information from other RNs (or nodes) to produce an estimate of the UN location. This localization model employs a centralized framework where most of the computation is done at a central node while minimal processing is done at the UNs. This is desirable when UNs are resource constrained and can only perform a minimal amount of computation. In a distributed framework, the RNs transmit the ranging pulse and the UN computes its location by estimating the pseudo ranges corresponding to each RN.
3.4.1
Identifying Pseudo Range Estimates
The ranging pulse transmitted by a UN is received by all RNs within its radio range. At each RN, a threshold is chosen to detect peaks in the received signal. The detected peaks are recorded in terms of their normalized signal strength (ρj,i ) and the time difference (δj,i ) between the detected peak and the global peak in the received signal, where i refers to the ith RN and j refers to the j th detected peak. The time difference is used to estimate the pseudo range (rj,i ) due to each of the detected peaks (as if each of the peaks were due to the LOS component). Let tpeak,i denote the time stamp of the global peak in the received signal at the ith RN, then: rj,i = c · (tpeak,i − δj,i ).
(3.4)
Each pseudo range estimate gives a circle centered on the corresponding RN with radius rj,i on which the UN could lie (refer Fig. 3.8).
3.4.2
Location Estimation Algorithm using Pseudo Range Estimates
The localization procedure using pseudo range estimates is described below: Step 1. At each RN, detect peaks in the received signal by setting a threshold; record the pair (ρj,i ,δj,i ) for each detected peak. Step 2. Using (3.4) estimate rj,i for each detected peak.
25
RN1
RN4
RN2
RN3
Figure 3.8: Pseudo range estimates from 4 RNs to an unlocalized node; the UN is located at the intersection of the LOS ranges. Step 3. Each RN transmits the recorded information along with its location information to a central processing location. Step 4. After information from all RNs has been received at the central location, the area of interest, where the UN could possibly exist, is divided into a grid of cells. (Note: Area of interest is determined based on the known locations of the RNs and the largest pseudo range estimate from each RN. This is reasonable since each pseudo range gives how far the UN could be located from the RN). The cell size is determined by the smallest resolvable time interval during the pseudo range identification phase. Step 5. Represent the grid of cells as a matrix. The matrix is populated such that the entry in each cell represents the likelihood of the cell containing a LOS range estimate. This computation is explained next. Likelihood Matrix Computation Let yi (t) = x(t) + ni (t) be the received signal at the ith RN, where x(t) represents the transmitted signal and ni (t) the Gaussian noise. We assume that noise is independent for each RN and for each received pulse. Let ρj,i be the relative strength of the j th peak, mapped to a cell, due to the signal received at the ith RN. The mapping to a cell is done based on the pseudo range rj,i
26 corresponding to the peak ρj,i . Then, the likelihood of the peak being due to signal or noise is given by f (signal/ρj,i ) or f (noise/ρj,i ), respectively. f (ρj,i /signal).f (signal) fsignal (ρj,i ).f (signal) = f (ρj,i ) f (ρj,i ) f (ρj,i /noise).f (noise) fnoise (ρj,i ).f (noise) f (noise/ρj,i ) = = . f (ρj,i ) f (ρj,i )
f (signal/ρj,i ) =
(3.5)
To compute the UN location, we need to combine measurements from all RNs. There are two possibilities to consider. These correspond to two models for the path loss from the UN to each of the RNs, and the likelihood of any peak being due to signal or noise: (i) We may consider the path losses to be correlated since they are dominated by a deterministic loss that is a function of the RNs and UN geometry. In this case, extensive calibration would be needed to model each of the individual path losses which is not practical. (ii) We may alternatively consider the path losses to be random and independent due to the arbitrary placement and dynamic structure of the obstructions between the UN and each of the RNs. In this case, we can assume that the path losses are independent realizations drawn from the same distribution. We use the latter model as a reasonable approximation in the presence of multipath propagation. In each cell peaks from a number of RNs each with strengths ρj,i (i = 1, . . . , N and j = 1, . . . , Ni , where Ni are the number of peaks detected at the ith RN) are reported. If each of these is an independent observation, the overall likelihood function would be a product of the individual likelihoods. Otherwise, the product of the individual likelihoods is not the overall likelihood. Nevertheless, it provides a reasonable cost function that we will maximize below. We refer to this cost function as a quasi-likelihood function. Intuitively, each range estimate rj,i can be represented by a circle around the RN on a map of the network. The intersection of the circles from all the visible RNs would give a grid of possible locations for the UN. The position with the maximum likelihood (or quasi-likelihood) value is chosen as the UN location estimate. Let Ameasured,i represent the matrix of likelihood values for the ith RN. Since each pseudo range estimate comes from a peak in the received signal, the likelihood of it being due to the LOS signal component is related, directly to the likelihood of the peak coming from the signal (LOS/NLOS) distribution, and inversely to the likelihood of the peak being from the noise distribution. For each detected peak with relative strength, say ρi (the second subscript on ρ is omitted for the sake of simplicity), the likelihood of it being due to noise fnoise (ρi ), is obtained from the noise relative
27 strength distribution. Locate ρi on the x-axis of the noise distribution and the corresponding value on the y-axis gives fnoise (ρi ). This computation is similar to that shown in Fig. 3.6. The likelihood fsignal (ρi ) is calculated in a similar manner using the signal relative strength distribution. We denote fsignal (ρi ) and fnoise (ρi ) assigned to the matrix cell (h, k) by fsignal (ρi , h, k) and fnoise (ρi , h, k), respectively. Using (3.5) we obtain: Ameasured,i (h, k) =
fsignal (ρi , h, k) f (signal/ρi , h, k) = f (noise/ρi , h, k) fnoise (ρi , h, k)
(3.6)
where i is the RN index and (h, k) are used to index the matrix or cell entries. Each of the matrices Ameasured,i indicates where the UN is most likely to be present. Thus by overlaying each of these matrices, one over the other, on the cell grid would give the overall likelihood distribution: Aoverall (h, k) =
N Y
Ameasured,i (h, k).
(3.7)
i=1
The cell with the maximum valued entry when mapped to the area of interest gives the location estimate (xs ,ys ) of the unlocalized node. (xs , ys ) ⇔ (hs , ks ) = argmax (h,k)
3.5
"N µ # Y fsignal (ρi , h, k) ¶ i=1
fnoise (ρi , h, k)
.
(3.8)
Simulation Results
Extensive simulations were carried out using 250 different channel realizations based on the IEEE 802.15.3a channel model 3 (CM3). The transmit signal or ranging pulse is a Gaussian monopulse with a center frequency of 2 GHz and a bandwidth of 3.14 GHz. Noise is assumed to be independent for each signal reception. A 4-bit analog-to-digital converter (ADC) is used in the receiver circuitry and the SNR reported includes the quantization noise effects due to the ADC.
3.5.1
Location Estimation Algorithm using Multiple Signal Receptions
Following the approach in Section 3.3, the UN transmits multiple copies of the ranging pulse and each RN in its radio range records these multiple signal receptions. Each RN then obtains the range estimate to the UN and finally this range information from all RNs is used to estimate the UN location. The use of multiple signal receptions for range estimation reduces the noise variance and helps to eliminate large estimation errors. In Fig. 3.9 we plot the range estimation error using
28 three signal receptions as a function of the transmitter (TX) - receiver (RX) distance. It is seen that the range estimation error does not increase significantly with the TX-RX distance. TX-RX distances for the simulations ranged from 0-8 m. The approach in [10] looks for the LOS in a small window of the received signal. Estimating the window size becomes extremely difficult at long ranges due to the complex LOS blockage and this results in large estimation errors. The previous approaches relied on the signal strength for LOS estimation. Since the signal strength decreases with increase in the range which lowers the SNR with a resultant increase in the range estimation errors. In our approach, we are able average out noise and achieve a higher effective SNR by looking at multiple signal receptions. This approach thus works well even for larger TX-RX distances. In Fig. 3.10, the range estimation error resulting from the approach using multiple signal receptions (with S = 3) is compared with the method where only a single signal reception is used. The comparison is shown for different values of the SNR. For 10-15 dB SNR, the average and rms range estimation errors are smaller than 0.2 m using three signal receptions. Fig. 3.11 is a histogram of the range estimation error showing the number of range errors of different magnitudes. The peak vertical bar in the histogram plot corresponds to around 220 range estimates with an error of less than 0.1 m. It is also seen that there are relatively very few large errors. Next consider the situation illustrated in Fig. 3.7(b). The unlocalized node position is estimated using 5 range estimates: Estimated ranges = {4.8900, 0.2850, 1.9200, 0.1950, 3.5400} m True ranges = {3.4350, 0.2700, 1.9050, 0.2400, 3.5050} m Location Estimate = (−0.0174, −0.0100) m True Location = (0.0, 0.0) m. The location estimation algorithm (3.3) found the constraints due to the estimated ranges to be infeasible and thus an attempt was made to solve with 4 constraints. Eliminating the constraint due to the first estimate, which is a NLOS estimate, results in a feasible solution. Thus, even if the ranging algorithm reports NLOS estimates, the localization algorithm is able to identify and eliminate them while estimating the location. The sub-meter ranging and localization accuracy achieved here is better than other approaches, using similar bandwidths, reported in the literature [11, 10].
29
0.48
(in m)
0.42
0.36
0.30
0.24
0.18
0.12
0.06
1.5
3.0
4.5
6.0
7.5
(in m)
Figure 3.9: Range estimation error vs. TX-RX distance using multiple signal receptions.
0.8 RMS error using three signal receptions Average error using three signal receptions RMS error using single signal reception Average error using single signal reception
0.7
Range estimation error (in m)
0.6
0.5
0.4
0.3
0.2
0.1
0
4
5
6
7
8 9 10 11 Signal−to−noise ratio (SNR) in dB
12
13
14
Figure 3.10: Range estimation error vs. SNR using multiple signal receptions.
30
Figure 3.11: Range estimation error histogram.
3.5.2
Spatial Domain Quasi-Maximum Likelihood Location Estimation Algorithm
The simulations in this sub-section use pseudo range estimates from 5 RNs for estimating the UN location. The RN coordinates are randomly generated on a square grid and the SNR is fixed at 10 dB. This localization experiment is repeated 50 times. The simulation results from 5 such trials, each using independent channel realizations, are shown in Fig. 3.12. The true UN location is (0, 0) m. Solid lines indicate the error between the estimated and true UN locations. Fig. 3.13 shows the average and rms position estimation error, based on all 50 trials, as a function of the SNR. It is seen that the localization accuracy improves with SNR and there is no significant degradation in the accuracy even when the SNR is reduced to 5 dB. The spatial domain QML approach does not try to locate the LOS position in each received signal. Rather we combine the pseudo range estimates from a number of RNs and the final location estimate corresponds to the cell with the maximum likelihood of containing a signal component. This works well because it is highly unlikely that a majority of the RNs would report NLOS estimates which overlap at a given point (or cell).
31
5
3
1
2
2
4
1 2
Distance in meters
1
3 5
0
3 2
54 3 42 1 3 31
1
4
1
4
−1
5
4 3 2 5
2
−2
−3
5 −4
−3
−2
−1
0 1 Distance in meters
2
3
4
Figure 3.12: Position estimation results from 5 trials using the spatial domain QML location estimation algorithm. True locations of the RN (¦) and UN (◦) along with the estimated UN locations (+). Solid lines indicate the error between the estimated and true UN locations. The node locations for each of the 5 trials are numbered distinctly. RMS error Average error
Position estimation error (in m)
1.2
1.1
1
0.9
0.8
0.7
5
6
7
8
9 10 11 12 Signal−to−noise ratio (SNR) in dB
13
14
15
Figure 3.13: Position estimation error vs. SNR using spatial domain QML location estimation algorithm.
32
3.6
Conclusion
In this chapter we presented two localization algorithms based on statistical modeling of the UWB multipath channel in terms of signal (LOS/NLOS) and noise characterization. The first algorithm uses multiple signal receptions for range estimation. Simulation results have shown that this approach gives sub-meter ranging accuracy even for large TX-RX ranges. The accuracy achievable is limited only by the size of the time bin chosen and the SNR. The bin size is related to the time resolution achievable with the ranging signal being used, which in turn depends on its bandwidth. In the absence of sufficient bandwidth and/or SNR, collecting more number of signal receptions for each range estimate and increasing the recording time for the received signal can improve the ranging and localization accuracy. The second algorithm, based on spatial domain quasi-maximum likelihood estimation, fuses the range estimation and location estimation phases such that the geometric relationship of the TOAs aids the range estimation phase as well. This approach while being computationally efficient has shown the ability to provide close to sub-meter localization accuracy. Again the accuracy achievable is limited only by the cell size chosen and the SNR. The cell size is related to the time resolution achievable with the ranging signal being used, which in turn depends on its bandwidth. Also, by not trying to directly estimate the LOS position in each of the received signals, we overcome the difficult problem of NLOS identification.
33
Chapter 4
Distributed Sensor Network Localization using SOCP Relaxation In this chapter we present a distributed approach based on second-order cone programming (SOCP) for solving the sensor network localization problem. It is assumed that the pairwise range or distance estimates are available (obtained using a suitable ranging method). Here we focus on the positioning sub-problem and thus the distributed solution presented here is independent of the ranging method used. The distributed SOCP approach is computationally efficient and scalable to large network sizes. In addition, we demonstrate the ability to handle distance (or range) estimation errors and errors in the reference node (RN) positions. In the presence of distance estimation errors the approach consists of a single step wherein each unlocalized node (UN) determines its position by executing the localization algorithm independently using distance information to the RNs and other nodes with which it is directly linked (i.e., which are within its communication range). If in addition to the distance estimation errors, the RN positions also have errors then the approach consists of three steps: using the local distance information and inaccurate RN positions each UN estimates its position. Then, the RNs execute the localization algorithm using position information from their neighboring nodes and the associated distance information to refine their positions. Finally, the previously UNs re-execute the localization algorithm to refine their position
34 estimates. One of the significant advantages of our approach is that it is fully distributed and converges to an optimal (or near-optimal) solution. As a result of the distributed nature of the solution, the problem dimension at each node is a linear function of only the number of neighbors of the node. There is no significant increase in the computational effort per node even in large networks (for a given node connectivity level), whereas most existing methods result in an exponential increase in the computation time with network size. This makes the distributed SOCP approach suitable for large-scale networks with thousands of nodes. As we will demonstrate, the performance gains are achieved without sacrificing localization accuracy. We demonstrate the convergence of our algorithm numerically.
4.1
Sensor Network Localization: Problem Formulation
The sensor network localization problem is mathematically formulated as follows. Consider n distinct points (or nodes) in Rd (d ≥ 1). Given the positions of the last (n − m) points (or RNs) xm+1 , ..., xn and the Euclidean distance dij between neighboring points (or nodes) i and j where (i, j) ∈ A. A is the neighbor set defined as A = {(i, j) :k xi − xj k≤ RadioRange} 1 , we need to estimate the positions of the first m points (or UNs). In the presence of distance estimation errors, this can be formulated as the following non-convex minimization [64]: min
x1 ,...,xm
X
| kxi − xj k2 − d2ij |
(4.1)
(i,j)∈A
where k · k denotes the Euclidean norm. If the distance estimation errors are assumed to be independent and normally distributed, it can be shown that (4.1) is closely related to the maximum likelihood estimation of the node positions [65]. The original problem (4.1) can be reformulated in convex form using relaxation techniques. As a first step, (4.1) can equivalently be written as: min
x1 ,...,xm ,yij
X
| yij − d2ij | s.t. yij = kxi − xj k2 , ∀(i, j) ∈ A.
(i,j)∈A
Relaxing the equality constraints to “greater than or equal to” inequality constraints yields the 1 The
set A is undirected: (i, j) = (j, i), ∀(i, j) ∈ A
35 following convex problem: X
min
x1 ,...,xm ,yij
| yij − d2ij | s.t. yij ≥ kxi − xj k2 , ∀(i, j) ∈ A
(4.2)
(i,j)∈A
which is an SOCP. The problem in (4.2) can equivalently be written as: min
X
x1 ,...,xm ,yij ,tij
tij
(4.3)
(i,j)∈A
s.t. yij ≥ kxi − xj k2
∀(i, j) ∈ A
tij ≥| yij − d2ij |
∀(i, j) ∈ A.
One approach would be to solve the SOCP problem as a global minimization over the entire network. However, due to the problem sizes encountered in sensor networks solving the SOCP relaxation globally might be computationally demanding as shown in [36]. The distributed approach has the advantage that the algorithm can be executed on the sensor nodes themselves thus removing the need to relay all the information to a central processor. A parallel or distributed algorithm is preferred in sensor networks which we propose next.
4.2
Distributed SOCP Localization Algorithm
In a distributed algorithm, implemented over multiple processors, the algorithm is divided into “phases”. During each phase, every processor must execute a number of computations that depend on the results of the computations of other processors in previous phases. However, the timing of computations at any one processor during a phase can be independent of the timing of the computations at other processors within the same phase. All interactions between processors take place at the end of the phases. Such distributed algorithms are also called synchronous. Here we show how the SOCP relaxation for the sensor network localization problem can be formulated as a synchronous distributed algorithm [66]. We can approximately reformulate (4.2) as: min
x1 ,...,xm ,yij
X
{| yij − d2ij | +I− (fij (x, y))}
(i,j)∈A
where fij (x, y) = kxi − xj k2 − yij
0 and I− (u) = ∞
u ≤ 0, u ≥ 0.
36 Here I− is the indicator function which can be approximated by the logarithmic barrier function and the problem reduces to: X
min
x1 ,...,xm ,yij
{| yij − d2ij | −(1/t)log(yij − kxi − xj k2 )}.
(4.4)
(i,j)∈A
It is seen that the objective function in (4.4) is separable. For each i ∈ {1, ..., m}, the objective function depends only on the positions of the neighboring nodes and the pairwise distance measurements between them. This enables the objective function to be decomposed and the minimization can then be carried out at each node xi using local information. Each UN will be able to independently solve this minimization using information from its neighboring nodes and RNs. Let NA (i) = {j : (i, j) ∈ A} be the neighbor set for node xi . Using the separability observation, (4.3) can be solved independently over the m UNs xi (i = 1, . . . , m), where each node uses information (xj , dij ) from its neighboring nodes xj , j ∈ NA (i). The information exchange between nodes occurs at the end of each iteration (or phase). Thus (4.3) decomposes to the following distributed formulation: X
min
xi ,yij ,tij
tij
j∈NA (i)
s.t. yij ≥ kxi − xj k2
∀j ∈ NA (i)
tij ≥| yij − d2ij |
∀j ∈ NA (i).
This can be written in standard SOCP form as: X
min
xi ,yij ,tij
tij
j∈NA (i)
à s.t.
0
yij + ti 2
(4.5)
!2
à ≥
tij ≥| yij − d2ij |
0
yij − ti 2
!2 + kxi − xj k2
∀j ∈ NA (i) ∀j ∈ NA (i)
0
ti = 1. The distributed SOCP algorithm consists of a phase where each UN estimates its position using information from the neighboring nodes and solving the SOCP (4.5). In an iterative distributed scheme, this would be followed by a communication phase wherein each node exchanges its position estimate with its neighbors. These iterations could be repeated after fixed intervals of time or when any new information becomes available at a node. It should be noted that the algorithm uses
37 information from neighboring RNs as well as other neighbor nodes to position a given node. Thus to obtain a non-trivial position estimate each node needs at least 3 neighbors (for 2-D localization) with position estimates, as opposed to the more stringent requirement of having 3 RNs in the neighborhood that many triangulation/trilateration schemes impose. If the RN positions are inaccurate, the distributed SOCP approach will consist of three steps: after the UNs estimate their positions based on the inaccurate RN positions and distance information, the RNs solve the local SOCP (4.5) using position information from their neighboring nodes and the associated distance information to refine their positions. As we will show, this second step results in a significant improvement in the positioning accuracy of the inner RNs. Finally, another iteration of the local SOCP (4.5) over the previously unlocalized nodes further refines their position estimates. Let ni (=|NA (i)|) represent the number of neighbors of the node xi . SOCP (4.5) has 2ni + 3 variables, 2ni conic constraints and 1 equality constraint. In sensor networks, due to the relatively short radio range of the sensors, the number of neighbors of a given node is a small fraction of the total number of nodes in the network (i.e., ni ¿ n). Thus the distributed SOCP approach (4.5) results in significantly smaller problem sizes than approaches proposed in the literature. The SOCP problem (4.5) can be efficiently solved in practice by interior point methods. Here we use SeDuMi [67] to solve this problem2 .
4.3
Localization with Accurate Reference Node Position Information
The experiments in this section assume that accurate RN position information is available. In this setting, the localization problem is solved by executing the distributed SOCP algorithm at each of the UNs. We assess the average-case performance on networks with uniform topology as well as irregular topology. For each parameter setting, the algorithm is run on 5 randomly generated examples. We randomly generate the true positions of the UNs and RNs xt1 , . . . , xtn according to a uniform distribution on the unit square [−0.5, 0.5]2 and noisy distance measurements dij are generated by 2 Refer
to Appendix A for details on how to rewrite SOCP (4.5) in the SeDuMi form
38 adding normally distributed measurement noise to the true distance. Specifically: dij = kxti − xtj k · max{0, 1 + ²ij · nfd }
∀(i, j) ∈ A
A = {(i, j) : kxti − xtj k ≤ RadioRange} where ²ij is a normal random variable N (0, 1) representing measurement noise, RadioRange ∈ (0, 1) represents the radio range of the nodes and nfd ∈ [0, 1] is the noise factor (standard deviation of the distance error in percentage) for the distance measurements. For a standard deviation of 10% in the distance estimation error we set nfd = 0.10. We wrote the code in Matlab to solve the SOCP relaxation. Our code calls SeDuMi (Version 1.1) [67], a C implementation of a predictor-corrector primal-dual interior point method for solving SDP/SOCP. The simulations were carried out on a PC with 2.53 GHz Pentium 4 processor and 1 GB RAM running Matlab 7.0.1 (R14). To check the positioning accuracy of our algorithm, we define the average error as: Pm kxi − xti k · err = i=1 m First we consider the uniform topology. Fig. 4.1 shows the results using the SOCP algorithm for a randomly generated 500 node network with nfd = 0.05. It is seen that there is a close match between the estimated and true positions for nodes which lie in the convex hull of their neighbors. The average positioning error is 0.032 (21.3% of the RadioRange). The estimated positions become less accurate as we move towards the boundary. Fig. 4.2 shows the effect of the percentage of RNs (p) on the average positioning error (err) for different network sizes with similar node connectivity levels. Increasing p from 12 to 15% lowers the average error. The variation in the average error across network sizes (for a given p) is most likely due to the small differences in the node connectivity levels. The positioning accuracy improves significantly with increase in the node connectivity level. Fig. 4.3 shows that the average error decreases steadily as RadioRange is increased from 0.08 to 0.20. For larger radio ranges the error tends to reach a lower bound determined by the distance estimation errors. Irregular topologies are more difficult than uniform topologies. The results for an irregular topology, namely a C-shaped network, with 300 nodes and nfd = 0.05 are shown in Fig. 4.4. The average positioning error is 0.048 (32% of the RadioRange).
39
Average Positioning Error = 0.032 0.5
0.4
0.3
0.2
0.1
0
−0.1
−0.2
−0.3
−0.4
−0.5 −0.5
−0.4
−0.3
−0.2
−0.1
0
0.1
0.2
0.3
0.4
0.5
Figure 4.1: Distributed SOCP results for Uniform topology: n = 500, RadioRange = 0.15, p = 0.15 and nfd = 0.05. err = 0.032 and errmax = 0.232. True positions of the UNs (◦) and RNs (¦) along with the estimated node positions (+). The solid lines indicate the error between the estimated and true UN positions.
40
p = 0.12 p = 0.15
0.1 0.09
Average Positioning Error
0.08 0.07 0.06 0.05 0.04 0.03 0.02 0.01 0 500
1000
1500 2000 2500 3000 Total number of nodes in the network (n)
3500
4000
Figure 4.2: Average positioning error as a function of the network size (n) for two different percentages of RNs. (RadioRange = 0.10, nfd = 0.05 and average node connectivity ≈ 30)
0.08 n = 1000, p = 0.15, nfd = 0.05
Average Sensor Positioning Error
0.07
0.06
0.05
0.04
0.03
0.02
0.01 0.08
0.1
0.12
0.14
0.16 0.18 RadioRange
0.2
0.22
0.24
0.26
Figure 4.3: Average positioning error as a function of RadioRange. (n = 1000, p = 0.15 and nfd = 0.05)
41
Average Positioning Error = 0.048 0.5
0.4
0.3
0.2
0.1
0
−0.1
−0.2
−0.3
−0.4
−0.5 −0.5
−0.4
−0.3
−0.2
−0.1
0
0.1
0.2
0.3
0.4
0.5
Figure 4.4: Distributed SOCP results for irregular (C-shaped) topology: n = 300, RadioRange = 0.15, p = 0.15 and nfd = 0.05. err = 0.048 and errmax = 0.448. True positions of the UNs (◦) and RNs (¦) along with the estimated node positions (+). The solid lines indicate the error between the estimated and true UN positions.
42 Table 4.1 lists the test cases used to understand the computational complexity of the distributed SOCP algorithm. RadioRange is chosen such that the average node connectivity is about the same across all test cases. Table 4.1 lists the input parameter values, the cardinality of A (denoted by |A|), the average node connectivity, the typical SOCP (4.5) dimension and the computation time per node (excluding the time needed for computing the relative distances dij and communication or message exchanges). Comparison with the SOCP dimensions reported by Tseng [36] for similar network sizes reveals that the dimensions in Table 4.1 are smaller by at least two orders of magnitude and are still in the realm of problem sizes which can be handled efficiently, even for a network with 4000 nodes. The SOCP dimension, which depends on the number of neighboring nodes, does not increase with the network size for a given average node connectivity. As a result, the per node computational burden is significantly reduced. Table 4.2 presents test cases used with the MDS-MAP(P, R) algorithm [2]. The cost of refining and merging the local maps, and the optional global refinement step in the MDS-based algorithm becomes dominant for large networks (n > 300). Hence, network sizes for these tests are smaller than those for the distributed SOCP algorithm. However RadioRange is chosen such that the node connectivity is approximately the same as for the test cases in Table 4.1. From Tables 4.1 and 4.2, it is seen that the MDS-MAP(P, R) algorithm requires slightly more than three times the computational effort needed for the distributed SOCP algorithm, even for relatively small network sizes. Thus the distributed SOCP algorithm significantly improves the computational efficiency without sacrificing localization accuracy.
4.4
Localization with Reference Node Position Errors
The experiments in this section consider the inaccuracy in the RN positions in addition to the distance estimation errors. The goal is to localize the UNs while reducing the adverse impact of the RN position errors on the positioning accuracy. One way to achieve this is to solve SOCP (4.5) simultaneously at each of the UNs and RNs. We ran a few simulation test cases using this approach, but the results did not converge in each of those cases. Hence we propose a three-step distributed approach. In the first step, each UN estimates its position using distance information from its neighbors. In the second step, the RNs use information from their neighbors to refine their positions. We also observed that the second step aids in refining only those RN positions which
43
Test Case
n
RadioRange
p
1 2 3 4 5 6 7
500 500 1000 1000 2000 2000 4000
0.15 0.15 0.10 0.10 0.08 0.08 0.05
0.12 0.15 0.12 0.15 0.12 0.15 0.15
|A|
15104 15054 28368 28158 73566 76706 119082
Avg. Node Connectivity 30.2 30.2 28.4 28.2 36.8 38.4 29.8
SOCP dimension (Typical) 123 × 181 181 × 124 115 × 169 115 × 169 151 × 223 155 × 229 123 × 181
CPU time per node (in sec) 1.24 1.19 1.20 1.18 1.30 1.29 1.03
Table 4.1: Distributed SOCP: Input parameters for the test cases, corresponding SOCP (4.5) dimensions and CPU times. (p gives the percentage of reference nodes, and Noise figure nfd = 0.05 for all test cases).
Test Case
n
RadioRange
p
1 2 3 4
100 200 300 500
0.35 0.25 0.20 0.15
0.050 0.025 0.017 0.010
Avg Node Connectivity 29.6 32.9 30.9 30.8
CPU time per node (in sec) 4.03 4.57 4.35 4.07
Table 4.2: MDS-MAP(P, R): Input parameters for the test cases and CPU times. (p gives the percentage of reference nodes, and Noise figure nfd = 0.05 for all test cases).
44 are within the convex hull of their neighbors (or in the interior of the network). Thus the RN refinement step is applied only for RNs in the interior of the network. Finally, we repeat one more iteration of the distributed SOCP algorithm over the previously unlocalized nodes using the refined RN positions. It is seen that the refined RN positions improve the UN positioning significantly. The simulation setting is similar to that in section 4.3 except for the following differences. The noisy distance measurements and inaccurate RN positions are generated as: dij = kxti − xtj k · max{0, 1 + ²ij · nfd }
∀(i, j) ∈ A
xi = xti · max{0, 1 + ²ij · nfa } ∀i = (m + 1), . . . , n. where nfa and nfd ∈ [0, 1] are the noise factors for RN positions and distance measurements, respectively. Simulations in this section were carried out on a PC with 3 GHz Pentium 4 processor and 2 GB RAM running Matlab 7.2.0 (R2006a). We experimented with the noise factors (nfd and nfa ) to understand their effect on the positioning accuracy. Fig. 4.5 shows the variation of the average error (err) with increasing nfd . The distributed SOCP algorithm handles distance errors as large as 20% gracefully with a small degradation in positioning accuracy. MDS-MAP(P, R) algorithm gives better accuracy using the O(n3 ) global refinement step and shows similar degradation. It should be noted that MDS-MAP(P), the MDS-MAP algorithm without global refinement, shows loss in performance compared to MDSMAP(P, R). MDS-MAP(P) also uses more computations than the distributed SOCP due to the merging and refinement of local maps. It is observed that the singular value decomposition (SVD) step of the MDS-MAP algorithms takes progressively longer to converge as the distance errors increase. Localization systems based on received signal strength (RSS) measurements regularly encounter distance estimation errors of 15 − 20%. The distributed SOCP approach is thus robust to large distance errors while being computationally efficient. Fig. 4.6 shows the effect of the noise factor nfa on the average error. The distributed SOCP algorithm is robust to RN position errors with results comparable to the MDS-MAP(P, R) algorithm. The degradation in the positioning accuracy is not significant even in the presence of 30% error in the RN positions. MDS-MAP(P, R) algorithm which typically works with very few RNs, needs more RNs to compensate for the errors introduced by the inaccurate RN positions. In Section 4.3 we showed the improvement in the positioning accuracy achievable as a result of increasing the radio range for all the nodes. Since increasing the radio range of all nodes is
45
0.08 Distributed SOCP MDS−MAP(P) MDS−MAP(P, R)
0.07
Average Positioning Error
0.06
0.05
0.04
0.03
0.02
0.01
0
0.02
0.04
0.06
0.08 0.1 0.12 0.14 Noise factor for distance measurements
0.16
0.18
0.2
Figure 4.5: Average positioning error as a function of the Noise Factor nfd . RadioRange = 0.15, p = 0.15 and nfa = 0.10)
(n = 500,
0.1 Distributed SOCP with p = 0.15 MDS−MAP(P,R) with p = 0.15 MDS−MAP(P,R) with p = 0.01
0.09
0.08
Average Positioning Error
0.07
0.06
0.05
0.04
0.03
0.02
0.01
0 0.1
0.15
0.2 0.25 Noise factor for anchor positions (nfa)
0.3
0.35
Figure 4.6: Average positioning error as a function of nfa and p. (n = 500, RadioRange = 0.10 and nfd = 0.01)
46 typically not feasible due to the resource constraints, increasing the radio range for the RNs is more reasonable. Also, in reality RNs tend to have more transmit power and a longer range. Fig. 4.7 illustrates the effect of increasing the radio range of the RNs while keeping the range of the other nodes fixed. Increasing the radio range of the RNs from 0.10 to 0.15 results in a very significant improvement in the UN positioning accuracy, but further increase in the RN radio range does not improve the positioning. This behavior can be explained as follows. During position estimation for a UN, we use information from only those nodes and RNs which are within its radio range. We do not account for the fact that some RNs are able to transmit to a UN even though the UN cannot transmit to those RNs (due to asymmetric radio ranges). In effect, we use information from only those nodes which have a bidirectional link with the UN. So the increased range of the RNs only aids in refining the position estimates of the RNs when they communicate with other RNs, which improves the positioning accuracy of the UNs, but with diminishing return. Further improvement in positioning accuracy can be expected by using information from all RNs which can transmit to a given UN. We now revisit the irregular C-shaped network and use longer ranges for the RNs than the other nodes in the network. Radio range of the RNs is labeled as RadioRangeRef and the radio range of all other nodes is labeled as RadioRangeSensor. Fig. 4.8 shows the positioning result when the radio range is 0.20 for the RNs and 0.15 for all other nodes. The average positioning error is 0.031 (20.6% of the RadioRangeSensor), a 10% improvement over the accuracy achieved with the radio range set to 0.15 for both RNs and other nodes. Fig. 4.9 shows the results with the RN range increased to 0.25 resulting in an average positioning error of 0.025 (16.7% of the RadioRangeSensor).
4.5
Tracking a Mobile Sensor Node
In this section we consider the scenario where the goal is to track a mobile sensor node in an indoor environment using a few high-power and long range RNs. This arises in situations such as tracking fire-fighters, who are on a rescue mission, inside a building on fire. The fire-fighters will have wearable sensors which can be tracked using high-power transmitters placed outside the building. To make the experiments more realistic, we include a fading coefficient (f ), which represents
47
0.04 n = 1000, nfa = 0.10, nfd = 0.05, RadioRangeSensor = 0.10 0.038
0.036
Average Positioning Error
0.034
0.032
0.03
0.028
0.026
0.024
0.022
0.02 0.1
0.15
0.2
0.25 RadioRangeRef
0.3
0.35
Figure 4.7: Average UN positioning error as a function of the radio range of the reference nodes (RadioRangeRef ). (n = 1000, p = 0.15, nfd = 0.05, nfa = 0.10, RadioRangeSensor = 0.10)
the fraction of all RNs which cannot be heard by the mobile node at any given time. This models the obstructions encountered in indoor environments which limit the number of RNs that can be heard at any point. The RNs are placed equidistantly at the boundary of a [−0.5, 0.5]2 square grid. We use 8 RNs for the experiments. The tracking results of our algorithm under different parameter settings are shown in Figs. 4.10 and 4.11. In Fig. 4.10 the distance estimates have ±15% error standard deviation (nfd = 0.15) whereas in Fig. 4.11 nfd = 0.10. There is no significant degradation in the results as the error standard deviation in the RN positions was increased from 5% to 15% (nfa = 0.05 to 0.15). Thus we kept nfa fixed at 0.10 for all the tracking results shown here. The estimated tracks are fairly accurate with up to 15% error standard deviation in the distance estimates. Distance estimates with more than 20% error standard deviation begin to degrade the results. The various error metrics for these experiments are shown in Table 4.3.
48
Average Positioning Error = 0.031 0.5
0.4
0.3
0.2
0.1
0
−0.1
−0.2
−0.3
−0.4
−0.5 −0.5
−0.4
−0.3
−0.2
−0.1
0
0.1
0.2
0.3
0.4
0.5
Figure 4.8: Distributed SOCP results for irregular (C-shaped) topology: n = 300, RadioRangeSensor = 0.15, RadioRangeRef = 0.20, p = 0.15 and nfd = 0.05. err = 0.031 and errmax = 0.444. True positions of the UNs (◦) and RNs (¦) along with the estimated node positions (+). The solid lines indicate the error between the estimated and true UN positions.
Test Run
nfd
f
1 2 3 4
0.15 0.15 0.10 0.10
0.50 0.40 0.50 0.40
Number of RNs Heard 4 5 4 5
Average Error 0.094 0.075 0.061 0.044
Error Standard Deviation 0.043 0.026 0.038 0.029
Maximum Error 0.182 0.152 0.169 0.117
Table 4.3: Simulation parameters for the tracking results. f is the fading coefficient, total number of RNs = 8, nfa = 0.10 for all test runs.
49
Average Positioning Error = 0.025 0.5
0.4
0.3
0.2
0.1
0
−0.1
−0.2
−0.3
−0.4
−0.5 −0.5
−0.4
−0.3
−0.2
−0.1
0
0.1
0.2
0.3
0.4
0.5
Figure 4.9: Distributed SOCP results for irregular (C-shaped) topology: n = 300, RadioRangeSensor = 0.15, RadioRangeRef = 0.25, p = 0.15 and nfd = 0.05. err = 0.025 and errmax = 0.429. True positions of the UNs (◦) and RNs (¦) along with the estimated node positions (+). The solid lines indicate the error between the estimated and true UN positions.
50
0.6
0.4
0.2
0
−0.2
−0.4
−0.6 −0.6
−0.4
−0.2
0
0.2
0.4
0.6
Figure 4.10: Tracking Results: Circles (◦) on the [−0.5, 0.5]2 square grid represent the true RN positions, the diamonds (¦) represent the inaccurate RN positions used for the experiments. ⊕ indicates mobile node positions along the actual path. Solid lines indicate the actual path followed by the mobile node. Estimated paths are indicated by dash-dot lines for test run 1 and dotted lines for test run 2. (Test Run 1: nfd = 0.15, f = 0.50. Test Run 2: nfd = 0.15, f = 0.40 )
51
0.6
0.4
0.2
0
−0.2
−0.4
−0.6
−0.6
−0.4
−0.2
0
0.2
0.4
0.6
Figure 4.11: Tracking Results: Circles (◦) on the [−0.5, 0.5]2 square grid represent the true RN positions, the diamonds (¦) represent the inaccurate RN positions used for the experiments. ⊕ indicates mobile node positions along the actual path. Solid lines indicate the actual path followed by the mobile node. Estimated paths are indicated by dash-dot lines for test run 3 and dotted lines for test run 4. (Test Run 3: nfd = 0.10, f = 0.50. Test Run 4: nfd = 0.10, f = 0.40)
52
4.6
Asynchronous Distributed Algorithm
In this section we consider asynchronous execution of the distributed SOCP algorithm. The motivation for this is to understand the convergence properties of the algorithm under asynchronous execution, and to compare the time to convergence and communication penalty with its synchronous counterpart. We also demonstrate a variation of the asynchronous algorithm that allows the distributed SOCP approach to be used with fewer RNs.
4.6.1
Synchronous vs. Asynchronous
Asynchronous algorithms lack the notion of phases and coordination between the different processors is less strict. To simulate asynchronous execution for the SOCP algorithm, we randomly pick the nodes which will update their positions during any given iteration. Each node localizes itself based on whatever information happens to be available from its neighbors at that time; including some information which may not have been updated for the last few iterations. Table 4.4 presents a representative comparison between the synchronous and asynchronous executions of the algorithm. It is seen that the asynchronous algorithm needs about three times as many iterations to achieve the same positioning accuracy as the synchronous version. Despite this fact, the computational time per node (excluding the time for communication) increases by a much smaller factor. The communication requirements for the asynchronous version might exceed those for the synchronous execution due to the larger number of iterations resulting in more message exchanges between nodes. Note that the tradeoff between computation time and the number of messages assumes that there are no queuing delays affecting the computation. Considering the results in Table 4.4 it can be said that the asynchronous algorithm converges at about the same rate as the synchronous algorithm. This agrees with the analysis of other well-known algorithms such as the Bellman-Ford algorithm.
4.6.2
Localization with fewer RNs using the asynchronous algorithm
One of the advantages of a distributed iterative localization algorithm is the ability to use the nodes positioned in one iteration as pseudo RNs in the following iterations. The distributed SOCP algorithm makes use of this implicitly. Here we outline a procedure to make explicit use of this, thus allowing the algorithm to localize the nodes using fewer RNs.
53
Total Number of Iterations Synchronous Asynchronous
20 60
Computational time per node (in sec) 1.91 2.67
Average Position Error Before RN After RN Refinement Refinement 0.0436 0.0232 0.0447 0.0213
Table 4.4: Comparison of Synchronous and Asynchronous Algorithm Execution. Simulation parameters: n = 1000, nfd = 0.05, nfa = 0.10, p = 0.15, RadioRangeRef = 0.15, RadioRangeSensor = 0.10.
In a variation of the asynchronous algorithm, instead of randomly choosing nodes which update their positions in a given iteration, the position update will be based on the availability of at least three neighboring nodes which have obtained an estimate of their position. Fig. 4.12 shows the positioning results for a network with n = 500 nodes and 5% RNs (or 25 RNs). The RNs are placed on a uniform grid to ensure good coverage. It is seen that the results converge giving an average positioning error of 0.0346 (or 21.6% of the RadioRangeSensor). This illustrates the ability of the distributed SOCP approach to localize nodes with fewer RNs, without loss of positioning accuracy. Finally, in Table 4.5 we provide a representative comparison of the distributed SOCP, dwMDS [1] and MDS-MAP algorithms [2] in terms of performance and complexity, on networks with a low percentage of RNs. Some of the parameter values are estimated based on the data presented in [2, 1]. dwMDS and distributed SOCP are similar in computational complexity, however the distributed SOCP method provides better accuracy. The results using MDS-MAP algorithms, despite using O(n3 ) operations, do not differ significantly from the distributed SOCP algorithm.
54
Average Positioning Error = 0.0346 0.5
0.4
0.3
0.2
0.1
0
−0.1
−0.2
−0.3
−0.4
−0.5 −0.5
−0.4
−0.3
−0.2
−0.1
0
0.1
0.2
0.3
0.4
0.5
Figure 4.12: Asynchronous distributed SOCP using low percentage of RNs: n = 500, p = 0.05, RadioRangeRef = 0.16, RadioRangeSensor = 0.16, nfd = 0.10 and nfa = 0. Positioning error err = 0.0346. True positions of the UNs (◦) and RNs (¦) along with the estimated node positions (+). The solid lines indicate the error between the estimated and true UN positions.
44 44 44 44 44 200 200 200
0.30 0.30 0.30 0.30 0.30 0.05 0.05 0.05
nfd 0.09 0.09 0.09 0.09 0.09 0.05 0.05 0.08
p 0.43 0.43 0.61 0.43 0.61 0.15 0.15 0.22
RadioRange
Avg Node Connectivity (nc ) – – – 13.0 24.6 12.2 12.2 21.4
Position Error (% RadioRange) Mean Median RMS – – 71.7% – – 41.3% – – 26.7% 27.6% 29.2% 30.7% 24.1% 23.2% 26.4% – 17% – – 6% – 11.6% 10.5% 12.7%
O (nnc L) ¡ 3¢ n ¡ ¢ ¡ O ¢ O nn3c + O n3 O (nnc L)
O (nnc L)
Computational Complexity ¡ ¢ O n3
Table 4.5: Comparison of different localization algorithms on random Uniform networks. L represents the number of iterations needed for the algorithm to converge (typically a small number). † Experimental data and results from [1]. ‡ Simulation results from [2].
MDS-MAP(C)‡ MDS-MAP(P, R)‡ Dist. SOCP
Dist. SOCP
dwMDS †
MDS-MAP(C)†
n
55
56
4.7
Conclusion
The proposed distributed algorithm based on SOCP relaxation solves the sensor network localization problem, in the presence of inaccuracies in the RN positions and distance measurements, with significant computational savings and without sacrificing positioning accuracy. An extensive numerical study of the algorithm under different scenarios has been presented. This method is also able to improve positioning of the RNs which are in the convex hull of their neighbors. The asynchronous version of the algorithm also shows good convergence properties and allows localization with fewer RNs.
57
Chapter 5
Implementation of a Directional Beacon based Positioning Algorithm In this chapter we discuss the implementation of a directional beacon (DB) based positioning algorithm using narrowband radio frequency (RF) signals. We develop a signal processing framework to work with the low-accuracy experimental data obtained using low-cost hardware. The positioning algorithm allows each unlocalized node (UN) to compute its position with respect to a set of reference nodes (RNs) which are equipped with rotational directional antenna. The system implementation is based on the GNU Radio software platform and uses Universal Software Radio Peripheral (USRP) as the hardware component. Even though the technique needs some modification at the RNs in the form of a rotational directional antenna, we show that the UNs do not need hardware modifications. In contrast to positioning algorithms that rely on the bandwidth and propagation time of the transmit signal, the positioning algorithm used here depends on the width of the antenna beampattern and the rotational speed of the directional antenna. Our lowcost implementation using directional antenna and stepper motor provides sub-meter positioning accuracy. Another important advantage of this algorithm is that it does not require any synchronization between the RNs and the UN. However, the RNs are assumed to be synchronized. We use intelligent techniques such as maximum likelihood (ML) based amplitude estimation and least
58 squares based line-sf-sight (LOS) time-delay estimation, to estimate the bearing of the UN with respect to each of the RNs in the presence of multipath components due to reflection etc. We also demonstrate a technique to combine received signal data from multiple transmit antenna rotations to improve the estimation accuracy. These techniques allow us to obtain enhanced position estimates with sub-meter accuracy.
5.1
Localization Principle, Signal Model and Positioning Algorithm
5.1.1
Localization Principle and System Model
This section summarizes the localization principle that is the basis for the directional beacon (DB) based positioning algorithm [43]. We refer to the nodes whose positions are known a priori as the reference nodes (RNs) and nodes whose positions are unknown as the unlocalized nodes (UNs). Consider a wireless network that contains three reference nodes RN-1, RN-2 and RN-3. The RNs can be located at arbitrary but known positions. For simplicity, we consider that the RNs are located at the corners of a rectangular field as shown in Fig. 5.1. We further assume that the co-ordinate system origin is at RN-3. Now, consider the situation where a unlocalized node Q joins the network and needs to determine its coordinates (x, y) with respect to the RNs. We now describe the DB based algorithm which will allow node Q to determine its coordinates. This algorithm requires each RN to be equipped with a rotating directional antenna. The hardware implementation of the rotating antenna is discussed in the next section. The localization principle is based on observing the times when node Q receives the different beacon signals, and estimating its angular bearings and location with respect to the RNs by triangulation [44, 45]. It is necessary that the transmissions from different RNs are distinguishable at Q. This may be achieved, for example, by using different frequencies or coded sequence of pulses for each beacon. If the times at which Q receives beacons from RN-1, RN-2 and RN-3 are t1 , t2 and t3 , respectively, the bearings of Q (refer to Fig. 5.1) can be obtained as: α = φ1 − ω(t2 − t1 ) β = φ2 − ω(t3 − t2 )
(5.1)
where ω is the angular speed of the rotating directional beam in rad/s, and φ1 and φ2 are the
59
RN-2 (0, L2 )
(L1, L2 ) RN-1
�
�
�
2
1
X
Y
L2
� Q (x,y)
�
RN-3
3
(0,0)
L1
Figure 5.1: Arrangement of the reference nodes and the coordinate system. constant angular separation between the directional beams of the RNs. φ1 and φ2 can be expressed in terms of the initial angular positions of each of the RN antenna beams (θi , i = 1, 2, 3 shown in Fig. 5.1). Thus, φ1 = θ1 − θ2 and φ2 = θ2 − θ3 . From (5.1) it is clear that absolute timings are not required as we are dealing with time differences in calculating the bearings. The coordinates (x, y) can be obtained by making use of the geometry of the RNs. Using simple trigonometry, it can be shown that the coordinates (x, y) of the node Q can be computed as L2 cos γ cos(β − γ) sin β L2 cos γ y= sin(β − γ) sin β
x=
where
µ γ = tan
−1
L2 cot β − L1 L1 cot α − L2
(5.2) ¶
The symmetric arrangement of the RNs in Fig. 5.1 leads to a simple relation in (5.2). However, the localization principle used to arrive at (5.2) is valid for any arrangement of the RNs.
5.1.2
Signal Model
Each of the RNs (RN-1 to RN-3) is assumed to transmit a continuous time signal with a complex low-pass equivalent represented as p(t). Then the low-pass equivalent of the received signal at the
60 UNs is given by r(t) = z(ϕ)p(t) + ν(t)
(5.3)
where ν(t) is the additive noise and z(ϕ) is the amplitude profile of the received signal which is a function of the angular position ϕ = ωt of the directional antenna. The amplitude profile z(ϕ) includes the effect of path loss and the antenna beampattern. In the presence of reflectors, z(ϕ) can be modeled as z(ϕ) =
M X
am s(ϕ − ψm )
(5.4)
m=1
where s(ϕ) is the expected amplitude profile based on the actual beampattern of the directional antenna. In (5.4), we assume that M signal components (the LOS and multipath components) M are received at the UN with amplitudes {am }M m=1 and angular shifts {ψm }m=1 determined by the
angle of departure of the signal components from the directional antenna. In discrete time, the received signal samples can be expressed as r(n) = z(n)p(n) + ν(n)
(5.5)
where r(n) := r(t)|t=nTs , z(n) := z(ϕ)|ϕ=nωTs and Ts is the sampling time. Thus, the amplitude profile of the received signal can be written as z(n) =
M X
am s(n − τm )
(5.6)
m=1
where s(n) := s(ϕ)|ϕ=nωTs and τm := ψm /ωTs . The signal model in (5.6) highlights the differences between the DB based positioning algorithm and the conventional time-of-arrival (TOA) schemes. One important difference is in the interpretation of s(n). In TOA schemes, s(n) refers to the transmitted pulse in the time domain while in the DB based positioning algorithm s(n) corresponds to the beampattern of the directional antenna. Thus, the antenna beam-width in the DB algorithm is analogous to the pulse-width in TOA schemes. Similarly, where the accuracy of TOA schemes is dependent on the pulse-width (or signal bandwidth in the frequency domain) and the propagation speed, the positioning accuracy of the DB algorithm depends on the beampattern and rotational speed ω of the antenna. A quantitative discussion of these issues in presented in Section 5.5.4.
5.1.3
Directional Beacon based Positioning Algorithm
The directional beacon based positioning algorithm requires detection of the LOS component to mark the time instant when the transmitting beam is aligned with the receiver. Different
61 approaches can be used to detect the LOS component. For instance, the scheme in [45] searches for the maximum of the received signal strength in order to mark the times. Due to the very nature of indoor multipath propagation environment, the received signal consists of signal copies due to reflection and scattering in addition to the direct LOS component. We rely on the earliest signal component (instead of the strongest component) to detect the LOS component. This works well for both clear LOS and obstructed LOS scenarios. For the system shown in Fig. 5.1, each RN broadcasts its known position and the initial angular position of its antenna beam. Using this information the unlocalized node Q executes the following steps of the positioning algorithm to localize itself: Step 1. RN-1 transmits a signal continuously while its antenna is being rotated at a constant angular speed (ω). Step 2. The received signal r(t) at the UN consists of multiple copies of the transmit signal due to multipath propagation. The discrete-time samples r(n) of the received signal are stored for further analysis. Step 3. The amplitude profile z(n) of the received signal at the UN is estimated (refer Section 5.3). Step 4. The time shift t1 associated with the LOS signal component in z(n), due to RN-1, is estimated (refer Section 5.4). Step 5. Steps 1-4 are repeated for RN-2 and RN-3 to obtain t2 and t3 , respectively. Finally, the coordinates of the UN are obtained using (5.1) and (5.2).
5.2
Prototype Implementation
In this section, we describe the hardware and software implementation of the directional beacon based positioning algorithm. Our implementation is based on a software defined radio (SDR) platform. We use the GNU radio software and its hardware companion, the Universal Software Radio Peripheral (USRP). The SDR set-up allows us the ease and flexibility to design and transmit user-defined waveforms. In addition, the RF transceiver circuitry is fairly inexpensive. The rotating beacons are generated using a directional antenna coupled to a stepper motor. Further details are
62 described in the following subsections. Figs. 5.2 and 5.3 illustrate the block level set-up at the transmitter and receiver, respectively. Rotating Directional Tx Antenna
USB Cable USRP Board 4 MSamples/s
Motor Mechanical Coupling
Stepper Motor
Motor Controller
GNU Radio
Serial Com HyperTerminal Laptop
Figure 5.2: Hardware setup for the transmitter (or RN) with rotating directional antenna.
Omnidirectional Rx Antenna
USB Cable USRP Board 4 MSamples/s
GNU Radio
20 KSamples/s
Disk Storage
Laptop
Software Defined Radio
Figure 5.3: Hardware setup for the receiver (or UN).
5.2.1
Hardware Platform
The RF front end for the software radio comprises the USRP boards from Ettus Research [68]. The USRP consists of a daughter board (RFX2400), capable of transmitting and receiving RF signals in the 2.4-2.5 GHz band. The USRP also contains a motherboard that includes the universal serial bus (USB) interface, a field-programmable gate array (FPGA) to implement high-speed baseband processing and analog-to-digital converters (ADCs) and digital-to-analog converters (DACs). There are four on-board ADCs each with a 12-bit resolution sampling at 64MSamples/s and four
63 14-bit DACs each operating at 128MSamples/s. The rotating beacons are generated by mounting a directional antenna on the stepper motor. The directional antenna TLX2415, is a 16 element linear antenna array from Telex with a main lobe half-power beam-width of 30◦ [69]. A bipolar stepper motor 8718L-02S, from Lin Engineering, is used to rotate the antenna with a constant angular speed [70]. The stepper motor is chosen to provide a torque of 900 oz-in (6.355 N.m) sufficient to rotate the antenna. For the experiments, a narrowband signal with a bandwidth of 1 KHz is used as the transmit signal and the motor is set to rotate the antenna at 0.47 rpm (ω = 0.049 rad/s).
5.2.2
Software Platform
The software component of the SDR set-up is called the GNU radio which is implemented as an open public license software [71]. GNU radio provides a library of blocks for radio transmission and reception. These blocks are glued together using the Python scripting language. We use gr block and usrp sink c to continuously transmit a single frequency tone. The receiver is implemented using the usrp source c block that captures the data from the RF front end and writes it to a file.
5.2.3
Experimental Setup
The experiments were carried out in an indoor fieldhouse at the University of Minnesota Recreation Center. The test area was a rectangular field measuring 55.14 m by 43 m. Snapshots of the experimental set-up are shown in Figs. 5.4 and 5.5. The RNs were placed at three corners of the rectangular field and the UN whose position is to be determined was placed inside the field.
Figure 5.4: Experimental Setup: The unlocalized node whose position is to be determined.
64
Figure 5.5: Experimental Setup: The reference node equipped with directional antenna.
5.2.4
Data Collection and Processing
Steps 1-4 (from Section 5.1.3) are repeated for each of the RNs. The received signal at the UN is downconverted to a complex baseband signal. The I and Q components of the complex signal are passed through their respective channels. Each channel path has an ADC sampling at 64 MSamples/s. To reduce the burden on the USB interface, the ADC output is downsampled by 32 resulting in a 2 MSamples/s data stream. The digital samples from the I and Q channels are packed together and passed to the GNU radio software through the USB interface. This results in an effective data rate of 4 MSamples/s across the USB. Since each data sample is represented using 4 Bytes, the data rate across the USB is 16 MB/s. The samples of the received signal are finally written to a file. To keep file sizes manageable, we store only the first 32 samples out of every 6400 samples to the hard disk. After the data has been pre-processed, as explained above, the collected data undergoes a number of post-processing steps as illustrated in Fig. 5.6. The details of some of the statistical signal processing algorithms are discussed in the next section. The collected data is first sliced to separate the data from each RN and from multiple antenna rotations at each RN. Next the data undergoes serial-to-parallel conversion into blocks of size Nb samples. Each data block is then subjected to a signal detection test, the results of which are used for further grouping of the data blocks. This aids in the estimation of the received signal amplitude profile. The estimated amplitude profile is used in a least squares (LS) framework for multipath time-delay estimation. Finally, the time delay estimates from all RNs are combined to obtain the bearing and position
65 coordinates of the unlocalized node. Signal Detection
Read received signal data
Data slicing for RN separation & multiple antenna rotations
S/P
Grouping/ Amplitude Estimation
Multipath Time Delay Estimation
Obtain Bearing and Coordinates
Nb:1
Figure 5.6: Post processing of the experimental data using statistical signal processing techniques.
5.3 5.3.1
Signal Detection and Enhanced Amplitude Estimation Signal Detection
Using the GNU radio software, we generate a baseband discrete time signal of the form p(n) = sin(2πfo n + θ) where fo ∈ [0, 1] is the normalized digital frequency and θ is the phase. The discrete-time samples of the transmit signal are passed to the USRP which produces an analog signal of 1 KHz bandwidth. The RFX2400 daughter board on the USRP modulates the analog signal to the 2.4-2.5 GHz RF band. Due to practical constraints, the data transfer over the USB interface to the USRP is intermittent resulting in intermittent signal transmission. We model this scenario, at the receiver, as two hypotheses: H1 represents the case where the data is successfully transferred to the USRP resulting in a successful transmission (and reception) and H0 represents the case where we assume that the data transfer to the USRP failed resulting in only noise being received. Thus, the received signal during the lth data burst under the two hypotheses can be written as H1 : rl (n) = z sin(2πfo n + θl ) + νl (n) H0 : rl (n) = νl (n)
for
n = 0, · · · , Nb − 1
(5.7)
where z represents the amplitude of the received tone that is assumed to be constant over a burst of Nb samples. This assumption is invariably true due to the high sampling rates of the order of 106 samples/s. The amplitude z of the received signal includes the effect of path loss and the antenna beampattern. As a first step we would like to detect whether a given burst of Nb samples belongs to H1 or H0 . The ML estimation of the amplitude z for a given data burst containing Nb
66 samples is given by [72, pg. 195] 2 zˆ = Nb
¯N −1 ¯ b ¯X ¯ ¯ −j2πfo n ¯ rl (n)e ¯ ¯. ¯ ¯
(5.8)
n=0
H0
We then set a threshold ZT to decide between the two hypotheses such that zˆ ≶ ZT . The threshold H1
ZT is empirically set to 5-10% of the maximum value of the received signal. The received signal samples (or data bursts) which were classified under H1 are used for further processing, as outlined in the next subsection.
5.3.2
Enhanced Amplitude Estimation
In order to improve the quality of the ML estimate obtained from (5.8) it is necessary to increase the number of samples used for the estimation. The ML estimate approaches the minimum variance unbiased estimate as Nb → ∞. Since the number of samples in a single burst is fixed at Nb 1 , the quality of the estimate can be enhanced by estimating the amplitude over multiple consecutive data bursts. Let us assume we have L consecutive signal bursts (bursts satisfying hypothesis H1 )2 . In [19] this is formulated as the ML amplitude estimation of a constant frequency sinusoid with unknown initial phase. The vector of received signal samples during the lth burst can be expressed as rl = zHl θ l + ν l T
where rl := [rl (0) · · · rl (Nb − 1)] ,
for l = 1, · · · , L
θ l := [cos θl
(5.9)
sin θl ]T and
0
sin 2πfo Hl := .. . sin(Nb − 1)2πfo
1 cos 2πfo .. .
.
cos(Nb − 1)2πfo
Concatenating the L consecutive bursts r = H θ + ν. £ ¤T where r := rT1 · · · rTL ,
θ := z[θ T1 · · · θ TL ]T and H := diag(H1 · · · HL ). Also note that,
θ T θ = Lz 2 . 1 In 2L
(5.10)
our set-up Nb = 32 since only 32 consecutive samples out of 6400 are stored to the disk. has a maximum limit such that assuming the same amplitude for these bursts is reasonable.
67 Using the result from [19, Chapter 6], the enhanced ML estimate of the amplitude zˆ using L consecutive bursts is given by
s zˆ =
¡ ¢ ˆ = HT H −1 HT r. where θ
5.4
ˆT θ ˆ θ L
(5.11)
Estimating the LOS Component in Multipath Environment
This section describes the procedure for estimating the LOS component in a multipath environment using the least squares error criterion. Let zˆ(n) represent the estimated amplitude of the nth received signal burst obtained using the procedure outlined in Section 5.3. Sample values of zˆ corresponding to the parts of the received signal which were classified as H0 are obtained through linear interpolation of the neighboring samples. Using the multipath model for z(n) presented in (5.6), we can write zˆ(n) =
M X
am s(n − τm ) + η(n)
(5.12)
m=1
where η(n) represents the error between the estimate zˆ(n) and the true profile z(n) given by (5.6). It is important to note that the samples of zˆ(n) in (5.12) are spaced at an interval larger than Ts . Let us assume we have N samples3 of zˆ(n) in a single rotation of the antenna that are used to estimate a = [a1 · · · aM ]T and τ = [τ1 · · · τM ]T . We can write (5.12) in matrix-vector form as ˆ = S(τ )a + η z
(5.13)
ˆ = [ˆ where z z (0) · · · zˆ(N − 1)] and S(τ ) is an N × M matrix with [S(τ )]n,m = s(n − τm ). The least squares (LS) error criterion for the model in (5.13) becomes J(τ , a; n) = ||ˆ z − S(τ )a||2
(5.14)
where ||.|| represents the l2 norm. The minimization of (5.14) poses two problems [73, 74]: 1) the cost function in (5.14) is non-linear in τ , and 2) the estimates {ˆ τm }M m=1 can only take values that are integer multiples of the sampling time period and hence limit the resolution of the estimate. 3 In
our set-up, N = 10000, the number of samples of zˆ(n) in one rotation of the antenna.
68 To overcome these problems we consider the equivalent frequency domain model of (5.12) which can be expressed as z˜(k) = s˜(k)
M X
am e−j2πkτm /N + η˜(k)
for
k = 0, · · · , N − 1
(5.15)
m=1
where z˜(k) =
PN −1 n=0
zˆ(n)e−j2πnk represents the N -point discrete Fourier transform (DFT) of
−1 −1 {ˆ z (n)}N ˜ is the DFT of {s(n)}N n=0 . Similarly, s n=0 . Re-writing (5.15) into an equivalent matrix-
vector form we obtain ˜ )a + η ˜ = G(τ ˜ z
(5.16)
˜ ) := S ˜ D H(τ ) with H(τ ) being an N × M matrix of the ˜ := [˜ where z z (0) · · · z˜(N − 1)]T and G(τ form
1
e−j2πτ1 /N H(τ ) := .. . e−j2π(N −1)τ1 /N
···
1
··· .. .
−j2πτM /N
···
e
.. .
e−j2π(N −1)τM /N
˜ D := diag[˜ and S s(0) · · · s˜(N − 1)]. Now, the least squares error criterion for the frequency domain model in (5.16) can be formulated as ˜ )a||2 . J(τ , a; k) = ||˜ z − G(τ
(5.17)
Since (5.17) is linear in a for a given τ , the least squares estimate for a is given by h i−1 ˜ H (τ )G(τ ˜ ) ˜ H (τ ) z ˆ= G ˜. a G
(5.18)
ˆ from (5.18) into (5.17) reduces the LS error criterion to Substituting a ˜ ⊥ (τ ) z ˜||2 J(τ ; k) = ||G
(5.19)
h i−1 ˜ ⊥ (τ ) = IN − G(τ ˜ ) G ˜ H (τ )G(τ ˜ ) ˜ H (τ ). where G G It has been shown that the error function in (5.19) is highly oscillatory or multimodal [73] with closely spaced multiple local minima which makes the minimization extremely difficult. A ˆ to be complex which results in a solution, suggested in [73, 74], is to allow the amplitude estimate a ˜ D forces the amplitude ˜ and S smoother error function. The conjugate symmetry associated with z ˆ to be complex, we need to consider the single estimates in (5.18) to be real. Thus, to permit a
69 sided spectrum in the least squares error function (5.17). Hence we define the following using single-sided spectrums: N − 1)]T , 2 N := diag[˜ s(0) · · · s˜( − 1)] 2
˜p := [˜ z z (0) · · · z˜( ˜ Dp S
1
e−j2πτ1 /N Hp (τ ) := .. . N e−j2π( 2 −1)τ1 /N
and
···
1
··· .. .
−j2πτM /N
···
e
.. . N
.
e−j2π( 2 −1)τM /N
We can now re-write the LS error function in (5.17) as ˜ p (τ )aC ||2 , JC (τ , aC ; k) = ||˜ zp − G ˜ p (τ ) = S ˜ Dp Hp (τ ) and the LS estimate of the complex amplitudes given by with G h i−1 ˜ H (τ )G ˜ p (τ ) ˜ H (τ ) z ˆC = G ˜p . a G p p
(5.20)
(5.21)
ˆC into (5.20) leads to JC (τ ; k) that is known to be a smoother function with far Substituting a fewer oscillations [73]. However, the minimum of JC (τ ; k) is not the true minimum of J(τ ; k). Adding a penalty term proportional to the imaginary part of aC to JC (τ ; k) allows us to control its smoothness [73]. The modified error function can be written as 0 0 0 ˜ 0 (τ )ˆ JC (τ ; k) = ||˜ zp − G aC ||2 (5.22) p ˜ p (τ )} −Im{G ˜ p (τ )} Re{˜ zp } Re{G Re{ˆ aC } 0 0 ˜0 . ˜ p (τ )} ˜ p (τ )} and a ˜p := Im{˜ ˆC := where z zp }, Gp (τ ) := Im{G Re{G Im{ˆ aC } 0 0 αp IM The penalty term is controlled by αp that allows us to trade-off between the smoothness of
JC (τ ; k) and its bias from the global minimum of J(τ ; k). We solve for τˆ by minimizing the error ˆC from (5.21). function in (5.22) after substituting for a
5.4.1
LOS Estimation using Data from Multiple Repeated Antenna Rotations
Our experimental setup allows us to collect received signal samples at the UN for multiple repeated rotations of the transmit antenna at the RNs. Assuming the environment has not changed significantly between rotations, the data collected during each rotation will result in similar amplitude
70 profiles. If we collect N samples in each of the R rotations then the received signal vector of N R samples can be modeled as ˆ(R) = S(R) (τ )a + η z
(5.23)
£ ¤ ˆ(R) = [ˆ where z z (0) · · · zˆ(N R−1)]T and S(R) (τ ) is an N R×M matrix with S(R) (τ ) n,m = s(hniN − τm ), where h·iN represents modulo-by-N operation. For M multipaths, we have τ = [τ1 · · · τM ]T and a = [a1 · · · aM ]T . Similar to (5.15), the frequency domain model for the data from R rotations of the antenna can be expressed as z˜(R) (k) = s˜(R) (k)
M X
am e−j2πkτm /N R + η˜(k)
for
k = 0, · · · , N R − 1
(5.24)
m=1 R−1 ˆ(R) and {s(hpiN )}N where z˜(R) (k) and s˜(R) (k) represents the N R-point DFT of z p=0 , respectively.
Transforming (5.24) into matrix-vector form, we obtain ˜ (R) (τ )a + η ˜(R) = G ˜ z
(5.25)
where ˜(R) := [˜ z z (R) (0) · · · z˜(R) (N R − 1)]T , ˜ (R) (τ ) := S ˜ (R) H(R) (τ ), G D ˜ (R) := diag[˜ S s(R) (0) · · · s˜(R) (N R − 1)] D £ ¤ and H(R) (τ ) an N R × M matrix with H(R) (τ ) p,m = e−j2π(p−1)τm /N R . The LS estimates of a and τ can be obtained by minimizing an LS error function of the form (5.22).
5.5 5.5.1
Experimental Results Estimation of Amplitude Profile
The first step in the DB based positioning algorithm is to estimate the amplitude profile of the sinusoidal signal received at the unlocalized node Q. A typical plot of the received signal at node Q for one 90◦ rotation of the transmitting antenna at RN-2 is shown in Fig. 5.7. The ML estimate of the amplitude profile zˆ(n), using (5.8) to estimate the amplitude of the sinusoid in a single burst of the received data, is shown in Fig. 5.8(a). To improve the estimated amplitude profile, we determine the instances of consecutive signal bursts and obtain an enhanced ML estimate of the
71
6000
Amplitdue of the received signal
4000
2000
0
−2000
−4000
−6000
0
10
20
30 40 50 60 70 Instantaneou angle of rotating antenna in degrees
80
90
Figure 5.7: Received signal from 90◦ rotation of the RN-2. sinusoid amplitude using (5.11). The enhanced amplitude profile is shown in Fig. 5.8(b). The use of consecutive bursts to estimate the amplitude reduces the effect of noise as seen by comparing Figs. 5.8(a) and 5.8(b).
5.5.2
Estimation of the LOS Component
We use the algorithm described in Section 5.4 to estimate the LOS and multipath components in the received signal data. For simplicity, we use M = 2, i.e., we consider the LOS component and a single reflection or multipath component. In our experimental setup, the estimated amplitude profile zˆ(n) consists of N = 10000 samples for 90◦ rotation of the directional antenna (ϕ = 0 to 90◦ ). These samples are taken every 3.2 ms. In Fig. 5.9(a) a plot of the estimated amplitude profile zˆ(n) for the received signal from RN-3 is shown. The antenna beampattern (or radiation pattern) for the azimuth angle ranging from 0 to 90◦ , which represents s(n), is shown in Fig. 5.9(b). To keep the required computations at a reasonable level, we downsample zˆ(n) and s(n) by 16 and use 1024-point DFT. For the penalty term in (5.22), we use αp = 104 . MATLAB optimization routines (fminunc) are used to minimize (5.22) and obtain the time-delay estimate τˆ = [ˆ τ1 τˆ2 ]T . ˆC = [ˆ Substituting τˆ in (5.21) gives us the LS estimate of the complex amplitude a aC1 a ˆC2 ]T which comprises the LOS and multipath component amplitudes. For the received signal from RN-3, the
72
5000
4500
Estimated amplitude of the sinusoid
4000
3500
3000
2500
2000
1500
1000
500
0
0
10
20
30 40 50 60 70 Instantaneou angle of rotating antenna in degrees
80
90
(a) ML amplitude estimation using single burst of Nb = 32 samples.
5000
4500
Estimated amplitude of the sinusoid
4000
3500
3000
2500
2000
1500
1000
500
0
0
10
20
30 40 50 60 70 Instantaneou angle of rotating antenna in degrees
80
90
(b) ML amplitude estimation using multiple consecutive bursts.
Figure 5.8: Estimated amplitude profile of the received signal from RN-2 (Fig. 5.7).
1
0.9
0.9
0.8
0.8
0.7
0.7 Normalized amplitude
1
0.6
0.5
0.4
0.6
0.5
0.4
0.3
0.3
0.2
0.2
0.1
0.1
0
0
10
20
30
40 50 60 Instanteous angle of antenna
70
80
90
(a) Estimated amplitude profile of the received signal.
0
0
10
20
30
40 50 60 Instanteous angle of antenna
70
LOS component A reflection from sidelobe
1
0.8
0.6
0.4
0.2
0
0
10
20
30
80
(b) Antenna Beampattern representing s(n).
1.2
Normalized amplitude
Normalized amplitude
73
40 50 60 Instanteous angle of antenna
70
80
90
(c) Estimated LOS and multipath components.
Figure 5.9: Experimental results based on the received signal from RN-3.
90
74 estimated LOS and multipath components are shown in Fig. 5.9(c) with amplitudes |ˆ aC1 | and |ˆ aC2 |, respectively. We estimate the earliest component (smaller of the τi ’s, i = 1, 2) as the LOS component which is true for both clear LOS and obstructed LOS scenarios. This procedure is repeated for the received signal from each RN to obtain the estimates for ti , i = 1, 2, 3 in (5.1).
5.5.3
Position estimation and lower bound on estimation error variance
Based on the estimated LOS component for each RN, we obtain the corresponding time-delay estimates ti , i = 1, 2, 3. Finally, we use (5.1) and (5.2) to estimate the position of the unlocalized node Q. For further improving the accuracy of the position estimate we use the technique outlined in section 5.4.1 for obtaining the time-delay estimates using multiple 90◦ rotations of the transmitting antenna at each RN. Since this increases the data record length used for estimation, we expect the signal-to-noise ratio (SNR) to increase and the estimation error variance to decrease as we add data from multiple antenna rotations. In Fig. 5.10, we plot the variance of the position estimation error as a function of the number of 90◦ antenna rotations. It is seen that with as few as eight 90◦ rotations of the transmit antenna, the estimation error variance goes down by 10 dB. Let E denote the position estimation error. We obtain a lower bound on the variance of the position estimation error, the details of which are given in Appendix B, as: ¡ ¢ var(E) ≥ Kx2 + Ky2 ·
1 ξ ¯2 No /2 F
(5.26)
It should be noted that this bound is not as tight as the Cramer-Rao lower bound (CRLB) and is rarely attainable, but is mathematically more tractable. Using a single rotation of the antenna, the root mean square value of the position estimation error is 1.457 m. After using data from eight 90◦ rotations of the antenna the root mean square position error goes down to 0.362 m.
75
20 From experimental data Analytical lower bound
Position estimation error variance (in dB)
10
0
−10
−20
−30
−40
−50
−60
1
2
3
4
5
6
7
8
Number of rotations of the antenna
Figure 5.10: Position estimation error variance as a function of the number of rotations of the antenna.
5.5.4
Effect of Time Delay Estimation, Synchronization and Motor Speed Step Errors on Position Estimation
Following the notation used in Appendix B, we can express the estimation error in the x and y coordinates as: ∂g(t) ∂γ · · ω · ∆t = Kx · ∆t ∂γ ∂α ∂h(t) ∂γ ∆ˆ y= · · ω · ∆t = Ky · ∆t ∂γ ∂α
∆ˆ x=
where ∆t is the time delay estimation error. Thus the position estimation error is: E=
p
(∆ˆ x)2 + (∆ˆ y )2 .
(5.27)
On the other hand, for a TOA based technique, the position estimation error corresponding to a time delay estimation error of ∆t is given by: ET OA ≈
p
(c∆t)2 + (c∆t)2
where c = 3 × 10⁸ m/s is the speed of electromagnetic waves in free space.
(5.28)
76 Comparing (5.27) and (5.28) it is seen that the position error for directionality based techniques is proportional to the angular speed of the rotational antenna (ω) while for TOA techniques it is proportional to the signal propagation speed (c) which is many orders of magnitude larger. This comparison is also illustrated in Fig. 5.11. The directional beacon based method results in a positioning error of less than 0.5 m with up to 500 milliseconds error in time delay estimation for ω = 0.049 rad/s. Fig. 5.11 also shows that the time needed for each position estimation using the directional beacon based method can be reduced significantly by increasing ω without significant loss in positioning accuracy. The positioning error remains nearly 8 orders of magnitude smaller than TOA schemes for similar time-delay estimation errors. Similar analysis can be applied to the synchronization error between the reference nodes. The directional beacon based technique can tolerate synchronization errors of the order of milliseconds, which has been shown to be achievable in real applications [56], without significant positioning errors. Another source of error in the directional beacon based algorithm would be due to changes in the angular speed of the rotational antenna (ω). The stepper motor used in our experiments is rated for a step error of ±1.08 arc minutes (or 0.018◦ ). It can be shown that a 500 milliseconds error in time delay estimation is equivalent to a 1.4◦ step error over the duration of one position estimation and the rated step error is close to two orders of magnitude lower. This shows that the step error can be safely ignored as a source of error in our experimental set-up.
5.6
Conclusion
The prototype implementation for a directional beacon based positioning algorithm using RF signals was presented. Novel techniques for improving the position estimation accuracy using maximum likelihood amplitude estimation, least squares based time-delay estimation and combining data from multiple antenna rotations, were presented. It was also shown that the accuracy of the directional beacon based algorithm depends on the width of the antenna beampattern and the rotational speed of the directional antenna. We demonstrated, through experiments, the ability to obtain position estimation results with sub-meter accuracy. The robustness of the algorithm (and the implementation) to timing and synchronization errors was also demonstrated.
77
12
10
Directional Beacon based Method (ω = 0.049 rad/sec) Directional Beacon based Method (ω = 0.098 rad/sec) Directional Beacon based Method (ω = 0.196 rad/sec) TOA based Method
10
10
Position estimation error (in meters)
8
10
6
10
4
10
2
10
0
10
−2
10
−4
10
0
0.05
0.1
0.15 0.2 0.25 0.3 0.35 Error in time delay estimation (in sec)
0.4
0.45
0.5
Figure 5.11: Comparison of the Directional Beacon and TOA based position estimation methods in terms of their sensitivity to time delay estimation error.
78
Chapter 6
Sensor Selection and Event Detection using Heuristic based Sequential Hypothesis Testing In this chapter we address the sensor selection and event detection problems in applications where sensor networks are used for monitoring critical points or infrastructure and detecting abnormal or emergency conditions. In these applications, sensor nodes are used to automatically detect such conditions and enable a central node or the fusion center to take further action. Examples of such applications include detecting leaks in nuclear power plants, detecting heat sources in the context of forest fires etc. The goal in these network deployments is to detect these conditions (or events) with the minimum amount of delay. We propose a greedy heuristic based sensor selection and a sequential detection procedure that significantly improves the detection speed [75]. It will be shown that the greedy heuristic can be expressed in closed form for most probabilistic models. In the proposed model, the fusion center based on some a priori knowledge of the sensors in its neighborhood, selects one sensor at a time while maximizing a greedy heuristic. Specifically, instead of collecting a fixed number of measurements, the fusion center collects measurements from one sensor at each time step, until by some sequential decision rule the collection stops and a decision is made. We compare the performance of the sequential detector with that of a non-sequential or fixed sample size (FSS) detector. The comparison is based on the number of measurements needed
79 to achieve a certain detection accuracy. The sequential procedure significantly outperforms the FSS detector in that it always needs fewer measurements on average to achieve the same detection performance. A simplified heuristic is also derived for the Gaussian probabilistic model. The simplified heuristic performs as good as or slightly better than the greedy heuristic. The greedy heuristic based sensor selection provides a general framework applicable for arbitrary probabilistic models and for models where a simplified heuristic is difficult to obtain. We also present an extension of the sensor selection and sequential detection procedure for M-ary hypothesis testing problems.
6.1
Sensor Selection and Event Detection: System Model
In this section we describe the underlying system model. A wireless sensor network typically consists of a fusion center – a central node with high computational power for data processing and decision making, few local coordinator nodes – nodes with relatively high computational power which manage sensor nodes in a certain geographical region, and a large number of sensor nodes. Fig. 6.1 illustrates the system architecture. The fusion center communicates with the local coordinators directly or through multiple hops involving other nodes. As a result of this communication the fusion center is aware of the overall network topology. We consider sensor network deployments aimed at event detection where sensor nodes are used to automatically detect critical events or conditions. It has been observed that typically the occurrence and non-occurrence of events can be modeled as two hypotheses which differ in the statistics (or distributions) of the sensor measurements. The local coordinators are tasked with querying the sensor nodes in their region regularly to obtain estimates of the measurement statistics. This can be carried out using a mechanism similar to continuous probabilistic query (CPQ) proposed in [54]. The local coordinators pass this information to the fusion center which uses it to query specific sensor nodes, following some sensor selection criterion, allowing it to detect events when they occur. This outlines the centralized framework where the decision making and event detection occurs at the fusion center. If the local coordinators manage relatively large geographical regions a distributed implementation might be more efficient where each local coordinator uses the above framework to detect events in its region and notifies the fusion center when an event is detected.
80
Fusion Center
Local Coordinator
Local Coordinator
Figure 6.1: Typical Wireless Sensor Network System Model
6.2
Binary Sequential Hypothesis Testing
Consider a scenario where the goal is to detect the occurrence of an event using a network of N sensor nodes. We can formulate this as a binary hypothesis testing problem, where H0 represents the null hypothesis or non-occurrence of the event and H1 the alternative hypothesis or the case where the event occurred. Assuming we have some knowledge about the probability density functions (PDF) or distributions of the sensor measurements under each hypothesis, we can model the two hypotheses as: ¡ ¢ H0 : y k ∼ p y k /H0 and ¡ ¢ H1 : y k ∼ p y k /H1 , for k = 1, . . . , N (6.1) ¡ ¢ where y k represents the k th sensors’ measurement and p y k /Hm , m = 0, 1 its conditional PDF. Let ynk denote the k th sensors’ measurement at the nth sampling instant. Given a set of measurements {y1k1 , · · · , ynkn }, where the sequence ki (i = 1, . . . , n) represents the indices of the sensors which were selected for measurement at each sampling instant, we can compute the log-likelihood ratio Λ(n) as:
( Λ(n) = log
p(y1k1 , · · · , ynkn /H1 ) p(y1k1 , · · · , ynkn /H0 )
A sequential decision rule is formulated as follows: 1. Decide H1 if Λ(n) > b 2. decide H0 if Λ(n) < a, else
) (6.2)
81 3. perform another measurement if Λ(n) > a and Λ(n) < b. where a and b are thresholds such that −∞ < a ≤ 0 ≤ b < ∞. This is an example of a sequential probability ratio test (SPRT). It has been shown that SPRT is the detector with the smallest average sample size [76]. Using Wald’s approximation, the thresholds a and b are given as: µ
¶ PD b ' log PF A µ ¶ 1 − PD a ' log 1 − PF A
(6.3)
where Z
∞
PD = Probability of detection =
p (Λ(n) > b/H1 ) dΛ b
Z
PF A = Probability of false alarm =
∞
p (Λ(n) > b/H0 ) dΛ.
(6.4)
b
For a desired detection performance, in terms of PD and PF A , we can use (6.3) to determine the thresholds. Assuming that all the sensor measurements are independent the log-likelihood ratio can be written in a recursive form as [77]: ) (Ãn−1 ! kn Y p(y ki /H1 ) p(y /H ) 1 n i Λ(n) = log · ki p(y p(ynkn /H0 ) i /H0 ) i=1 ½ ¾ p(ynkn /H1 ) = Λ(n − 1) + log p(ynkn /H0 )
6.3
(6.5)
Greedy Heuristic based Sensor Selection
In event detection problems, in addition to meeting the performance criterion based on the detection and false alarm probabilities, it is equally important to detect the occurrence of the event as soon as possible. Assuming that each sensor observation takes the same amount of time, we would like to select the sensors to be sampled for measurement in a way that minimizes the total observation time. In other words, we would like to select as few sensors as possible while meeting the detection performance. Based on this we define the following greedy heuristic: At each time instant, select a sensor for measurement which maximizes the probability of making a correct decision on the next time instant (PC ). The probability of making a correct decision can be expressed as the sum of: (a) probability that Λ(n) > b (i.e., decide on H1 ) when H1 is the true hypothesis, and (b) probability that Λ(n) < a
82 when H0 is the true hypothesis. Thus we can express the greedy heuristic or the probability measure PC as: PC (k, n) = P (Λ(n) > b/H1 ) · P p (H1 ) + P (Λ(n) < a/H0 ) · P p (H0 ) where
½ Λ(n) = Λ(n − 1) + log
p(ynk /H1 ) p(ynk /H0 )
(6.6)
¾
and P p (Hm ), m = 0, 1 represents the a posteriori probability of each hypothesis which can be written as: ³ ´ kn−1 P p (H1 ) = P H1 /y1k1 , · · · , yn−1 ³ ´ kn−1 P y1k1 , · · · , yn−1 /H1 · P (H1 ) ³ ´ = kn−1 P y1k1 , · · · , yn−1 nQ ³ ´o n−1 ki p y /H · P (H1 ) 1 i i=1 ´ ´ ³ . = ³ kn−1 kn−1 /H1 · P (H1 ) /H0 · P (H0 ) + P y1k1 , · · · , yn−1 P y1k1 , · · · , yn−1 Thus, P p (Hm ) = P
Pm (n − 1) · P (Hm ) , m=0,1 Pm (n − 1) · P (Hm )
where Pm (n − 1) =
n−1 Y
for m = 0, 1
(6.7)
³ ´ p yiki /Hm
i=1
and P (Hm ) is the a priori probability of each hypothesis before any sensor measurements were obtained. At any time instant n we perform the following maximization to decide which sensor to select for the next measurement: kn = argmax k
6.3.1
PC (k, n) where
k ∈ {1, · · · , N }.
(6.8)
Greedy sensor selection and sequential detection
The overall combined strategy for greedy heuristic based sensor selection and sequential detection can be outlined as follows: Step 1. Compute the thresholds a and b based on the desired detection performance (PD and PF A ). Step 2. Initialize Λ(0) = 0 and i = 1.
83 Step 3. Greedy Selection: Solve for ki , the index of the sensor to be used for the next measurement, using (6.8) and (6.6). Step 4. Obtain measurement from the kith sensor and update the log-likelihood ratio to Λ(i) using (6.5). Step 5. Compare the log-likelihood ratio to the thresholds based on the sequential decision rule. Step 6. Repeat steps 3 − 5 above for successive measurements (i = i + 1), until a decision is made in step 5.
6.4
Optimal Sensor Selection
In this section we consider the optimal sensor selection strategy. The optimal sensor selection strategy can be stated as follows: Given the sample observation values yiki , where i = 1, . . . , n and ki ∈ {1, . . . , N }, from all sensors for all time steps, choose a sequence of sensors (or sensor observations) which will allow us to make a decision at the earliest (i.e., shortest sequence) while maximizing the probability of a correct decision. The optimal sensor selection and optimal sequence length are determined as follows (refer to Fig. 6.2 for an illustration of the optimal selection strategy with two sensors): Step 1. We assume that the observation values yiki , where i = 1, . . . , n and ki ∈ {1, . . . , N }, from all sensors for all time steps are known a priori. Step 2. Start with all sequences of length i = 1. Step 3. For each sequence of length i (there are O(2i ) such sequences), compute the loglikelihood ratio and compare it with the thresholds a and b based on the sequential decision rule. Step 4. If any sequence in step 3 results in a decision it represents the optimal sequence. If more than one sequence of length i results in a decision, the optimal sequence is chosen as the one which maximizes the posteriori probability.
84 Step 5. Repeat steps 3 − 4 for sequences of length i = i + 1, until a decision results in step 4. In Section 6.9 we provide a representative comparison, based on Monte Carlo simulations, between the greedy heuristic based sensor selection and the optimal sensor selection strategies.
6.5
Analytical Evaluation under Gaussian Modeling
The general framework for sequential detection and greedy heuristic based sensor selection was presented in Sections 6.2 and 6.3. We now consider a specific model and provide detailed analysis for the sensor selection and sequential detection problems. We assume the sensor measurements to be modeled as being Gaussian distributed. This model is justified since measurement noise in sensors is frequently modeled by a zero-mean Gaussian distribution with finite variance. In addition, in parametric estimation theory estimation errors are commonly approximated using Gaussian distributions. Consider the binary hypothesis testing problem with N sensors which are the available sources of measurements. The hypotheses can be expressed as: 2 H0 : y k ∼ N (µ0,k , σ0,k ) 2 H1 : y k ∼ N (µ1,k , σ1,k ) for
k = 1, · · · , N.
(6.9)
Using this we obtain an expression for PC (k, n). à ! µ ¶ σ0,k (ynk − µ0,k )2 (ynk − µ1,k )2 P (Λ(n) > b/H1 ) = P Λ(n − 1) + log + − > b/H1 2 2 σ1,k 2σ0,k 2σ1,k à ! (ynk − µ0,k )2 (ynk − µ1,k )2 =P − > b − Cn−1 /H1 (6.10) 2 2 2σ0,k 2σ1,k
Sensor 1
y11
y12
y31
y14
y1n
Sensor 2
y12
y22
y32
y42
yn2
Time steps
Figure 6.2: Optimal sensor selection with two sensors (or observation/data sources) for n time steps. yiki represents the sample observation from the kith sensor at the ith time step.
85 ³ where Cn−1 = Λ(n − 1) + log
σ0,k σ1,k
´ . The above expression can be re-written as:
P (Λ(n) > b/H1 ) = 1 +
1 1 · erfc(α20 ) − · erfc(α10 ), 2 2
and 1 P (Λ(n) > b/H1 ) = erfc 2
Ã
C − µ1,k −B √ 2σ1,k
for σ0,k 6= σ1,k
(6.11)
! ,
for σ0,k = σ1,k .
(6.12)
Similarly, we can write: ! (ynk − µ0,k )2 (ynk − µ1,k )2 + − > a/H0 P (Λ(n) < a/H0 ) = P Λ(n − 1) + log 2 2 2σ0,k 2σ1,k à ! (ynk − µ0,k )2 (ynk − µ1,k )2 =P − < a − Cn−1 /H0 (6.13) 2 2 2σ0,k 2σ1,k Ã
µ
σ0,k σ1,k
¶
Thus: P (Λ(n) < a/H0 ) =
1 1 erfc(β10 ) − erfc(β20 ), 2 2
and 1 P (Λ(n) < a/H0 ) = 1 − erfc 2
Ã
0
− CB − µ0,k √ 2σ0,k
for
σ0,k 6= σ1,k
(6.14)
! ,
for
σ0,k = σ1,k
(6.15)
The details are given in Appendix C. We now consider two scenarios under the Gaussian assumption.
6.5.1
Homogeneous Model: Each sensor has the same variance across hypotheses
In the homogeneous model, we assume that a sensor has the same variance across hypotheses, i.e. σ0,k = σ1,k = σk or A = 0. Under this assumption we can express PC (k, n) as: à ! " à !# 0 C − µ1,k −B − CB − µ0,k 1 1 p √ √ · P (H1 ) + 1 − erfc · P p (H0 ) PC (k, n) = erfc 2 2 2σk 2σk à ! " à ! à !# 0 C C −B − CB − µ0,k −B − µ1,k − µ1,k 1 1 1 √ √ √ = erfc + 1 − erfc − erfc · P p (H0 ) 2 2 2 2σk 2σk 2σk Thus the sensor selection rule is: kn = argmax
PC (k, n) ! " ! !# ) ( Ã Ã Ã 0 C C −B − µ1,k − CB − µ0,k −B − µ1,k 1 1 1 p √ √ √ + + erf · P (H0 ) ⇐⇒ argmax erfc erf 2 2 2 2σk 2σk 2σk k k
(6.16)
86
6.5.2
Heterogeneous Model: Each sensor has different variance across hypotheses
In the heterogeneous model, we assume that a sensor has different variance across hypotheses, i.e. σ0,k 6= σ1,k or A 6= 0. Thus, µ ¶ µ ¶ 1 1 1 1 0 0 p 0 0 PC (k, n) = 1 + erfc(α2 ) − erfc(α1 ) · P (H1 ) + erfc(β1 ) − erfc(β2 ) · P p (H0 ). 2 2 2 2 The sensor selection rule is: ·µ kn = arg max k
¶ 1 1 0 0 1 + erfc(α2 ) − erfc(α1 ) 2 2 ¸ 1 0 0 0 0 p + (erfc(α1 ) − erfc(α2 ) + erfc(β1 ) − erfc(β2 ) − 2) · P (H0 ) 2
(6.17)
It should be noted that the greedy heuristic based selection and sequential detection strategy can be extended to other probabilistic models using the general framework presented in Sections 6.2 and 6.3.
6.6
Sensor Selection based on Distance between Hypotheses: Simplified Heuristic
In this section we attempt to obtain a simplified heuristic under the Gaussian probabilistic model based on the expressions presented in Section 6.5. It will be shown that for the Gaussian case the simplified heuristic provides a measure of the distance between the hypotheses.
6.6.1
Homogeneous Model
The following upper bounds for erfc(x) are well known [78]: 2
erfc(x) < e−x ≤
1 (1 + x2 )
(6.18)
87 Using (6.16), (6.18) and the notation from Appendix C we can approximate the greedy heuristic based sensor selection rule as:
à ! à ! à ! 0 C C −B − µ1,k − CB − µ0,k −B − µ1,k 1 1 1 · P p (H0 ) √ √ √ erfc + 1 − erfc − erfc 2 2 2 2σk 2σk 2σk | {z } | {z }
kn = argmax k
f1k
⇐⇒ argmax k
⇐⇒ argmax k
where f1k =
f2k
µ ¶ · µ ¶ µ ¶¸ 1 1 1 1 1 1 + 1− − · P p (H0 ) 2 2 2 2 1 + f1k 2 1 + f2k 2 1 + f1k µ ¶ µ1,k − µ0,k σk
(b−Cn−1 )σk √ 2(µ1,k −µ0,k )
−
(µ1,k −µ0,k ) √ 2 2σk
and f2k =
(µ1,k −µ0,k ) √ 2 2σk
−
(C −a)σk √ n−1 2(µ1,k −µ0,k )
(6.19) (6.20)
after simple algebraic
manipulations. It can be seen that f1k is monotonically decreasing and f2k monotonically increasing ³ ´ µ1,k −µ0,k with . (6.19) is obtained after using the upper bounds from (6.18). (6.20) follows from σk the monotonicity properties of f1k and f2k . We assume that the second term in (6.19) can be safely left out since f1k and f2k are monotonic in opposite directions with similar rates of change.
6.6.2
Heterogeneous Model
Starting with (6.17) and following an approach similar to that used for the homogeneous model above we obtain: [erfc(α20 ) − erfc(α10 )] · (1 − P p (H0 )) − [erfc(β10 ) − erfc(β20 )] · P p (H0 ) " # " # 1 1 1 1 ⇐⇒ argmax · (1 − P p (H0 )) + · P p (H0 ) (6.21) − − 1 + α20 2 1 + α10 2 1 + β20 2 1 + β10 2 k à ! 2 (µ1,k − µ0,k ) ⇐⇒ argmax (6.22) σ1,k · σ0,k k
kn = argmax k
where α10 = −
σ1,k √ 2
³
µ1,k −µ0,k 2 −σ 2 σ1,k 0,k
r ³
´ − σ0,k
1 2
µ1,k −µ0,k 2 −σ 2 σ1,k 0,k
´2
³ +
b−Cn−1 2 −σ 2 σ1,k 0,k
´
. To better understand the ´ ³ µ −µ0,k monotonic property the following approximation can be used: α10 ≈ − √12 σ1,k . Similar −σ 1,k 0,k expressions can be obtained for α20 , β10 and β20 . Using these approximate expressions in (6.21) followed by algebraic manipulations results in (6.22). It can be seen that the simplified heuristic in (6.22) is a measure of the distance between the two hypotheses. It must be noted that the simplified heuristic in this section are derived for the Gaussian model. For other probabilistic models such simplified expressions may be difficult to obtain in which case the greedy heuristic (6.6) will be used for sensor selection.
88
6.7
Fixed Sample Size Detector
In this section we derive a fixed sample size (FSS) detector. An FSS detector is designed to operate on a block of data. A test statistic is computed based on a fixed number of observations and compared against a threshold [79]. For the binary hypothesis problem with two sources in H1
(6.9), consider an FSS detector with the decision rule Λ(nF SS ) ≷ γ˜ with nF SS being the fixed H0
number of observations. The log-likelihood ratio can be written as: ) (n F SS Y p(yiki /H1 ) Λ(nF SS ) = log p(yiki /H0 ) i=1 ( n ) n2 1 Y p(yi11 /H1 ) Y p(yi22 /H1 ) = log · p(yi11 /H0 ) i =1 p(yi22 /H0 ) i =1 1
2
where the first product term corresponds to observations from sensor source ki = 1 and the second term is due to observations from the source ki = 2. Also, n1 + n2 = nF SS . Assuming Gaussian distributions (6.9): (µ Λ(nF SS ) = log
σ0,1 σ1,1
"¡ ¢2 ¡ 1 ¢2 # ¶2n1 µ ¶2n2 ) X n1 yi11 − µ0,1 yi1 − µ1,1 σ0,2 + − · 2 2 σ1,2 2σ0,1 2σ1,1 i1 =1 " ¡ 2 ¢2 # ¡ 2 ¢2 n2 X yi2 − µ1,2 yi2 − µ0,2 − + 2 2 2σ0,2 2σ1,2 i =1
(6.23)
2
6.7.1
Homogeneous Model
Under the homogeneous model (σ0,k = σ1,k = σk , k = 1, 2), (6.23) reduces to: Λ(nF SS ) =
n1 n2 H1 (µ1,1 − µ0,1 ) X (µ1,2 − µ0,2 ) X 1 y + yi22 + constant terms ≷ γ˜ i1 2 2 σ1 σ2 H0 i =1 i =1 1
= c1
n1 X i1 =1
yi11 + c2
2
n2 X
H1
yi22 + c3 ≷ γ˜ H0
i2 =1
Thus the decision rule for the FSS detector can be written as: L = c1
n1 X i1 =1
yi11 + c2
n2 X
H1
yi22 ≷ γ
i2 =1
H0
The conditional distributions of L under the two hypotheses are: p(L/H0 ) = N (M0 , S) p(L/H1 ) = N (M1 , S)
(6.24)
89 where M0 = c1 n1 µ0,1 + c2 n2 µ0,2 , M1 = c1 n1 µ1,1 + c2 n2 µ1,2 and S = c21 n1 σ12 + c22 n2 σ22 . Thus we obtain the following constraints based on the desired PD and PF A : µ ¶ 1 γ − M1 √ erfc ≥ PD 2 2S µ ¶ 1 γ − M0 √ ≤ PF A erfc 2 2S
(6.25)
Using (6.25) we obtain: M1 − M0 √ ≥ erfc−1 (2PF A ) − erfc−1 (2PD ) = κ 2S
(6.26)
We are trying to solve for n1 and n2 , while trying to minimize the total number of samples (nF SS ). This can be formulated as the following optimization problem: min
n1 ,n2
subject to
(µ1,1 −µ0,1 )2 n1 σ12
+
n1 + n2 (µ1,2 −µ0,2 )2 n2 σ22
≥ 2κ2
(6.27)
n1 + n2 ≥ 1 n1 ≥ 0, n2 ≥ 0
6.7.2
Heterogeneous Model
The log-likelihood ratio (6.23) indicates that the FSS detector under the heterogeneous model is somewhat intractable. In addition the FSS detector is unable to adapt to non-stationarity of the measurements such as time-varying means.
6.8
Sensor Selection for M-ary Hypothesis Testing
In this section we present the framework for extending sensor selection and event detection to scenarios involving a decision between M (M > 2) simple hypotheses, H1 , H2 , . . . , HM . Let us define the following pairwise log-likelihood ratio [80]: ( ) p(y1k1 , · · · , ynkn /Hp ) Λp,q (n) = log p(y1k1 , · · · , ynkn /Hq ) for p, q = 1, . . . , M . The binary sequential hypothesis testing procedure, outlined in Section 6.2, can be modified for the M -hypotheses case as follows: 1. Compute Λp,q (n), p, q = 1, . . . , M, p 6= q.
90 2. Decide Hp if Λp,q (n) > Ap,q ∀q = 1, . . . , M, q 6= p, else 3. perform another measurement and repeat the test. The thresholds Ap,q are given as [81]: Ap,q
X 1 = · 1 − Pe (q, p) Pe (p, q)
(6.28)
q6=p
where Pe (p, q) p 6= q is the probability of incorrectly deciding in favor of Hp when Hq is the true hypothesis. Thus, Pe (p, p) is the probability of correctly deciding in favor of Hp . Also, note that ΣM q=1 Pe (p, q) = 1. In addition to meeting the performance constraints imposed by these probabilities, we would like to make a decision as soon as possible. This can be achieved by collecting as few sensor observations as possible in order to make a decision while meeting the detection performance. We consider the following two sensor selection strategies: 1. Select a sensor, for the next observation instant, which maximally separates the most likely hypothesis from all the other hypotheses, i.e., mathematically: M X k kn = argmax dml ,q k q=1
(6.29)
q6=ml
where dkp,q is a measure of the separation between hypotheses Hp and Hq based on the observations from sensor k, and Hml is the most likely hypothesis based on the posteriori probabilities (6.7). 2. Select a sensor, for the next observation instant, which maximally separates the two most likely hypotheses, i.e., mathematically: ª © kn = argmax dkml1 ,ml2
(6.30)
k
where Hml1 and Hml2 are the two most likely hypotheses based on the posteriori probabilities. Assuming Gaussian models for the different hypotheses, we can express the separation between ´ ³ (µp,k −µq,k )2 , based on the simplified heuristic derived in Section 6.6. two hypotheses as dkp,q = σp,k ·σq,k
91
6.9
Sensor Selection and Detection Performance under Gaussian Modeling
For the experiments in this section, we consider the following binary hypothesis testing case with two sensors (i.e., N = 2 for simplicity of illustration): H0 :
H1 :
2 y 1 ∼ N (µ0,1 , σ0,1 ) 2 y 2 ∼ N (µ0,2 , σ0,2 ) 2 y 1 ∼ N (µ1,1 , σ1,1 ) 2 y 2 ∼ N (µ1,2 , σ1,2 )
To investigate the sensor selection performance, we compare the greedy heuristic based sensor selection with the optimal sensor selection strategy. The average sequence length needed for detection using the greedy heuristic and the optimal selection strategies are computed using 1000 runs of the Monte Carlo simulation. Fig. 6.3 shows the results for the Gaussian homogeneous model with time-invariant mean. It can be seen that on average the number of samples needed for the greedy heuristic based sensor selection strategy is within 10% of that needed using the optimal selection strategy. Next, we discuss the performance of the following strategies for the sensor selection and event detection problems: 1. Greedy heuristic based sensor selection and sequential detection. 2. Distance between hypotheses (simplified heuristic) based sensor selection and sequential detection. 3. Fixed sample size detector. We compare the strategies in terms of the average number of samples required for detection. The average number of samples is a measure of the speed of the detector, since smaller this number is, the faster the detection will be. We investigate the performance under both homogeneous and heterogeneous Gaussian models. In addition, for each model we investigate the effect of time varying statistics on the detection performance. Specifically, we consider the effect of time varying means. The results of 5000 runs of Monte Carlo simulations are averaged to obtain the performance curves. The performance criterion for detection are: PF A = 1 × 10⁻⁵ and PD is varied from 0.85 to 0.99.
92
µ0,1=0.00, µ0,2=0.40, µ1,1=0.25, µ1,2=0.00, σ1=0.354, σ2=0.247 8 Greedy Heuristic based Sensor Selection Optimal Sensor Selection
Average number of measurements needed
7
6
5
4
3
2 0.86
0.88
0.9
0.92 0.94 Probability of detection (PD)
0.96
0.98
Figure 6.3: Comparison of the greedy heuristic based sensor selection with the optimal sensor selection.
6.9.1
Performance under Homogeneous Model
Distributions with Time Invariant Mean We assume that the means of the Gaussian distributions are time-invariant. Fig. 6.4 shows that the strategies based on greedy heuristic and the simplified heuristic have very similar performance. In addition these methods need on average less than half the number of samples for detection as the FSS detector (i.e., the FSS detector needs at least twice the amount of time for detection). Distributions with Time Varying Mean Next we assume that the means of the Gaussian distributions are time varying. Specifically, µm,k := µm,k (t) ∼ N (µm,k , σµ2 ) for
m = 0, 1 and
k = 1, 2.
Fig. 6.5 shows that the greedy heuristic based method takes on average about 20% more samples than the method based on the simplified heuristic. However, both these methods significantly outperform an FSS detector. This indicates that under the homogeneous model the sensor selection
93
µ0,1=0.00, µ0,2=0.40, µ1,1=0.25, µ1,2=0.00, σ1=0.354, σ2=0.265 22 Sensor Selection based on the Simplified Heuristic Greedy Heuristic based Sensor Selection Fixed Sample Size Detector
Average number of measurements needed
20
18
16
14
12
10
8
6
4 0.84
0.86
0.88
0.9 0.92 0.94 Probability of detection (PD)
0.96
0.98
1
Figure 6.4: Gaussian Homogeneous Model with time invariant mean. based on the simplified heuristic which is analogous to maximizing the distance between hypotheses takes better advantage of the time varying statistics. The proposed strategies extend in a straightforward way for a large number of sensors (N > 2). Fig. 6.6 illustrates the detection performance when four sensors are available for measurement under the Gaussian homogeneous model with time varying means.
6.9.2
Performance under Heterogeneous Model
Distributions with Time Invariant Mean For the Gaussian heterogeneous model with time-invariant means, the sensor selection based on simplified heuristic performs slightly better than the greedy heuristic, taking on average 15% less samples for detection (refer Fig. 6.7). Distributions with Time Varying Mean With time varying means, the greedy heuristic and the simplified heuristic based sensor selection methods result in very similar performance. Fig. 6.8 shows that the greedy and the simplified
94
µ
=0.00, µ
0,1
=0.40, µ
0,2
=0.25, µ
1,1
=0.00, σ =0.707, σ =0.530, σ =0.250
1,2
1
µ
2
90 Sensor Selection based on the Simplified Heuristic Greedy Heuristic based Sensor Selection Fixed Sample Size Detector
Average number of measurements needed
80
70
60
50
40
30
20
10
0 0.84
0.86
0.88
0.9 0.92 0.94 Probability of detection (PD)
0.96
0.98
1
Figure 6.5: Gaussian Homogeneous Model with time varying mean. µ0,1=0.13, µ0,2=0.57, µ0,3=0.97, µ0,4=0.73, µ1,1=0.94, µ1,2=0.20, µ1,3=0.55, µ1,4=0.64 σ1=0.194, σ2=0.338, σ3=0.696, σ4=0.631, σµ=0.250 16 Sensor Selection based on the Simplified Heuristic Greedy Heuristic based Sensor Selection
Average number of measurements needed
15.5
15
14.5
14
13.5
13
12.5
12 0.84
0.86
0.88
0.9 0.92 0.94 Probability of detection (PD)
0.96
0.98
1
Figure 6.6: Gaussian Homogeneous Model with time varying mean for the case with four sensors (N = 4).
95
µ0,1=0.00, µ0,2=0.40, µ1,1=0.25, µ1,2=0.00, σ0,1=0.318, σ0,2=0.354, σ1,2=0.177, σ1,2=0.265 18 Sensor Selection based on the Simplified Heuristic Greedy Heuristic based Sensor Selection
Average number of measurements needed
16
14
12
10
8
6
4 0.84
0.86
0.88
0.9 0.92 0.94 Probability of detection (PD)
0.96
0.98
1
Figure 6.7: Gaussian Heterogenous Model with time invariant mean. heuristic need about the same number of samples on average for detection.
6.9.3
M-ary Hypothesis Testing
Next we consider the M-ary hypothesis testing scenario with M > 2. Assume that we have two sensors or sources for the observations (i.e., N = 2) and there exist three mutually exclusive and exhaustive hypotheses (i.e., M = 3). The desired probability of making a correct decision is the same for all hypotheses i.e., Pe (p, p) ∀p = 1, . . . , M . We also assume that the probability of making an incorrect decision is same for all incorrect decisions i.e., Pe (p, q) p 6= q. The thresholds Ap,q are determined based on these probabilities. Fig. 6.9 shows that the average number of measurements needed for detection steadily increases with the desired probability of correct decision. It is also seen that the sensor selection strategy of maximally separating the most likely hypothesis from all other hypotheses performs slightly better than the strategy of maximally separating only the two most likely hypotheses, at the cost of some additional computations. Thus overall we observe that the sensor selection based on the greedy heuristic and the simplified heuristic provide comparable performance. However, the greedy heuristic proves valuable
96
µ
=0.00, µ
0,1
=0.40, µ
0,2
=0.25, µ
1,1
=0.00, σ
1,2
=0.318, σ
0,1
=0.354, σ
0,2
=0.177, σ
1,2
=0.265, σ =0.250 µ
1,2
20 Sensor Selection based on the Simplified Heuristic Greedy Heuristic based Sensor Selection
Average number of measurements needed
19
18
17
16
15
14 0.84
0.86
0.88
0.9 0.92 0.94 Probability of detection (PD)
0.96
0.98
1
Figure 6.8: Gaussian Heterogenous Model with time varying mean.
50
Number of measurements needed for detection
Sensor selection strategy 1 Sensor selection strategy 2 45
40
35
30
25
20
15 0.84
0.86
0.88
0.9
0.92
0.94
0.96
0.98
1
Probability of correct decision, Pe(p,p)
Figure 6.9: M-ary sequential hypothesis testing. Three hypotheses and two sensors (M = 3, N = 2). Sensor-selection strategy 1: maximally separate most likely hypothesis from all other hypotheses. Sensor-selection strategy 2: maximally separate the two most likely hypotheses.
97 for probabilistic models where a simplified heuristic is difficult to derive. In addition, these sensor selection methods combined with sequential detection perform significantly better than the FSS detector.
6.10
Conclusion
A greedy heuristic based sensor selection and a sequential detection procedure has been presented that significantly improves the detection speed. The greedy heuristic was expressed in closed form for the Gaussian model and can be extended for most probabilistic models. The numerical experiments have shown that the sequential procedure significantly outperforms the FSS detector in that it always needs fewer measurements on average to achieve the same detection performance. A simplified heuristic, which provided a measure of the distance between the hypotheses, was derived for the Gaussian probabilistic model. The simplified heuristic was seen to perform as good as or slightly better than the greedy heuristic. The greedy heuristic provides a general framework applicable to any probabilistic model and for models which do not yield a simplified heuristic. Extension of the sensor selection and sequential hypothesis testing procedure for M-ary hypotheses (M > 2) was also presented.
98
Chapter 7
Conclusions and Future Directions 7.1
Conclusions
The research presented in this thesis addresses the localization problem in wireless sensor networks. We presented two localization algorithms, based on the ultra-wideband channel model, suitable for multipath propagation environments. Simulation results using these algorithms have shown the ability to achieve close to sub-meter ranging accuracy. In addition, it was observed that the positioning accuracy is limited only by the bandwidth of the transmit (or ranging) signal and the signal-to-noise ratio. Next we presented a distributed algorithm based on the second-order cone programming relaxation which solves the localization problem in the presence of inaccuracies in the reference node positions and distance measurements, with significant computational savings and without sacrificing positioning accuracy. This algorithm is well-suited for large networks with thousands of nodes. An extensive numerical study of the algorithm under different scenarios was presented. This method is also able to improve positioning of the reference nodes which are in the convex hull of their neighbors. We also presented the prototype implementation for a directional beacon based positioning algorithm using radio frequency signals. Novel techniques for improving the position estimation accuracy using maximum likelihood amplitude estimation, least squares based time-delay estimation and combining data from multiple antenna rotations, were presented. The positioning accuracy of the directional beacon based algorithm depends on the width of the antenna beampat-
99 tern and the rotational speed of the directional antenna. The experiments demonstrated the ability to obtain position estimation results with sub-meter accuracy. The robustness of the algorithm (and the implementation) to timing and synchronization errors was also demonstrated. Finally, a heuristic based sensor selection and sequential detection procedure was presented that significantly improves the detection speed. The sequential procedure significantly outperforms the fixed sample size detector in that it always needs fewer measurements on average to achieve the same detection performance. A greedy heuristic was presented as a general framework applicable to any probabilistic model. A simplified heuristic, which provided a measure of the distance between the hypotheses, was derived for the Gaussian probabilistic model.
7.2
Future Directions
Below we describe some promising areas and/or problems for future investigation.
7.2.1
Implementation of Localization Algorithms for UWB Multipath Environments
It will be interesting to implement the localization algorithms presented in Chapter 3 on hardware testbeds. The availability of UWB radio modules which offer enough flexibility to implement userdefined algorithms is crucial in this regard. The currently available commercial modules do not seem to offer such flexibility.
7.2.2
Distributed SOCP Algorithm for RSSI based Localization
One of the advantages of the proposed distributed SOCP algorithm is the ability to handle large distance estimation errors which are common in RSSI based schemes. The effectiveness of this algorithm with experimental RSSI data is something that needs to be explored. We have shown the convergence of the distributed SOCP algorithm numerically. It is desirable to demonstrate the convergence theoretically.
100
7.2.3
Sensor Selection with Unknown Parameters and other Probabilistic Models
It was seen that the greedy heuristic for sensor selection, under the Gaussian model, reduces to a simplified heuristic that maximizes the distance between the two hypotheses. It is desirable to understand if this is true for any generic probabilistic model. It is also not clear at this point how unknown parameters in the probability distributions would be handled for the sensor selection problem.
101
Appendix A
SOCP Problem Formulation in SeDuMi form SeDuMi solves problems of the form: max bT y
s.t. c − AT y ∈ K ∗
(A.1)
where K ∗ is the dual cone. We now express (4.5) in this form. Assuming 2-D (d = 2), we define: h Li :=
i 1
01×(4ni +2)
h iT iT , tj := 0 0 xj1 xj2 d2ij 01×(2ni +3) 1ij 01×ni Sj := 1×(2ni +3) 1×ni 0 0 1ij h
rj :=
0
0.5
−0.5 Uj := 0 0
01×(2ni +2)
01×ni
01×(2ni +2)
01×ni
1i1
01×ni
1i2
01×ni
0.5(1ij )
0.5(1ij ) 1×ni 0 01×ni
where j ∈ NA (i), 1ij is a row vector of length ni and has a 1 corresponding to the variable tij and zero elsewhere. Similarly, 1i1 , 1i2 are row vectors each of length (2ni + 2) with a 1 corresponding to the coordinates of xi = (xi1 , xi2 ) and zero elsewhere.
102 Define:
S1 . . S := . Sni
where x =
£
xi1
xi2
r1 , r := ... rni
¤T (2ni +2)×1
U1 , U := ... Uni
, tij =
£
tij
¤ ni ×1 2
, t :=
and yij =
t1 .. . tni
£
yij
0
ti
x , y := tij yij ¤ ni ×1
. Then the conic con-
straints can be expressed as r − S T y ∈ Qcone × . . . × Qcone2 , and t − U T y ∈ Qcone4 × . . . × Qcone4 , where the Cartesian product is taken over ni cones. (Qconek = {(x, y) ∈ R × Rk−1 : x ≥ kyk}). Defining:
0
2(ni +1)×1 0 ˜b := − 1ni ×1 0ni ×1
T L 1 i , A˜ := S , c˜ := − r U t
˜ c = c˜ and K being the the problem (4.5) can be written in the form (A.1) with b = ˜b, A = A, Cartesian product of all the cones.
103
Appendix B
Lower Bound on Position Estimation Error Variance Consider the signal model described by (5.25). For our experimental setup, it is sufficient to consider M = 2. Then the vector of parameters to be estimated is λ := [τ1
τ2
a2 ]. We ignore
a1 as it can always be normalized to unity. Using the Cramer-Rao lower bound (CRLB) we can bound the variance as var(λi ) ≥ [I−1 (λ)]ii
for i = 1, 2, 3
(B.1) h
where I(λ) is a 3 × 3 Fisher Information matrix (FIM) with [I(λ)]ij = −E
∂ 2 p(˜ y(L) ,λ) ∂λi ∂λj
i . To avoid
the matrix inversion in (B.1), we invoke the property that a FIM satisfies [72, p. 65]: [I−1 (λ)]ii ≥ This leads to a loose bound: var(λi ) ≥
1 , [I(λ)]ii
1 . [I(λ)]ii
(B.2)
that is easier to compute though difficult to attain,
in general. It can be shown that for time-delay estimation, the diagonal elements of the FIM are given by [72]: [I(λ)]ii =
ξ ¯2 F No /2
for i = 1, 2
(B.3)
where ξ is the signal energy, F¯2 is the mean square bandwidth of the signal and No /2 is the noise variance. Thus, var(τi ) ≥
1 ξ ¯2 No /2 F
for
i = 1, 2.
(B.4)
104 Without loss of generality, we can assume that τˆ1 < τˆ2 . Thus, for the signal received from RN-1 we have t1 = τˆ1 and the same principle applies to the estimation of t2 and t3 . For the sake of clarity, we assume that the error associated with the estimated coordinates (ˆ x, yˆ) of node Q is due to the error in the estimation of t1 or τˆ1 . In order to obtain a bound on the variance of position estimation error (E) we proceed as follows. The position estimation error E is defined as E 2 := (ˆ x − x)2 + (ˆ y − y)2
(B.5)
where x ˆ and yˆ are the estimated values of x and y co-ordinates, respectively. Taking expectation of (B.5) we can write E(E 2 ) = var(ˆ x) + var(ˆ y)
(B.6)
To compute var(ˆ x), we assume that the error in x ˆ is due to the error in the estimation of t1 . Using (5.1) and (5.2) we can write x ˆ = L2 cos γ sin γ + L2 cot β cos2 γ := g(t1 ) where the dependence on t1 stems from the fact that γ depends on t1 . Now, the CRLB for x ˆ can be expressed as var(ˆ x) ≥ Kx2 · var(τ1 ).
(B.7)
where Kx := ∂g(t1 )/∂t1 . Similarly, if we define yˆ := h(t1 ) and Ky := ∂h(t1 )/∂t1 then using (B.4) we can bound the mean square value of the estimation error as ¡ ¢ E(E 2 ) ≥ Kx2 + Ky2 · where
ξ No /2
1 ξ ¯2 No /2 F
is the signal to noise ratio. For the computation of Kx and Ky , we can use chain rule
so that Kx =
∂g(t1 ) ∂γ ∂α · · ∂γ ∂α ∂t1
and Ky =
∂g(t1 ) ∂γ ∂α · · . ∂γ ∂α ∂t1
(B.8)
105 The partial derivatives in (B.8) can be evaluated as ∂α = ω, ∂t1 ∂γ L1 sin 2γ = , ∂α L1 sin 2α − 2L2 sin2 α ∂g(t1 ) = L2 cos 2γ − L2 cot β sin 2γ and ∂γ ∂h(t1 ) = −L2 sin 2γ − L2 cot β cos 2γ. ∂γ
106
Appendix C
Gaussian Modeling for Binary Hypothesis Testing Using (6.10) we can write: Ã
(ynk − µ0,k )2 (ynk − µ1,k )2 P (Λ(n) > b/H1 ) = P − > b − Cn−1 /H1 2 2 2σ0,k 2σ1,k ¡ ¢ = P A(ynk )2 + Bynk + C > 0/H1
!
where 1 A= · 2
Ã
1 2 σ0,k
−
1
!
2 σ1,k
B=
µ1,k µ0,k − 2 2 σ1,k σ0,k
C=
µ20,k µ21,k − 2 2 − b + Cn−1 . 2σ0,k 2σ1,k
(C.1)
Thus, if A 6= 0 (i.e., σ0,k = 6 σ1,k ): Ã ! Ã ! √ √ −B + B 2 − 4AC −B − B 2 − 4AC k k P (Λ(n) > b/H1 ) = P yn > /H1 + P yn < /H1 2A 2A =
1 1 erfc(α20 ) + 1 − erfc(α10 ) 2 2
(C.2)
107 where α1 − µ1,k α10 = √ and 2σ1,k √ −B − B 2 − 4AC α1 = , 2A α2 − µ1,k α20 = √ and 2σ1,k √ −B + B 2 − 4AC . α2 = 2A However, if A = 0 (i.e., σ0,k = σ1,k ) then: 1 P (Λ(n) > b/H1 ) = erfc 2
Ã
C −B − µ1,k √ 2σ1,k
! (C.3)
Starting with (6.13) and following the steps outlined above we can write: Ã ! √ √ −B + B 2 − 4AC 0 −B − B 2 − 4AC 0 k P (Λ(n) < a/H0 ) = P < yn < /H0 2A 2A where A and B are as defined in (C.1) and C0 =
µ20,k µ21,k − 2 2 − a + Cn−1 . 2σ0,k 2σ1,k
If A 6= 0 then: P (Λ(n) < a/H0 ) =
1 1 erfc(β10 ) − erfc(β20 ) 2 2
and if A = 0: 1 P (Λ(n) < a/H0 ) = 1 − erfc 2
Ã
0
− CB − µ0,k √ 2σ0,k
where β1 − µ0,k β10 = √ and 2σ0,k √ −B − B 2 − 4AC 0 β1 = , 2A β2 − µ0,k β20 = √ and 2σ0,k √ −B + B 2 − 4AC 0 β2 = . 2A
(C.4)
! (C.5)
108
Bibliography [1] J. A. Costa, N. Patwari, and A. O. Hero, “Distributed Weighted-Multidimensional Scaling for Node Localization in Sensor Networks,” ACM Trans. Sensor Networks, vol. 2, p. 3964, Feb. 2006. [2] Y. Shang, W. Ruml, Y. Zhang, and M. Fromherz, “Localization from Connectivity in Sensor Networks,” IEEE Trans. Parallel Distrib. Syst., vol. 15, pp. 961–974, Nov. 2004. [3] K. Holger and A. Willig, “A Short Survey of Wireless Sensor Networks.” TKN Technical Reports Series, Technical University Berlin, Oct. 2003. [4] R. Szewczyk, E. Osterweil, J. Polastre, M. Hamilton, A. Mainwaring, and D. Estrin, “Habitat Monitoring with Sensor Networks,” Commun. ACM, vol. 47, pp. 34–40, Jun. 2004. [5] “IEEE Standard for Information Technology - Telecommunications and information exchange between systems - Local and metropolitan area networks - specific requirement Part 15.4: Wireless Medium Access Control (MAC) and Physical Layer (PHY) Specifications for LowRate Wireless Personal Area Networks (WPANs),” IEEE Std 802.15.4a-2007 (Amendment to IEEE Std 802.15.4-2006), pp. 1–203, 2007. [6] K. Pahlavan, Xinrong Li, and J. P. Makela, “Indoor Geolocation Science and Technology,” IEEE Commun. Mag., vol. 4, pp. 112–118, Feb. 2002. [7] A. H. Tewfik and S. Srirangarajan, “Localization in Non Line-of-sight Environments for Wireless Sensor Networks,” in Proc. 2nd European Workshop Wireless Sensor Networks (EWSN), pp. 410–414, Jan.-Feb. 2005. [8] S. Srirangarajan and A. H. Tewfik, “Localization in Wireless Sensor Networks under Non Line-of-Sight Propagation,” in Proc. IEEE GLOBECOM, vol. 6, pp. 3477–3481, Nov. 2005.
109 [9] S. Srirangarajan and A. H. Tewfik, “Sensor Node Localization via Spatial Domain QuasiMaximum Likelihood Estimation,” in Proc. 14th EUSIPCO, Sep. 2006. [10] J.-Y. Lee and R. A. Scholtz, “Ranging in a Dense Multipath Environment using an UWB Radio Link,” IEEE J. Select. Areas Commun., vol. 20, pp. 1677–1683, Dec. 2002. [11] W. C. Chung and D. S. Ha, “An Accurate Ultra Wideband Ranging for Precision Asset Location,” in Proc. IEEE Conf. Ultra Wideband Syst. and Technologies, pp. 389–393, Nov. 2003. [12] K. C. Ho and W. Xu, “An Accurate Algebraic Solution for Moving Source Location using TDOA and FDOA measurements,” IEEE Trans. Signal Process., vol. 52, pp. 2453–2463, Sep. 2004. [13] A. Pages-Zamora and J. Vidal, “Closed-form Solution for Positioning based on Angle of Arrival Measurements,” in Proc. IEEE Int. Symp. Pers., Indoor and Mobile Radio Commun., vol. 4, pp. 1522–1526, Sep. 2002. [14] J. G. Castano, M. Svensson, and M. Ekstrom, “Local Positioning for Wireless Sensor Networks based on Bluetooth,” in IEEE Radio and Wireless Conf., pp. 195–198, Sep. 2004. [15] J. Hightower and G. Borriello, “Location Systems for Ubiquitous Computing,” in Computer, vol. 34, pp. 57–66, IEEE Computer Society Press, Aug. 2001. [16] J. Caffery and G. L. Stuber, “Overview of Radiolocation in CDMA Cellular Systems,” IEEE Commun. Mag., vol. 36, pp. 38–45, Apr. 1998. [17] S. Srirangarajan, A. H. Tewfik, and Z.-Q. Luo, “Distributed Sensor Network Localization with Inaccurate Anchor Positions and Noisy Distance Information,” in Proc. ICASSP 2007, pp. III521–III524, Apr. 2007. [18] S. Srirangarajan, A. H. Tewfik, and Z.-Q. Luo, “Distributed Sensor Network Localization using SOCP Relaxation,” to appear IEEE Trans. on Wireless Commun., 2008. [19] S. F. A. Shah, “Design of Low Complexity OFDM Schemes and Position Location Algorithm for Wireless Systems.” PhD Thesis, University of Minnesota, March 2008.
110 [20] S. Srirangarajan, S. F. A. Shah, and A. H. Tewfik, “Directional Beacon based Positioning System using RF Signals,” to appear in Proc. 16th EUSIPCO, Aug. 2008. [21] N. Bulusu, J. Heidemann, and D. Estrin, “GPS-less Low-Cost Outdoor Localization for Very Small Devices,” IEEE Pers. Commun., vol. 7, pp. 28–34, Oct. 2000. [22] P. Bahl and V. N. Padmanabhan, “RADAR: An In-building RF-based User Location and Tracking System,” in IEEE Infocom, vol. 2, pp. 775–784, Mar. 2000. [23] K. Yu and I. Oppermann, “UWB Positioning for Wireless Embedded Networks,” in Proc. of Radio and Wireless Conference, pp. 459–462, Sep. 2004. [24] W. C. Chung, D. S. Ha, and D. Ni, “Performance evaluation of an ultra wideband radiolocation system with directional beacon,” in IEEE Radio and Wireless Conference, pp. 59–62, Sep. 2004. [25] A. H. Quazi, “An Overview on the Time Delay Estimate in Active and Passive Systems for Target Localization,” IEEE Trans. Acoust., Speech, Signal Process., vol. ASSP-29, pp. 527– 533, Jun. 1981. [26] M. P. Wylie and J. Holtzman, “The Non-Line of Sight Problem in Mobile Location Estimation,” in Proc. 5th IEEE Int. Conf. Universal Pers. Commun., vol. 2, pp. 827–831, Sep. 1996. [27] J. Borras, P. Hatrack, and N. B. Mandayam, “Decision Theoretic Framework for NLOS Identification,” in Proc. 48th IEEE Veh. Technol. Conf., vol. 2, pp. 1583–1587, May 1998. [28] M. P. Wylie-Green and S. S. Wang, “Robust Range Estimation in the Presence of Non-Lineof-Sight Error,” in Proc. 54th IEEE Veh. Technol. Conf., vol. 1, pp. 101–105, Oct. 2001. [29] X. Wang, Z. Wang, and B. O’Dea, “A TOA-based Location Algorithm Reducing the Errors due to NLOS Propagation,” IEEE Trans. Veh. Technol., vol. 52, pp. 112–116, Jan. 2003. [30] L. Doherty, K. S. J. Pister, and L. E. Ghaoui, “Convex Position Estimation in Wireless Sensor Networks,” in IEEE Infocom, vol. 3, pp. 1655–1663, Apr. 2001. [31] P. Biswas and Y. Ye, “Semidefinite Programming for Ad Hoc Sensor Network Localization,” in Proc. Int. Symp. on Information Processing in Sensor Networks (IPSN), pp. 46–54, Springer Verlag, Apr. 2004.
111 [32] P. Biswas, T.-C. Liang, K.-C. Toh, T.-C. Wang, and Y. Ye, “Semidefinite Programming Approaches for Sensor Network Localization with Noisy Distance Measurements,” IEEE Trans. Autom. Sci. Eng., vol. 3, pp. 360–371, Oct. 2006. [33] P. Biswas and Y. Ye, “A Distributed Method for Solving Semidefinite Programs Arising from Ad Hoc Wireless Sensor Network Localization,” in Multiscale Optimization Methods and Applications, pp. 69–84, Jan. 2006. [34] M. W. Carter, H. H. Jin, M. A. Saunders, and Y. Ye, “SPASELOC: An Adaptive Subproblem Algorithm for Scalable Wireless Sensor Network Localization,” SIAM J. Optimization, vol. 17, pp. 1102–1128, Dec. 2006. [35] P. Biswas, T.-C. Lian, T.-C. Wang, and Y. Ye, “Semidefinite Programming Based Algorithms for Sensor Network Localization,” ACM Trans. Sensor Networks, vol. 2, pp. 188–220, May 2006. [36] P. Tseng, “Second-Order Cone Programming Relaxation of Sensor Network Localization,” SIAM J. on Optimization, vol. 18, pp. 156–185, Feb. 2007. [37] J. Liu, Y. Zhang, and F. Zhao, “Robust Distributed Node Localization with Error Management,” in ACM Int. Symp. Mobile Ad Hoc Networking and Computing (MobiHoc), pp. 250– 261, May 2006. [38] H. Lim and J. C. Hou, “Localization for Anisotropic Sensor Networks,” in IEEE Infocom, vol. 1, pp. 138–149, Mar. 2005. [39] T. He, C. Huang, B. M. Blum, J. A. Stankovic, and T. Abdelzaher, “Range-free Localization Schemes for Large Scale Sensor Networks,” in Proc. 9th Int. Conf. Mobile Computing and Networking (MobiCom), pp. 81–95, 2003. [40] R. Stoleru, T. He, J. A. Stankovic, and D. Luebke, “A High-accuracy, Low-cost Localization System for Wireless Sensor Networks,” in Proc. 3rd Int. Conf. Embedded Networked Sensor Systems (SenSys), pp. 13–26, 2005. [41] R. Stoleru, P. Vicaire, T. He, and J. A. Stankovic, “StarDust: A Flexible Architecture for Passive Localization in Wireless Sensor Networks,” in Proc. 4th Int. Conf. Embedded Networked Sensor Systems (SenSys), pp. 57–70, 2006.
112 [42] K. R¨omer, “The Lighthouse Location System for Smart Dust,” in Proc. 1st Int. Conf. Mobile Systems, Applications and Services (MobiSys), pp. 15–30, 2003. [43] S. F. A. Shah and A. H. Tewfik, “Performance analysis of directional beacon based postion location algorithm for UWB systems,” in Proc. of IEEE GLOBECOM, vol. 4, pp. 2409–2413, Nov. 2005. [44] C. D. McGillem and T. S. Rappaport, “A beacon navigation method for autonomous vehicles,” IEEE Trans. Veh. Technol., pp. 132–139, Aug. 1989. [45] A. Nasipuri and K. Li, “A Directionality based Location Discovery Scheme for Wireless Sensor Networks,” in ACM Symp. Wireless Sensor Network Applications, pp. 105– 111, Sep. 2002. [46] A. Nasipuri and R. el Najjar, “Experimental Evaluation of an Angle Based Indoor Localization System,” in Int. Symp. Modeling and Optimization Mobile, Ad Hoc and Wireless Networks, Apr. 2006. [47] H. Rowaihy, S. Eswaran, P. Johnson, T. Brown, A. Barnoy, D. Verma, and T. L. Porta, “A Survey of Sensor Selection Schemes in Wireless Sensor Networks,” in SPIE Unattended Ground, Sea, and Air Sensor Technologies and Applications IX, May 2007. [48] A. O. Hero, C. M. Kreucher, and D. Blatt, “Information Theoretic Approaches to Sensor Management,” in Foundations and Applications of Sensor Management, pp. 33–57, Oct. 2007. [49] J. Liu, J. Reich, and F. Zhao, “Collaborative In-network Processing for Target Tracking,” EURASIP J. Appl. Signal Process., no. 1, pp. 378–391, 2003. [50] E. Ertin, J. W. Fisher, and L. C. Potter, “Maximum Mutual Information Principle for Dynamic Sensor Query Problems,” in Proc. IPSN 03, pp. 405–416, 2003. [51] H. Wang, K. Yao, G. Pottie, and D. Estrin, “Entropy-based sensor selection heuristic for target localization,” in Proc. IPSN 04, pp. 36–45, 2004. [52] J. L. Williams, “Information Theoretic Sensor Management.” PhD Thesis, Massachusetts Institute of Technology, Feb. 2007. [53] J. L. Williams, J. W. Fisher, and A. S. Willsky, “Performance Guarantees for Information Theoretic Sensor Resource Management,” in Proc. ICASSP 07, pp. III933–III936, Apr. 2007.
113 [54] S. Han, E. Chan, R. Cheng, and K.-Y. Lam, “A statistics-based sensor selection scheme for continuous probabilistic queries in sensor networks,” in Proc. IEEE RTCSA, pp. 331–336, Aug. 2005. [55] A. Urrela, E. Str¨om, and M. Pydstr¨om, “Novel Wireless Location Approach for W-CDMA Systems based on Multiple Sliding Correlators,” in Proc. ICASSP 2005, pp. 945–948, Mar. 2005. [56] K. R¨omer, “Time synchronization in Ad-hoc Networks,” in Proc. 2nd ACM Int. Symp. Mobile Ad Hoc Networking & Computing, pp. 173–182, 2001. [57] E. Saberinia and A. H. Tewfik, “Enhanced Localization in Wireless Personal Area Networks,” in Proc. IEEE GLOBECOM, vol. 4, pp. 2429–2434, Nov. 2004. [58] M. Pendergrass, “Empirically based Statistical Ultra Wideband Channel Model.” IEEE P802.15-02/240-SG3a, 2002. [59] IEEE 802.15 WG, “Channel modeling sub-committee final report.” IEEE P802.15 Working Group for Wireless Personal Area Networks (WPANs), Feb. 2003. [60] A. M. Saleh and R. A. Valenzuela, “A Statistical Model for Indoor Multipath Propagation,” IEEE J. Select. Areas Commun., vol. 5, pp. 128–137, Feb. 1987. [61] M. Z. Win and R. A. Scholtz, “Characterization of Ultra-Wide Bandwidth Wireless Indoor Channels: A Communication-Theoretic View,” IEEE J. Select. Areas Commun., vol. 20, pp. 1613–1627, Dec. 2002. [62] S. S. Ghassemzadeh, L. J. Greenstein, T. Sveinsson, A. Kavcic, and V. Tarokh, “UWB Delay Profile Models for Residential and Commercial Indoor Environments,” IEEE Trans. Veh. Technol., vol. 54, pp. 1235–1244, Jul. 2005. [63] P. C. Chen, “A Non-Line-of-Sight Error Mitigation Algorithm in Location Estimation,” in IEEE Wireless Commun. and Netw. Conf., vol. 1, pp. 316–320, Sep. 1999. [64] S. Boyd and L. Vandenberghe, Convex Optimization. Cambridge University Press, 2004. [65] Y. Ye, “Semidefinite Programming for Sensor Network and Graph Localization,” in Nonconvex Optimization and Its Applications: Robust Optimization-Directed Design, pp. 247–275, Jun. 2006.
114 [66] D. Bertsekas and J. Tsitsiklis, Parallel and Distributed Computation: Numerical Methods. Englewood Cliffs, NJ: Prentice-Hall, 1989. [67] J. Strum, “Using SeDuMi 1.02, A Matlab Toolbox for Optimization Over Symmetric Cones (Updated for Version 1.05),” Oct. 2001. [68] Ettus Research LLC, “http://www.ettus.com.” [69] Telex Inc., “http://www.telex.com.” [70] Lin Engineering, “http://www.linengineering.com/.” [71] GNU Radio - The GNU Software Radio, “http://www.gnu.org/software/gnuradio/.” [72] S. Kay, Fundamentals of Statistical Signal Processing: Estimation Theory. Englewood Cliffs, NJ: Prentice Hall, 1993. [73] D. W. Tufts and R. L. Field, “Least-squares Time-delay Estimation for Transient Signals in a Multipath Environment,” J. Acoust. Soc. Amer, vol. 92, pp. 210–218, Jul. 1992. [74] T. G. Manickam, R. J. Vaccaro, and D. W. Tufts, “A Least-squares Algorithm for Multipath Time-delay Estimation,” IEEE Trans. Signal Process., vol. 42, pp. 3229–3233, Nov. 1994. [75] L. Yu and A. Ephremides, “Detection Performance and Energy Efficiency of Sequential Detection in a Sensor Network,” in Proc. HICSS 06, p. 236a, 2006. [76] A. Wald, Sequential Analysis. New York: Wiley, 1947. [77] H. V. Poor, An Introduction to Signal Detection and Estimation. Springer-Verlag, 1988. [78] M. Chiani, D. Dardari, and M. K. Simon, “New Exponential Bounds and Approximations for the Computation of Error Probability in Fading Channels,” IEEE Trans. on Wireless Commun., vol. 2, pp. 840–845, Jul. 2003. [79] R. Chandramouli and N. D. Memon, “On Sequential Watermark Detection,” IEEE Trans. Signal Process., vol. 51, pp. 1034–1044, Apr. 2003. [80] P. Armitage, “Sequential analysis with more than two alternative hypotheses, and its relation to discriminant function analysis,” J. Roy. Stat. Soc., vol. 12, no. Series C, pp. 137–144, 1950.
115 [81] I. Jouny and F. D. Garber, “M-ary sequential hypothesis tests for automatic target recognition,” IEEE Trans. Aerosp. Electron. Syst., vol. 28, pp. 473–483, Apr. 1992.