Imperial College London, UK. Email:{a.manikas, yousif.kamil}@imperial.ac.uk. â Hellenic .... Fc is the propagation (carrier) frequency and ri is a 3 Ã N.
Positioning in Wireless Sensor Networks using Array Processing A. Manikas*, Y. I. Kamil* and P. Karaminas† *Department of Electrical and Electronic Engineering Imperial College London, UK Email:{a.manikas, yousif.kamil}@imperial.ac.uk †Hellenic Telecommunications and Post Commission Athens, Greece
Abstract— In this paper, a novel positioning approach for wireless sensor networks (WSNs) is proposed. The approach locates a given target node by using a number of surrounding anchor nodes as an array of large aperture with known geometry. The approach uses the concept of the array manifold vector based on spherical wave propagation. The position of the target is estimated as the intersection point of three circular loci, the centres and radii of which are calculated from the signal eigenvalues of the covariance matrices corresponding to a number of reference points. A number of simulation results show that the proposed approach can estimate a target location with exceptional accuracy even for low SNRin × (observation-interval). Analytical expressions are also provided for the estimation error due to the finite averaging effects, as a function of the locations of the anchor nodes and the SNRin .
a, A a, A A, A diag(A) diag(A) |A| ||A|| ||A|| b (A) exp(A) � � IN 1N
N OTATION Scalar Column Vector Matrix Column vector with elements the diagonal elements of the matrix A Diagonal matrix with the vector A as the leading diagonal Absolute value Euclidian norm of vector Frobenius norm of matrix Element by element power Element by element exponential of vector A Hadamard product Hadamard division Identity matrix of N × N dimension N × 1 vector of all ones I. I NTRODUCTION
For the last few years, localization in wireless sensor networks (WSNs) has rapidly gained increasing popularity. Accurate localization that exploits the nodes’ capabilities can increase the performance of the network in many aspects. For example, localization is essential for efficient and automated network organization, particularly to dynamically changing networks. Moreover, localization is of great importance when it comes to high quality services, as it affects node cooperation algorithms and sensor management. Also, associating sensor data with context information is essential for the data to have
any physical meaning [1]. If a system is built to respond to changes in sensed data, it has to know the locations of these changes. Finally, in many cases, localization is the ultimate goal of the WSN application, e.g. tracking equipment in warehousing or manufacturing logistics, assisting blind or handicapped passengers in airports, helping police, firefighters and soldiers in rescue missions, .. etc. A number of approaches have been proposed to introduce positioning in WSNs. These approaches can be classified as Direction Finding and Ranging-based. Direction Finding Positioning systems estimate the target position by finding the Direction-of-Arrival (DOA) of the target’s signal received by a number of anchor nodes (with known positions) in its vicinity. Theoretically, such DOA measurements restrict the location of the target node along a line in the estimated direction. The intersection point of two such lines then gives the estimated position of the target node. In practice, however, the performance of the Direction Finding Positioning systems is degraded by the finite observation interval, the multipath effects, the SNRin and the array geometry [2]. This implies that more than two DOA measurements have to be made in order to obtain an unambiguous position estimate. In Ranging-based approaches, the estimated metric is a function of the distance between the target and the anchor nodes. Some Ranging based techniques can be classified as Received Signal Strength (RSS)-based and others as Timebased approaches. In RSS-based approaches, the distance between two nodes is calculated by measuring the voltage of the received signal at one node relying on a path loss model. A single measurement determines a circular locus upon which the target can be located, and at least three measurements are necessary to obtain an unambiguous position estimate [3]. The target coordinates are computed using the wellknown triangulation/triliteration method. The measurement of the RSS is cheap since most of the radio modules provide an RSS estimate. However, RSS-based localization algorithms are very sensitive to the environmental factors such as noise, transmission power and path loss exponent [4]. Time-based approaches depend on measurements of travel times of signals between nodes. The measured Time-of-Arrival (TOA) of the line of sight (LoS) signal is equal to distance between the transmitter and the receiver divided by the prop-
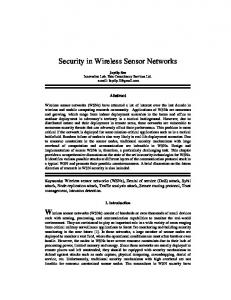
agation velocity of the signal. Again the triangulation method is usually used to compute the location of the target. Time estimation is usually affected by additive noise and multipath effects. Moreover, the performance of Time-based approaches is limited by the effective bandwidth of the signal [5]. The proposed localization method in this paper is an innovative array processing technique that can localize a narrowband source (target node) with a very high accuracy. The location is estimated by using a number of surrounding synchronized anchor nodes as an array of large aperture of known geometry. The signal eigenvalue of the covariance matrix corresponding to a specified reference point is proportional to the distance between the target and that reference point. By repeatedly selecting an alternative reference point for the covariance matrix, a relationship between the ranges and the eigenvalues can be obtained. The position of the target is then estimated as the intersection point of three circular loci, the centres and radii of which are calculated from the signal eigenvalues. Since the signal eigen value is a function of the corresponding range, this novel technique can be classified as a Ranging-based approach. This paper is organised in five sections. Section 2 contains the modelling of the positioning signals and provides the theoretical framework of the array processing type positioning. In Section 3, the effects of the finite observation interval and the anchor node array geometry on the estimation accuracy are discussed, and analytical expressions that interrelate the above parameters are also given. Section 4 provides some computer simulation results which evaluate the performance of the proposed approach. Finally, the paper is concluded in Section 5. II. A RRAY P ROCESSING - TYPE P OSITIONING Consider a large aperture array of single-antenna anchor nodes receiving a signal from a target whose position has to be estimated, (see Fig. 1). With the subscript i representing parameters and measurements associated with array reference point Oi , the N -dimensional baseband received array signalvector xi (t) and can be modelled as: xi (t) = Q · S i · m(t) + ni (t)
(1)
In Equation 1, the vector S i � S(θi , φi , ρi , ri , Fc ) represents the N -dimensional array manifold vector (array response vector), where θi , φi and ρi denote the azimuth, elevation and range parameters of the target with respect to Oi . Furthermore, Fc is the propagation (carrier) frequency and ri is a 3 × N matrix containing the Cartesian coordinates of the anchor nodes (array elements) with respect to Oi , ni (t) is the complex N -dimensional vector of the noise at the array elements and m(t) is the baseband positioning signal which is considered to be a slow varying function with respect to the distance D (directional aperture), see Fig. 1. Equation 1 assumes that the array is fully calibrated1 . The array manifold vector S i can be 1 Any lack of synchronisation can be modelled as a phase shift uncertainty independent of the signal direction of arrival and can, therefore, be removed using array calibration techniques.
y
Antenna�2
D
Antenna k rk,i
Target rT,i
Antenna�1
Antenna�N qi Oi
x
Fig. 1. Spherical wave propagation of narrowband signal to different elements of a large aperture array.
expressed, for spherical wave propagation, as follows: 2 · π · Fc · (ρi ·1N −di )) c (2) a is a constant scalar represents the path loss exponent 1N is a N -dimensional column vector of ones G is the N × N diagonal matrix denoting the complex gain response(i.e. gain and phase) � denotes the Hadamard element by element product operator � denotes the Hadamard element by element division operator 2 ρi < 2D c·Fc
(
(
)
S i = G· (ρi ·1N �di )a �exp −j · ⎧ ⎪ ⎪ ⎪ ⎪ ⎪ ⎪ ⎪ ⎪ ⎪ ⎪ ⎪ ⎪ ⎪ ⎪ ⎨ where ⎪ ⎪ ⎪ ⎪ ⎪ ⎪ ⎪ ⎪ ⎪ ⎪ ⎪ ⎪ ⎪ ⎪ ⎩
Note that, in this study, the use of isotropic antennas has been assumed (i.e. G = IN ). In Equation 2, the vector di is defined as: di = � d(θi , φi , ρi , ri ) = ρ2i · 1N + diag(rTi ri ) −
ρi· c π·Fc
· rTi · k(θi , φi )
(3)
where k(θi , ϕi ) is the wavenumber vector and is defined by the following equation: 2 · π · Fc ·[cos(φi ) cos(θi ), cos(φi ) sin(θi ), sin(φi )]T c k(θi , ϕi ) is colinear to the target location vector rT,i i.e. ρi· c rT,i = · k(θi , φi ) (4) 2 · π · Fc k(θi , ϕi ) =
On the basis of the above modelling, it is clear that the manifold vector S i depends on the array reference point relative to which the bearings and the range of the source as well as the Cartesian coordinates of the array configuration are measured.
Now consider that the reference point has been changed from Oi to O0 . That is all the measurements x0 (t) are now taken with respect to the new reference point Oi . It is straightforward to prove that the array manifold vector S 0 is directly related to S i as follows: ρ0 2 · π · Fc · (ρ0 − ρi )) · S i S 0 = ( )a · exp ( − j · ρi c
C2 F2 y
F1
From Equation 5, it is clear that the array manifold vectors S i , S 0 are collinear vectors of different magnitudes. In other words, the effect of a change in the reference point on the manifold vector is simply a change in the magnitude of the vector, which depends only on the range of the target with respect to the two reference points. This implies that the subspace spanned by the manifold vector remains unchanged. Next, let us form the second order statistics Ri , R0 of the received signal vectors xi (t), x0 (t), respectively (in a centralized or distributed way) and estimate their principal eigenvalues γi , γ0 .That is, R0 = E{x0 (t)xH 0 (t)} =⇒ γ0 = max(eig R0 )
(7a) (7b)
By assuming that the noise is isotropic then, the noise power Pni = Pn0 = σn2 can be obtained from2 : σn2 = min(eig Ri ) = min(eig R0 )
(8)
From Equations (7) and (8), the signal eigenvalues λi and λ0 can be defined as: (9a) λi = γi − σn2 λ0 = γ0 − σn2
(9b)
and it can be proven that the ratio of the signal eigenvalues (i.e. λi and λ0 ) is related to the ratio of the ranges of the target with respect to these reference points. That is, λi ρi = ( )2a λ0 ρ0
(10)
In this paper, Equation 10 is used as an initial point for estimating the position of the target node, and the proposed approach is expressed in the following theorem, (the proof is omitted due to space limitation). Theorem 1: Given an array of N anchor nodes and four measurements with second order statistics R0 , R1 , R2 and R3 , taken with respect to four different array reference points, the target location, rT , is the intersection of the three circular loci with centres and radii given as follows: r cj =
1 1−Kj2
· Rj −
Kj2 1−Kj2
· R0
C3
(6)
Ri = E{xi (t)xH i (t)} =⇒ γi = max(eig Ri )
j = 1, 2, 3
Δ Rworst2
Rc1
(5)
and, in addition, d0 = di
Rj
(11a)
2 Theoretically (i.e. for L → ∞), the minimum eigenvalue of R is used i to specify the power of the noise . For a finite observation interval of L snapshots, however, the power of the noise can be estimated as the average of the N − 1 non-principal eigenvalues of the matrix Ri .
F1 rc1
C1
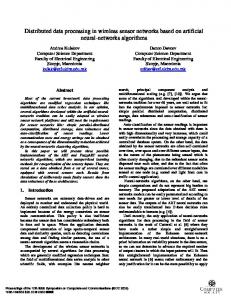
x Fig. 2.
Target node estimation uncertainty on the three positioning circles.
� � � � Kj � � �R0 − Rj � j = 1, 2, 3 Rcj = � 1−K (11b) 2� · j ⎧ • Rj , denotes the Cartesian coordinates vectors ⎪ ⎪ ⎪ ⎪ ⎪ ⎨ of the four array reference points R2 and R3 ) (i.e. R0 , R1 , � where ⎪ ρj 2a λj ⎪ ⎪ • Kj = ρ0 = ⎪ λ0 ⎪ ⎩ • λj given by (9) The overall algorithm for estimating the position of a target node can be presented in a step form as follows. Proposed Algorithm STEP-1: The target node transmits temporarily over a dedicated positioning channel. During this time interval no other target operates on this positioning channel. STEP-2: An array of N anchor nodes in the vicinity of the target measures the signal on the positioning channel with respect to four different array reference points, and reports the second order statistics of the received signal (i.e. R0 , R1 , R2 and R3 ) to a central processor (a powerful node or a node with high residual energy). STEP-3: The central processor performs an eigen decomposition of the matrices R0 , R1 , R2 and R3 to extract the four signal eigenvalues, and then estimates the centres and the radii of the three circular loci according to (11a) and (11b). STEP-4: The position of the target node is determined by calculating the intersection point of the three circular loci, see Fig. 2. III. T HE E FFECTS OF THE F INITE O BSERVATION I NTERVAL AND A RRAY G EOMETRY ON THE E STIMATION ACCURACY In practical cases, the combination of noise effects and the finite observation interval L causes an error in the estimation of the signal eigenvalues λj of the matrices Rj ∀j and this will propagate to the centres and radii of the circles of (11). This error is a function of the product (SNRin × L) and the geometry of the array that is formed from the anchor
nodes that are used for target positioning. In order to find the root-mean square error (RMSE) of the target position
� 2 estimate, i.e. RMSE = E �ˆ rT − rT � , and to use that as a performance measure, the worst case scenario is considered by transferring the errors from the centres of the positioning circles, given by (11a) and (11b), to the radii of these circles. This creates for each circle an uncertainty ring, which can be specified as (rcj ,Rcj ± ΔR) ∀j, where � � � � � � (12) ΔRworstj = �ΔRcj � + �rcj � is the maximum error introduced by both centre and radius uncertainties of the three positioning circles. ΔRworstj ∀j can be expressed as a function of the principle eigenvalues λ0 and their maximum estimation error Δλ for the matrices Rj , by the following expression: ΔRworst where
= [ΔRworst√ , ΔRworst2 , ΔRworst3 ] 1 1 = 2a · diag( ZT Z) · |Δλ| λ0
T
(13)
Z =diag(K) · [R0 − R1 , R0 − R2 , R0 − R3 ] ,and 1−K12a 1−K22a 1−K32a , ]T K = [ (1−K )2 ·K 2a−1 , (1−K )2 ·K2a−1 (1−K )2 ·K2a−1 1
1
2
2
3
3
It is straightforward to prove that the vector ΔRworst is related to the location error ΔrT = rˆT − rT as follows: ΔRworst = FT ΔrT
(14)
where F = [F 1 , F 2 , F 3 ] is referred to as the system’s ”focusing” matrix. The j th column of this matrix r T − r cj � ∀j = 1, 2, 3 (15) Fj = � � � �Rcj � denotes the unity vector from the centre of the j th positioning circle to a single point which is called the ”focusing” point of the system, and represents the position of the target node, see Fig. 2. From the second order statistics of the location error ΔrT and from (13-14), the RMSE can be expressed as follows: √ E{Δλ2 } 1 · RMSE = 2a λ0 � (16) −2 · trace FT (FFT ) F((ZT Z) � I3 )
(
)
it can also be proven that an upper bound for the RMSE is as follows: N 1 √ RMSE ≤ 2a λ0 . SNRin × L �� �
1st term (17) � −2 · trace FT (FFT ) F((ZT Z) � I3 )
�� �
(
)
2nd term
With reference to (17), the RMSE can be written as a product of two terms. The first involves the signal and the noise powers as well as the observation interval. The second involves the geometrical relationship of the focusing vectors which is directly related to the array geometry (i.e. the geometry of the
anchor nodes). This implies that the array geometry plays a very important role and, therefore, different array geometries have to be examined before the localization process can take place. Note that this is not considered to be a major issue in a dense WSN since a suitable array geometry of anchor nodes, that minimizes the RMSE, can always be found. The angle between the three focusing vectors F 1 , F 2 and F 3 is of great importance since it determines the relative locations of the three positioning circles. There are anchor node array geometries which minimize the second factor of (17), and consequently the RMSE, while others degrade dramatically the performance of the proposed approach. The best estimation accuracy is achieved when the angles between the focusing vectors is 120◦ since the intersection area of the three positioning rings is minimized. IV. P ERFORMANCE E VALUATION In this section, the performance of the proposed positioning approach is evaluated. In order to do this, a target node with azimuth and elevation bearings equal to θ = 45◦ and φ = 0◦ , respectively, and range ρ = 10 m (i.e. rT = [ρ cos θ, ρ sin θ, 0]T ). The positioning of this target is based on the data collected by an array of N = 4 nodes over an observation interval of L = 100 snapshots. Initially, the effects of the product SNRin ×L on the estimation accuracy are investigated, and then the effect of the anchor node geometry on the estimation error is examined. The Cartesian coordinates of the four anchor nodes, expressed in metres, are represented by the matrix r: ⎡ ⎤ 50 −40 5.05 9.45 0 30 −20 ⎦ r=⎣ 0 (18) 0 0 0 0 It is assumed that the four reference points which are required for the positioning, according to (11a) and (11b), are the positions of the four anchor nodes. In this example, it is assumed that the power propagation path loss is described by an inverse fourth power law, and the magnitude of the unknown diagonal matrix Q, whose elements represent the fading, is modelled by using a lognormal distribution with mean 0 dB and standard deviation 8 dB. The phase of the elements of Q follows a uniform distribution in the interval [0, 2π). Fig. 3 presents the root mean square error, for a wide range of SNRin × L values (i.e. SNRin ∈ [−20 dB, 40 dB] for L = 100 snapshots) of the proposed algorithm. In this simulation, 200 realizations are used to evaluate the performance of the proposed approach. The average of these realizations is shown in Fig. 3 as a continuous line, as well as the worst case boundry for the specified geometry. Furthermore, the performance of the proposed algorithm is compared with the received signal strength RSS and Time-based approaches (correlation based Time-of-Arrival (TOA) estimation, see for instance [6]) for the same environment. According to the results presented in Fig. 3, there is a constant reduction in the RMSE as the product SNRin × L increases. Moreover, the presented performance results reveal the superiority of the proposed approach over
2
10
Time�Based�(TOA) 4
10
1
10
RMS Error (meters)
RMS Error (meters)
Worst�Case�Boundry 2
10
Received�Signal�Strength
0
10
Bad Geometry 0
10
Good Geometry -1
-2
10
10
Proposed Approach
-4
10
0
10
1
10
2
10
3
10
4
10
5
10
-2
10
6
10
SNRin x L
Fig. 3. The RMS error plotted as a function of the product SNRin × L for different localisation approaches (a data set of length 200 has been used for each point). The RMS error spread for each point is represented by the coloured dots.
the existing techniques. Clearly, the proposed approach is able to estimate very accurately the position of the target node especially for SNRin × L > 102 (i.e. SNRin > 0 dB for 100 snapshots). Throughout this analysis no multipath is taken into account. Considering multipath is going to degrade the performance of the proposed approach indeed. However, the same applies for the other approaches. In order to investigate the effects of the anchor node array geometry on the performance of the proposed positioning approach, the estimation of the target node is investigated for both a ”good” and a ”bad” anchor nodes array geometry. Initially, the estimation accuracy of the ”good” geometry is investigated using the same SNRin values and the previous array geometry is used as a representative example. This geometry in conjunction with the above target location corresponds to three focusing vectors F 1 , F 2 and F 3 that form with each others angles of ∠(F 1 , F 2 ) = 120◦ , ∠(F 1 , F 3 ) = 120◦ and ∠(F 2 , F 3 ) = 120◦ , respectively. Next a ”bad” anchor node array geometry is considered. The array of four anchor nodes is represented by the matrix r = [R0 , R1 , R2 , R3 ]T with R0 = [50, 7.07, 0]T , R1 = [−40, 0, 0]T , R2 = [0, 30, 0]T and R3 = [15, 30.29, 0]T , and the same target location is used. The angles between the focusing vectors are ∠(F 1 , F 2 ) = 120◦ , ∠(F 1 , F 3 ) = 120◦ and ∠(F 2 , F 3 ) = 0◦ . In this case, the RMSE estimated by the same number of data samples increases considerably for the same L and SNRin as depicted in Fig. 4. V. C ONCLUSIONS In this paper, a novel positioning approach for WSNs is proposed. This approach performs positioning by using a number of single-antenna anchor nodes surrounding a target node as a large aperture array of known geometry. The target position, based on the modelling and properties of the array manifold of N nodes, is estimated as the intersection point of
Fig. 4.
0
10
1
10
2
10
SNRin x L
3
10
4
10
5
10
The estimated RMSE using two different array geometries.
three circular loci. A number of simulation studies show that the proposed approach estimates the positions of the targets with exceptional accuracy even for low SNRin ×L. Analytical expressions were also provided to theoretically interrelate the estimation error with the locations of the anchor nodes and the SNR block-length product (SNRin × L). The proposed approach is implemented using a very narrowband positioning signal (simple format). However, it can be extended to a wideband PN-code signal, having the potential of handling not only multipath effects but also multiple access interference by exploiting the properties of the PN-code. Note that, while this localization approach is presented in the context of WSNs, it can also be implemented in many applications including mobile communication networks where synchronizing base stations is a trivial task. These base stations can form the large aperture array and send their measurements to a Location Service Centre (LSC) where the positioning algorithm can take place. R EFERENCES [1] J. M. Rabaey, M. J. Ammer, J. J. L. da Silva, D. Patel, and S. Roundy, “PicoRadio supports ad hoc ultra-low power wireless networking,” Computer, vol. 33, no. 7, pp. 42–48, 2000. [2] N. Patwari, J. N. Ash, S. Kyperountas, I. A. O. Hero, R. L. Moses, and N. S. Correal, “Locating the nodes: cooperative localization in wireless sensor networks,” IEEE Signal Processing Magazine, vol. 22, no. 4, pp. 54–69, 2005. [3] T. S. Rappaport, J. H. Reed, and B. D. Woerner, “Position location using wireless communications on highways of the future,” IEEE Communications Magazine, vol. 34, no. 10, pp. 33–41, 1996. [4] K. Whitehouse, C. Karlof, and D. Culler, “A practical evaluation of radio signal strength for ranging-based localization,” ACM SIGMOBILE Mobile Computing and Communications Review, vol. 11, no. 1559-1662, pp. 41– 52, 2007. [5] S. Gezici, T. Zhi, G. B. Giannakis, H. Kobayashi, A. F. Molisch, H. V. Poor, and Z. Sahinoglu, “Localization via ultra-wideband radios: a look at positioning aspects for future sensor networks,” IEEE Signal Processing Magazine, vol. 22, no. 4, pp. 70–84, 2005. [6] S. Fischer, H. Grubeck, A. Kangas, H. Koorapaty, E. Larsson, and P. Lundqvist, “Time of arrival estimation of narrowband TDMA signals for mobile positioning,” in IEEE International Conference on Personal, Indoor and Mobile Radio Communications., vol. 1, pp. 451–455, 1998.