Trakia Journal of Sciences, Vol. 13, Suppl. 2, pp 309-314, 2015 Copyright © 2015 Trakia University Available online at: http://www.uni-sz.bg ISSN 1313-7050 (print) doi:10.15547/tjs.2015.s.02.066 ISSN 1313-3551 (online)
RAPID RP-HPLC METHOD WITH PDA DETECTION FOR TYLOSIN DETERMINATION IN LIQUID SAMPLES Z. Yaneva1, N. Georgieva1*, V. Koinarski2, D. Petrova3 1
Chemistry Unit, Department of Pharmacology, Animal Physiology and Physiological Chemistry, Faculty of Veterinary Medicine, Trakia University, Stara Zagora, Bulgaria 2 Department of Veterinary Microbiology, Infectious and Parasitic Diseases, Faculty of Veterinary Medicine, Trakia University, Stara Zagora, Bulgaria 3 Central Scientific Laboratory, Trakia University, Stara Zagora, Bulgaria ABSTRACT As one of the widely used veterinary macrolide antibiotics, the environmental risks of tylosin (TYL) received more and more attention. The purpose of the present study was to develop a modified, rapid and precise RP-HPLC method with PDA detection for the determination of the macrolide antibiotic tylosin in liquid samples. The proposed two HPLC methods offered short retention time (< 6.8 min), high precision (RSD ≤ 1.40 %) and linearity (R2 > 0.9993). HPLC chromatograms exhibited well-resolved peaks with no interference peaks. Despite of the higher linearity (R2 0.9998) of the applied HPLC Method I, the lower LOQ and LOD values of HPLC Method II indicated its better suitability for detection and quantification of low tylosin concentrations in aqueous medium (>2.78 µg/mL). Key words: tylosin, RP-HPLC, photodiode array (PDA) detector, liquid samples
INTRODUCTION Antibiotics present in the environment are recently considered as „emerging” contaminants, and have raised increasing concerns about their potential risks to ecosystems and human health. In European Union countries, it was estimated that approximately 4700 t of antibiotics were used in veterinary medicine (1). In Germany, the consumption of veterinary antibiotics was estimated to 1700 t per year from 2011 (2). Tylosin (TYL) belongs to the group of broadspectrum macrolide antibiotics used widely in veterinary medicine as anticoccidial feed additives in poultry and livestock, as growth promoters, for improved feed efficiency in ruminants and due to their antibiotic activities against Gram-positive microorganisms (3, 4). ________________________ *Correspondence to: Prof. Nedyalka V. Georgieva, DSc, Chemistry Unit, Department of Pharmacology, Animal Physiology and Physiological Chemistry, Faculty of Veterinary Medicine, Trakia University, Students Campus, 6000 Stara Zagora, Bulgaria, Tel.: +359699640, E-mail:
[email protected]
However, a portion of the administered dose used for these purposes can be excreted into animal manure, and land application of the animal manure as plant fertilizers enhances the dissemination of antibiotics in the environment following the pathway: accumulation in the top soil layers – leaching to groundwater – subsequent transport to surface waters (5, 6). Thus, quantitative analyses of macrolide antibiotics in water is essential to evaluate their environmental exposure and subsequent risks to environmental quality and public health (1). Sokol et al. (2010) developed a HPLC method combined with solid phase extraction (SPE) for the determination of TYL residues in the food of animal origin (7). Pietron et al., (2011) presented an analytical procedure for the determination of tylosin A in feedingstuff by liquid chromatography-ultraviolet detection (8). Ahmed et al., (2013) determined three macrolide antibiotics: tylosin (TYL), spiramycin (SPIR), anderythromycin (ERY) in buffaloes’ meat using a modified method of thin-layer chromatography–bioautography (TLC–B) (9). Another method successfully applied for tylosin
Trakia Journal of Sciences, Vol. 13, Suppl. 2, 2015
309
tartrate detection in aqueous phase was UV-VIS spectroscopy (10). The study of Hoese et al., (2009) assessed the runoff potential of tylosin and chlortetracycline (CTC) from soils treated with manure from swine fed rations containing the highest labeled rate of each chemical. The concentrations of tylosin were determined by LC/MS analysis (11). However, only a limited number of studies have thus far focused on the detection of TYL in aqueous phase by HPLC, which provoked the current investigations. The aim of the present study was to develop a modified, rapid and precise RP-HPLC-PDA method for TYL determination in aqueous samples. MATERIALS AND METHODS Chemicals Tylosin (C46H77NO17), acetonitrile (ACN, ≥99.8 %), orthophosphoric acid (H3PO4 85%), methanol (≥ 99.9 %), ethanol (p.a. ≥ 99.8 %), and Na2HPO4.2H2O (HPLC, ≥98.5%) HPLC grade, were obtained from Sigma-Aldrich. HPLC system and conditions RP-HPLC system comprising of a Hypersil BDS C18 (5 µM, 4.6 x 150 mm) column, Surveyor LC Pump Plus, PDA detector, and Surveyor Autosampler Plus (Thermo Fisher Scientific) was used. The mobile phase consisted of a mixture of ACN and 0.1M H3PO4 (60:40, v/v). The buffer pH was adjusted to 2.5 with H3PO4.
YANEVA Z., et al. The samples were monitored at 290 nm. All analyses were made in triplicate. Standard stock solutions (100 µg/mL) were prepared by dissolving the appropriate amount of TYL in ethanol. Working standard solutions (5 – 100 µg/mL) were prepared daily by dilution with Milli-Q water. The volume injected into the HPLC column was 20 μL. All HPLC analyses were made in triplicate. The experimental data was analyzed by regression analyses and determination of the corresponding correlation coefficients (R2), standard error of the intercept (SEy), standard error of the slope (SEx) and the relative standard deviation (RSD, %). The efficiency and accuracy of the developed HPLC method was estimated based on the calculated limit of detection (LOD) and limit of quantification (LOQ). Statistical analyses The statistical significance of the experimental results and the values of SEy, SEx, RSD (%), LOD (µg/mL) and LOQ, µg/mL were determined by XLSTAT Statistical Software for Excel. RESULTS AND DISCUSSION Physicochemical characteristics of TYL The software package CS Chem 3D ultra was used to calculate the basic molecular characteristic of TYL. The molecular formula of the compound is presented in Figure 1.
Figure 1. Structural (A) and 3D (B) molecular formula of TYL.
The physicochemical and molecular properties of TYL are displayed in Table 1. The development and optimization of a sensitive and rapid HPLC method for TYL determination 310
in aqueous phase included the performance of several preliminary experiments testing different HPLC conditions: mobile phases, temperatures and wavelengths.
Trakia Journal of Sciences, Vol. 13, Suppl. 2, 2015
YANEVA Z., et al. Table 1. Physicochemical properties and molecular characteristics of TYL. C46H77NO17 Molecular formula 1401-69-0 CAS No. [(2R,3R,4E,6E,9R,11R,12S,13S,14R) -12- {[3,6-dideoxy-4UIPAC name O-(2,6-dideoxy-3-C-methyl-α-L-ribo-hexopyranosyl) -3(dimethylamino)-β-D-glucopyrano-syl]oxy}-2-ethyl-14hydroxy-5,9,13-trimethyl-8, 16-dioxo-11-(2-oxoethyl) oxacyclohexadeca-4,6-dien-3-yl]methyl 6-deoxy-2,3-di-Omethyl-β-D-allopyranoside Tylocine, Tylan Trade names 916.10 g/mol Molecular mass soluble in lower alcohols, esters, ketones, chlorinated Solubility hydrocarbons, benzene, ether 7.73 pKa (12) λ ~ 282 nm UVmax (12) 239 Å2 Topological polar surface area (12) 1078.23 Å2 Connolly Accessible Area 660.07 Å2 Connolly Molecular Area 1.619 Ovality HPLC method I The first experimental series were conducted with eleven TYL standard solutions with concentrations 5, 10, 20, 30, 40, 50, 60, 70, 80, 90 and 100 µg/mL. The used mobile phase consisted of ACN and 0.1M H3PO4 (50:50, v/v). Optimal performance was obtained at a flowrate 0.8 mL/min. The effect of temperature on the separation process was studied in the range 18 –
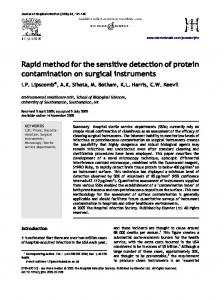
30°C. Satisfactory peak resolution and optimum analyses time were established at 30°C at a wavelength λ 265 nm. TYL was successfully detected within 6.8 min. The obtained HPLC chromatograms did not contain interference peaks, which could influence the quantitative results (Figure 2), although a wide peak with small area was detected around 3.8 min.
Figure 2. HPLC chromatogram of TYL (Co 10 µg/mL) – HPLC Method I.
Trakia Journal of Sciences, Vol. 13, Suppl. 2, 2015
311
YANEVA Z., et al. The standard calibration curve based on the spectral peak areas is presented in Figure 3.
Figure 3. Standard calibration curve of TYL – HPLC Method I.
It characterized with a high correlation coefficient R2 0.9993 and the following linear equation (1): (1) HPLC method II The second experimental series were conducted with eleven TYL standard solutions with concentrations 5, 10, 20, 30, 40, 50, 60, 70, 80, 90 and 100 µg/mL. The used mobile phase consisted of ACN and 0.1M H3PO4 (60:40, v/v).
Optimal performance was obtained at a flowrate 0.8 mL/min. The effect of temperature on the separation process was studied in the range 18 30°C. Satisfactory peak resolution and optimum analyses time were established at 30°C at a wavelength λ 290 nm. TYL was successfully detected within 5.4 min (Figure 4). The obtained HPLC chromatograms did not contain interference peaks, which could influence the quantitative results. Besides, the wide peaks registered on the chromatograms of HPLC Method I (Figure 2) are missing.
Figure 4. HPLC chromatogram of TYL (Co 10 µg/mL) – HPLC Method II.
312
Trakia Journal of Sciences, Vol. 13, Suppl. 2, 2015
YANEVA Z., et al. The standard calibration curve plotted based on the spectral peak areas is presented in Figure 5.
Figure 5. Standard calibration curve of TYL – HPLC Method II.
It characterized with a higher correlation coefficient R2 0.9995, as compared to HPLC Method I, and the following linear equation (2): (2) Accuracy and sensitivity of the applied HPLC methods The sensitivity of both methods was examined through measuring the limit of detection (LOD) and the limit of quantitation (LOQ) for TYL at a
signal-to-noise ratio of 3 and 10, respectively, according to the guidelines of the International Conference on Harmonization of Technical Requirements for Registration of Pharmaceuticals for Human Use (ICH) based on the standard deviation of the intercept (SEy) and of the slope (SEx) of the calibration curve of the analyte (13). The relative standard deviation (RSD, %) values of both HPLC methods were also calculated. The values of these parameters are presented in Table 2.
Table 2. Values of SEy, SEx, RSD, LOD and LOQ for both applied HPLC methods Method SEy SEx RSD, % LOD, µg/mL LOQ, µg/mL HPLC Method I 8823.498 144.55 1.40 1.59 4.83 HPLC Method II 6234.161 102.13 0.89 0.92 2.78
Although, the regression analysis of both methods confirmed that the deviation of the yintercept from zero for both calibration curves (Figures 3, 5) was not significant, the values of SEx and SEy of HPLC Method II were significantly lower (Table 2). The RSD values of both methods are acceptable as they are less than 10 % (14). Regarding the developed HPLC methodologies, and based on the data from Table 2, it could be concluded that undoubtedly Method II displayed the highest accuracy and efficiency as the determined RSD, LOD and LOQ values were the lowest. The comparative
estimation of the HPLC spectral data of TYL obtained by both liquid-chromatographic methods (Figures 2, 4) revealed that the spectral peaks of Method II characterized with 1.2 times greater area. Besides, they were significantly more pronounced in the entire tested concentration range. Another advantage of HPLC Method II is the registered shorter retention time – 5.4 min. The latter conclusions prove the applicability of HPLC Method II for the determination of TYL content in real samples of wastewater effluents from veterinary clinics
Trakia Journal of Sciences, Vol. 13, Suppl. 2, 2015
313
and/or animal farms, which could enhance the control and prevention of water contamination with this veterinary antibiotic. CONCLUSIONS A RP-HPLC-PDA analytical methodology appropriate for the determination of the veterinary antibiotic TYL in aqueous phase was developed in the present study. Desirable chromatographic separation was achieved on a C18 column employing a mixture of ACN and 0.1M H3PO4 (60:40; v/v) as the mobile phase. The obtained HPLC chromatograms were well pronounced and did not contain any interference peaks, which could influence the quantitative results. The applied method offered short analysis time (5.4 min), high precision (RSD 0.89 %) and high linearity (R2 0.9995). It characterized with satisfactory LOD (1.59 μg/mL) and LOQ (2.78 μg/mL) values. The simple and rapid method developed enhances the capabilities for the accurate and selective determination of low TYL concentrations in aqueous phase. ACKNOWLEDGEMENTS: The study was supported financially by Project No. 4 OUP/14, “Determination of the contents of newlysynthesized drug substances and priority contaminants in model aqueous solutions and investigation of the possibilities of their removal by abundant and low-cost natural adsorbents”, Trakia University, Stara Zagora, Bulgaria. REFERENCES 1. Song, W., Huang, M., Rumbeiha, W. and Li, H. Determination of amprolium, carbadox, monensin, and tylosin in surface water by liquid chromatography/tandem mass spectrometry. Rapid Communications in Mass Spectrometry, 21: 1944-1950, 2007. 2. Meyer, E., Gastmeier, P., Deja, M. and Schwab, F., Antibiotic consumption and resistance: Data from Europe and Germany, International Journal of Medical Microbiology, 303(6–7): 388–395, 2013. 3. Watanabe, W., Harter, T. and Bergamaschi, B., Environmental occurrence and shallow ground water detection of the antibiotic monensin from dairy farms, J. Environ. Quality, 37: S-78-S-85, 2008. 4. Sun, P., Barmaz, D., Cabrera, M., Pavlostathis and Huang, Ch., Detection and quantification of ionophore antibiotics in runoff, soil and poultry litter. Journal of Chromatography A, 1312: 10-17, 2013. 314
YANEVA Z., et al. 5. Wegst-Uhrich, S., Navarro, D., Zimmerman, L. and Aga, D., Assessing antibiotic sorption in soil: a literature review and new case studies on sulfonamides and macrolides, Chemistry Central Journal, 8 (5): 1-12, 2014. 6. Guo, X., C. Yang, Y. Wu & Z. Dang, 2014. The influences of pH and ionic strength on the sorption of tylosin on goethite. Environ. Sci. Pollut. Res., 21: 2572-2580. 7. Sokol, J., Popelka, P. and Nagy, J., Determination of tylosin in food of animal origin by liquid chromatography, Folia Veterinaria, 54(3): 167-171, 2010. 8. Pietron,W., W. Cybulski, K. Kos & A. Mitura, 2011. Analytical procedure for the determination of tylosin A in feedingstuff by liquid chromatography-ultraviolet detection, Bull. Vet. Inst. Pulawy, 55: 725-729. 9. Ahmed, M.B.M., Sree, Y.H.A., Abdel-Fattah, S.M., Hassan, N.S. and Saad, M.M.E., Determination of tylosin, spiramycin, and erythromycin residues in Egyptian buffaloes’ meat by thin-layer chromatography– bioautography, Journal of Planar Chromatography, 26(5): 409–416, 2013. 10. Vargas, A., Tylosin tartrate adsorption onto granular activated carbon in the presence of humic acid, BSc Thesis, Faculty of LʼEcole Nationale Supérieure des Industries Chimiques and Worcester Polytechnic Institute, Nancy, France, 1-88, 2011. 11. Hoese, A., Clay, S.A., Clay, D.E., Oswald, J., Trooien, T., Thaler, R. and Carlson, C.G., Chlortetracycline and tylosin runoff from soils treated with antimicrobial containing manure, Journal of Environmental Science and Health, Part B: Pesticides, Food Contaminants, and Agricultural Wastes, 44(4): 371-378, 2009. 12. O'Neil, M.J., The Merck Index - An Encyclopedia of Chemicals, Drugs, and Biologicals. 13th Edition, Whitehouse Station, NJ: Merck and Co., Inc., 2001. 13. International Conference on Harmonization of Technical Requirements for Registration of Pharmaceuticals for Human Use, ICH Harmonized Tripartite Guideline, Validation of Analytical Procedures: Text and methodology, Q2 (R1): 1-13, 2005. 14. Ghanem, M. and Abu-Lafi, S., Development and validation of RP-HPLC method for the simultaneous determination of trimethoprim, sulfadimidine sodium and tylosin tartrate in injectable solution formulation, Journal of Applied Pharmaceutical Science, 5 (01): 094098, 2015.
Trakia Journal of Sciences, Vol. 13, Suppl. 2, 2015
YANEVA Z., et al.
Trakia Journal of Sciences, Vol. 13, Suppl. 2, 2015
315