Recognition of Hidden Factors In Requirements Prioritization Using Factor Analysis Mr. Seyed Ali Marjaie
Mrs. Vasundhara Kulkarni
Symbiosis Centre for Information Technology Symbiosis International University (SIU) Pune, India
[email protected]
Symbiosis Centre for Information Technology Symbiosis International University (SIU) Pune, India
[email protected]
Abstract— Requirements prioritization is one of the important activities in the requirements engineering process, which aims in identifying the most fitting requirements for a specific release of a system. In order to systematically perform this activity, many approaches have been introduced so far. Most of these prioritization techniques are based on the attributes such as value, cost, and risk. We believe that there are several other unobserved factors in the requirements prioritization process, which have significant impact on prioritization result itself. This paper aims to describe variability among the observed attributes in terms of fewer unobserved factors using factor analysis method. The proposed method not only reduces the number of attributes by combining two or more of them into a single factor, but also tries to identify groups of inter-related attributes, to see how they are related to each other. The proposed method has a significant potential to practically bring into play, especially in large projects to mitigate the number of attributes involved in requirements prioritization phase and simplify the decision making process. Keywords-requirements requirement engineering.
I.
prioritization,
factor
analysis,
INTRODUCTION
The importance of requirements prioritization becomes more crucial when it comes to medium and large size projects. Existing software requirements prioritization approaches recruit different scale and measurement tools to determine the prioritization of listed requirements. And this ranking, due to existence of some unseen factors during the prioritization, most of the time is not a bias free prioritization. Requirement analysis experts generally considering one or few attributes and leveraging their past experience try to increase the accuracy of the prioritization process. However in software requirements prioritization lack of an inclusive statistical method to comprehend the effect of majority of the attributes on the outcome of the prioritization process is conspicuous. Thus, the objective of this paper is to find out minimum number of factors that affect or greatly influence the process
of prioritizing requirements and provide tangible evidence for existence of hidden factors using factor analysis method. II. BACKGROUND Existing approaches of requirement analysis is mostly based on prioritization of requirements [1]. This trend of studies on requirement analysis started with methods that combine different aspects affecting priority. A set of prioritization methods is based on the idea that the priority of a requirement is a combination of the estimates of values given to different aspects that affect the priority of a requirement [2]. The most typical aspects of these methods to be included in the prioritization are the requirement’s value for the customer and the implementation costs of the requirement [2]. In 1980 Analytical Hierarchy Process (AHP) method came with the idea of comparing unique pairs of requirements to determine which of the two is of higher priority and to what extent. Evolution of same approach came with Hierarchy AHP, in which only requirements on the same level of a hierarchy are compared with each other [2]. On the basis of AHP method, Cost-value approach was proposed by Karlsson and Ryan for the first time during the year 1997 [3]. According to this method, requirements pairs are compared in accordance to their importance and implementation costs. The percentage share that a requirement has for total value and the total costs of all requirements are calculated for each requirement [3]. Ordinal cost-value approach came in 2005 by Karlsson and Regnell [4]; they propose that requirements are put into three groups according to their value to customers and into three groups according to their implementation costs. The results are presented in a cost-value scattered diagram. In 1990 XP version of cost-value approach came to existence as Planning Game [5], where the project group estimates for every user story how many programming weeks it will take to implement it and the user decides which user stories is to be implemented first.
978-1-4244-5392-4/10/$26.00 ©2010 IEEE
Wiegers’ method was the other approach [6], which proposes that every requirement is evaluated on a scale from 1 to 9 according to its value to the customer, the penalty if it is not implemented, implementation costs, and risks. Priority is calculated by dividing sum of value and penalty by sum of cost and risks.
•
“The communality of a test is the total proportion of its variance that is accounted for by the extracted factors” [10].
•
“The communality is the squared multiple correlation (R2) between the test and the factors emerging from the factor analysis. If the factors are independent (as they will be in the example we shall consider), the communality is given by the sum of the squares of the loadings of the test on the extracted factors. The communality of a test is related to its reliability: an unreliable test cannot have a high communality” [10].
•
“The eigenvalue (or latent root) of a factor is the total variance accounted for by the factor. If the eigenvalue is divided by the number of tests in the battery, the quotient is the proportion of the total test variance that is accounted for by the factor. The first factor extracted has the largest eigenvalue, the second the next largest eigenvalue, and so on. The process of extraction continues until the factors extracted account for negligible proportions of the total variance” [10].
•
“If the eigenvalues of successive factors are plotted against the ordinal numbers of the factors, the curve eventually flattens out and has been likened to the rubble or scree on a mountainside. This is known as a scree plot. There is general agreement that the factorial litter or ‘scree’ begins when the eigenvalues fall below one” [10].
•
“The process of rotation changes the eigenvalues of the factors that have been extracted, so that the common factor variance accounted for by the extraction is more evenly distributed among the factors after rotation. The communalities, on the other hand, are unchanged by rotation” [10].
In 2006, Impact validation method was proposed by Gilb [7]. This method considers the impact of each proposed requirement on the achievement of the high-level goals of the project. The requirement having the greatest impact is seen as the most important and so on. Compared to a statistical method, which current study proposes, all mentioned methods give a wider insight for prioritization and may help to take different aspects affecting priority into account better [3]. However, many of these methods usually provide much more definite results than hidden factors involved in. For example an individual importance percentage for each requirement, it should be remembered that no result can be better than the estimates given. III.
PROPOSED METHOD
A. Overview of factor Analysis Factor analysis method is one of statistical tools originated in the field of psychology and gradually extended into areas of behavioral sciences, social sciences, marketing, product management, and operations research [8]. The main purpose of factor analysis is to realize patterns in the model of relationships amongst the variables. It tries to find out if the observed variables can be explained or modeled in terms of a reduced number of variables called factors. It is used to represent the variability among variables in terms of hidden factors and also to identify groups of inter-related variables and observe their internal relationships with each other. Factor analysis has many applications in analyzing data, which some important ones are as below: • Access to hidden dimensions among variables, which is not easy to observe them •
Reduce the number of variables into fewer factors by combining them
•
Identification of suitable factors in order to perform analysis such as multiple regression and discriminate analysis
•
Create a new collection of factors, which can be used instead of main variables in future analysis
In order to employ factor analysis method, we need to familiarize ourselves with some related terminology: •
“The loading of a test on a factor is the correlation between the test and the factor” [10].
Now in order to apply factor analysis method we need to form a dataset. This dataset is a collection of requirements, in rows and attributes of requirements as columns. List of requirements will be available after requirements elicitation process. But to determine the involved attributes associated with each requirement, a systematic approach of attribute identification should be followed. B. Identification of Attributes Each individual requirement is associated with a collection of variables, which in this method we call them attributes as shown in Fig.1. The attributes in fact are those dimensions of each requirement, which is expected to have significant impact on the result of prioritization. Number and nature of attributes may vary from project to project and requirement to
points of view,and fill the corresponding Requirements Attribute Sheet. 4) List all the common assigned attributes amongst all the requirements and make a list of them. C. Numeral Assignment Numeral assignment is an activity, which starts after freezing the number of common attributes of requirements. The proposed numeral assignment technique is based on the method, which provides a scale for each requirement [4].
5 4 3 1 2 4 3 5 3 2
500 800 50 120 345 200 250 300 200 100
50 60 4 12 30 43 55 234 333 234
2 2 2 2 2 5 4 3 2 1
5 4 5 2 4 4 3 3 2 2
5 4 3 3 2 2 2 1 1 3
4 2 4 3 4 4 2 4 3 2
Repetitiveness
5 5 5 3 4 3 5 3 2 4
Business Value Reuse Frequency
REQ1 REQ2 REQ3 REQ4 REQ5 REQ6 REQ7 REQ8 REQ9 REQ10
Desirability
3) Declare one single requirement at a time and ask for proposal of different related attributes from different
TABLE I. NUMERAL ASSIGNMENT OF 10 REQUIREMENT ON 10 ATTRIBUTES
Difficulty
2) Prepare a chart called Requirements Attribute Sheet as shown in Table IV, allocating each row to proposed attribute with columns called attribute ID, attribute name and attribute type. Attribute type is the data type of corresponding variable, which in data formation phase we will assign a value of same type. For example “cost” is a type of “currency” and only a currency value can be assgined to it.
2) Recognition of Hidden Factors In Table III, the first block of three columns, labeled
Risk
1) List the entire identified requirements group by functionalities and features of the software system.
1) Data Formation Suppose after a session of attribute weight assignment the outcome of the weight assignment activity has been tabulated as a data sheet. In this hypothetical case study we are assuming that we have 10 requirements and all requirements have 10 common attributes such as “Importance”, “Harm Avoidance”, “Cost”, “Time”, “Risk”, “Difficulty”, “Business Value”, “Reuse Frequency”, “Desirability”, and “Repetitiveness” as presented in Table I.
Time
Proposed method of attribute elicitation and assignment is a brainstorming sessions during requirement analysis phase of a project. Members of this session may vary based on nature of project but requirement analyzer, designer, and a domain expert should be present as fixed members. Below steps should be followed to elucidate and define the attributes of requirements during a brain storming session.
A HYPOTHETICAL REQUIREMENTS FACTOR ANALYSIS
Cost
Second Approach: Conducting an attribute elicitation session for different requirements. In this method we define attributes of a requirement as those characteristics of requirement, which defines one or more future behaviors of the requirement within the whole project.
IV.
Harm Avoidance
First Approach: Using the same attributes, which already have been elicited as common attributes according to related previous studies [12]. The list of common attributes gathered from different studies are as: Personal preference, Business value, Harm avoidance, Risk, Cost, Difficulty, Time to market, Requirements stability, Dependencies among requirements, Implementation dependencies, Different kinds of requirements, Legal mandate, Frequency of use, and Reuse [12].
Importance
requirement. To identify the associated attributes we have two different approaches proposed in this paper.
Requirement ID
Figure 1. Illustration of a set of observable attributes of a requirement mapped to corresponding variables ( X 1 , X 2 ,..., X n )
During a session of attribute weight assignment the list of attributes would be available for participants to assign each attribute of a requirement a number on a scale of 1 to 5 to indicate its weight. Most of the attributes are scalable in the range of 1 to 5, however in case of some attributes such as cost, time, etc. the attribute’s type will be defined accordingly. The proposed ranges carry the following meanings: (1) Very low (the customer does not need it), (2) Low (the customer would accept its absence), (3) Average (the customer would appreciate it), (4) High (the customer does not want to be without it) and (5) Very high (the customer cannot do without it).
5 5 5 4 5 2 3 2 2 2
2 3 1 2 2 4 2 1 2 3
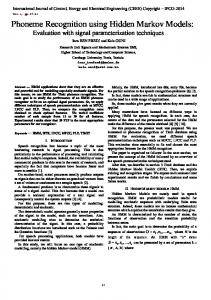
“Initial Eigenvalues”, comprises the eigenvalues and the contributions they make to the total variance. The eigenvalues determine which factors remain in the analysis, meaning factors with an eigenvalue of less than 1 for example factors 5 to 10 are excluded. In this analysis, the four factors that meet the Kaiser criterion [10] account for nearly 87% of the variance (see column labeled Cumulative %). The second block of three columns “Extraction Sums of Squared Loadings” repeats the output of the first block for the four factors that have met Kaiser’s criterion. The third block “Rotation Sums of Squared Loadings” tabulates the output for the rotated factor solution. Notice also that the accumulated proportion of variance from the two components is the same for the rotated and unrotated solutions. Note that the communality for each test, i.e., the total proportion of the variance of the test accounted for by the factor analysis, has not been changed by rotation. Fig. 2 shows the scree plot, which provides a graphic image of the eigenvalue for each factor extracted. It can be seen that the factor analysis has extracted four factors and factors one, two, three and four has an eigenvalue of more than 1, and hence only the first four components have been retained [10]. Table II shows the rotated factor matrix. The purpose of rotation is not to change the number of factors extracted, but to try to arrive at a new position for the axes (factors) which is easier to interpret in requirements engineering terms. The five attributes of “desirability”, “time”, “importance”, “business value”, and “difficulty” now have high loadings on one factor alone (factor 1). Also “reuse frequency” and “repetitiveness” have high loadings on the second factor. Moreover the two attributes of “Harm Avoidance” and “cost” attributes have high loadings on third factor. And the “risk” attribute has high loading on the forth factor alone.
TABLE II. ROTATED FACTOR MATRIX Factors 1
2
Desirability
.896
.172
Time
-.867
-.158
Importance
.827
Business_Value
.802
Difficulty
.710
3
4 -.293
.229
-.355
.213
-.104
-.253
.229
-.184
.479
.400
.195
Reuse_Frequency
.898
.171
Repetitiveness
-.651
.617
.298
.911
Cost
.382
-.289
.760
Risk
-.148
.181
.112
Harm_Avoidance
.199 .909
Current study is based on exploratory method of factor analysis, in which the main object is to find minimum number of factors necessary to account for the correlations among the test [10]. In requirements prioritization too, the major concern is to find a valid factor to judge between the requirements in order to give them a right priority. Existing methods recruits one or limited number of attributes in the process of requirements prioritization, whereas current approach recruits and unites almost all the necessary attributes into few loaded factors. Data deduction in this approach helps create limited number of factors made of multiple attributes involved in requirements prioritization process. This approach is based on a concrete statistical method that helps construct a valid scale to be used in requirements prioritization process. V.
CONCLUSION
In this paper, we proposed a new statistical approach to recognition of hidden factors during requirements prioritization process. This statistical method is based on attributes elicitation, numeral assignment, and factor analysis. This method improves the existing prioritization methods and effectively enhances the stability of factors involved in prioritization process, which has an important theoretic value and applied value in practice. This method helps organizations to realize and comprehend the effects of explored factors on rank of each requirement. REFERENCES [1]
[2]
Figure 2. Scree Plot; Illustration of a the eigenvalue for each factor
L. Laura, M. Kauppinen, and S. Kujala “Requirements Prioritization Challenges in Practice” Springer Berlin / Heidelberg, Vol. 3009/2004, pp. 497-508, 2004. L. Laura, “Providing value by prioritizing requirements throughout software product development; State of practice and suitability of prioritization methods”, Helsinki University Of Technology Department of Computer Science and Engineering, Espoo, 05.09.2006
[4]
[5] [6] [7]
KARLSSON, J. and RYAN, K. “A Cost-Value Approach for Prioritizing Requirements”, IEEE Software 14 (5), pp. 67–74, 1997. KARLSSON, L. and REGNELL, B. “Comparing Ordinal and Ratio Scale Data in Requirements Prioritisation”, Workshop on Comparative Evaluation in Requirements Engineering, 2005. BECK, K. “Extreme Programming Explained”, Upper Saddle River, NJ: Addison-Wesley, 1999. WIEGERS, K. “ Software requirements, second edition. Redmond”, WA: Microsoft Press, 2003. GILB, K. “Evo - Evolutionary Project Management & Product Development”. Book, 2006.
[8]
J. F. Lawless, “Ridge and related estimation procedure,” Commun Stat A, vol. 7, 1978, pp. 139–164. [9] Zheng Yanyan, Xu Renzuo, "The Basic Research of Human Factor Analysis Based on Knowledge in Software Engineering,", International Conference on Computer Science and Software Engineering, vol. 5, pp.1302-1305, 2008. [10] Kinnear, Paul R.,D. Gray “SPSS 12 made simple” 1st ed., 2004, pp. 433 – 457. [11] T. Saaty, ”The Analytic Hierarchy Process”, McGraw-Hill, Inc. 1980 [12] D. Firesmith, “Prioritizing Requirements”, ETH Zurich, Chair of Software Engineering, Vol. 3, No.8, September-October 2004.
TABLE III. TOTAL VARIANCE EXPLAINED Initial Eigenvalues Component
[3]
Extraction Sums of Squared Loadings
Rotation Sums of Squared Loadings
Total
% of Variance
Cumulative %
Total
% of Variance
Cumulative %
Total
% of Variance
Cumulative %
1
3.846
38.465
38.465
3.846
38.465
38.465
3.557
35.574
35.574
2
1.959
19.591
58.056
1.959
19.591
58.056
1.792
17.925
53.498
3
1.604
16.039
74.094
1.604
16.039
74.094
1.740
17.398
70.897
4
1.255
12.552
86.646
1.255
12.552
86.646
1.575
15.749
86.646
5
.639
6.389
93.036
6
.460
4.603
97.638
7
.190
1.903
99.541
8
.036
.358
99.899
9
.010
.101
100.000
10
-1.73E-016
-1.73E-015
100.000
TABLE IV. REQUIREMENTS ATTRIBUTE SHEET Attribute ID Att. 1 Att. 2 Att. 3 Att. 4 Att. 5 Att. 6 Att. 7
Requirement ID: Req. 103 Attribute name Cost Time Reuse of code Complexity Desirability Frequency Risk
Attribute type Currency [USD] Time [Hour] Numeral range [1-5] Numeral range [1-5] Numeral range [1-5] Numeral range [1-5] Numeral range [1-5]