Astronomical Data Analysis Software and Systems VI. ASP Conference ... describe an optical surface or wavefront in terms of aberrations. The advantages and ...
Astronomical Data Analysis Software and Systems VI ASP Conference Series, Vol. 125, 1997 Gareth Hunt and H. E. Payne, eds.
Refined Simplex Method for Data Fitting Y.-S. Kim Optical Science Laboratory, Department of Physics and Astronomy, University College London, London, WC1E 6BT, U.K. Abstract. The simplex method, a data fitting method to any type of function, is refined by eliminating a redundant process. The refined method is applied to Zernike polynomials in Cartesian coordinates, which describe an optical surface or wavefront in terms of aberrations. The advantages and disadvantages of the simplex method are discussed.
1.
Introduction
The simplex method was first introduced by Nelder & Mead (1965) for finding the minimum value of functions. O’Neill (1971) produced a fortran implementation of the simplex method, and Caceci & Cacheris (1984) applied the simplex method to curve fitting and produced a PASCAL program. When the algorithm of the simplex method was re-examined, a redundant mechanism in the process was found. This fact has been checked by using Zernike polynomials in Cartesian coordinates. Zernike polynomials are well-known and broadly used functions for describing the wavefront of optical systems in terms of aberrations. Data fitting to Zernike polynomials has mainly been done by the least-squares method (Malacara et al. 1990; Rayces 1992). However, in order to use the least-squares method, the function to be fitted should have a derivative function, and the function terms should be orthogonal or transformed to be orthogonal (Rayces 1992), to make the calculation easy. The Simplex method needs neither the derivative function nor the orthogonality condition. The simplex method is used for curve fitting to Zernike polynomials in Cartesian coordinates. 2.
Variance
The variance (σ 2 ) of function y = f (xi ), i = 1–n over k data sets is, k X σ = {yj − f (x1j , x2j , x3j , ..., xnj )}2 . 2
(1)
j=1
The coefficients that minimize the variance give the best-fitted function. If we take a simple 2-dimensional function y = ax + b, then the variance will be, σ 2 = Σ(yj − axj − b)2 = minimum. 206
Copyright 1997 Astronomical Society of the Pacific. All rights reserved.
(2)
Refined Simplex Method for Data Fitting
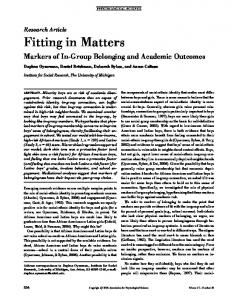
Figure 1.
207
A response surface of σ 2 versus a and b.
A graph of the variance versus the coefficients a and b is shown in Figure 1, which is called a response surface. Each ellipse is a contour of equal variance. The lowest point on the figure will give the appropriate value of the coefficients.
3.
The Simplex Method
The algorithm and codes for the simplex method are described in other papers (Nelder & Mead 1965; O’Neill 1971; Caceci & Cacheris 1984), so I will not explain them in full detail. The only thing I want to mention is the four mechanisms of vertex movements. Vertices are moved toward the minimum point by the four mechanisms, reflection, expansion, contraction, and shrinkage. Reflection moves the highest (worst) vertex to the opposite side of the center of the other vertices. Expansion moves the highest vertex to twice the distance from the center, which is used when a reflected vertex is lower than the lowest vertex and the expanded vertex becomes the lowest one. Contraction moves to the middle between the highest vertex and the center, which is used when a reflected vertex is higher than the highest vertex. When the contracted vertex is still higher than the highest vertex, all the vertices except the lowest vertex move toward the lowest one by half, which is called shrinkage.
4.
The Refined Simplex Method
When the simplex algorithm was examined, it was found that shrinkage does not occur when curve fitting. The variance is the sum of squares, so the response surface is always an (n + 1) dimensional paraboloid. So, either the reflected vertex or contracted one should be lower than the highest one.
208
Kim
5.
Zernike Polynomials Fitting
The wavefront of optical systems used to be described by Zernike polynomials, as each term of the polynomials shows aberrations individually. Zernike polynomials in Cartesian coordinates (Cubalchini 1979; Genberg 1983) of four and nine terms are, respectively, z z
= c0 + c1 x + c2 y + c3 (2r 2 − 1), 2
(3) 2
2
2
= c0 + c1 x + c2 y + c3 (2r − 1) + c4 (x − y ) + 2c5 xy + c6 x(3r − 2) + c7 y(3r 2 − 2) + c8 (6r 4 − 6r 2 + 1), where r 2 = x2 + y 2 .
(4)
In order to check whether the simplex method fits well with Zernike polynomials in Cartesian coordinates, simulations have been done for mirror data. 6.
Simplex Curve Fitting
The simulated mirror is spherical, with diameter of 760 mm and radius of curvature 5400 mm. The mirror surface is divided into 51×51 grid lines, whose intersections mark 1959 points on the mirror surface. The simulation program is written in C, converted from Caceci & Cacheris’s (1984) PASCAL program. Zernike polynomials in Cartesian coordinates are adapted. The first step of the simulation is to give initial values to the coefficients and calculate the height error on each point on the mirror surface from the mirror data. Then, from the height error data, new coefficients are derived by the simplex method. The result of the simulation can be judged by comparing the derived coefficients to the true coefficients. The initial values of the coefficients are all set zero, since the ideal mirror would be aberration-free. The calculation is terminated when the difference between the maximum and the minimum coefficient value on each term is less than 10−4 . Table 1 shows the result of the simulations. The first two simulations are done for four term Zernike polynomials and the other two for nine term Zernike polynomials. The table shows that the derived coefficients are quite accurate. During the simulations described above, the number of iterations for each mechanism is counted, in order to check whether shrinkage is used in the simplex calculation. Table 1 also gives the number of iterations on each mechanism. The “Iteration” row shows the number of total iterations of the simplex process, and the last four rows give the number of iterations of each of the four mechanisms. It clearly shows that shrinkage never occurs. 7.
Conclusions
The simplex method is one of the best curve fitting methods, having several advantages. First, it is simple to use. Compared to the well-known least-squares method, the simplex method does not need the derivative function, nor does the orthogonality condition apply. Second, it is easy to adopt any function in the computer program—only the function evaluation needs to be changed. And since the response surface is a paraboloid, there are no local minima giving false
209
Refined Simplex Method for Data Fitting Table 1. method.
c0 c1 c2 c3 c4 c5 c6 c7 c8
Simulation of Zernike polynomial fitting by the simplex
Simulation 1 Simulation 2 Simulation 3 Given Derived Given Derived Given Derived −0.2137 −0.2137 −0.0739 −0.0739 0.0115 0.0115 −0.0977 −0.0977 0.1999 0.1999 0.2340 0.2340 0.1357 0.1357 −0.1600 −0.1600 0.0262 0.0262 −0.1117 −0.1117 −0.1229 −0.1229 −0.0186 −0.0186 0.0276 0.0276 0.1930 0.1930 0.0036 0.0036 −0.0378 −0.0378 0.0049 0.0049
Iteration Reflection Expansion Contraction Shrinkage
Simulation 4 Given Derived 0.2169 0.2169 −0.0617 −0.0617 0.0146 0.0146 −0.1362 −0.1362 −0.0187 −0.0187 0.0152 0.0151 −0.0151 −0.0150 0.0145 0.0145 −0.0822 −0.0822
127
108
652
1584
55 21 51 0
46 16 46 0
444 70 138 0
1077 219 288 0
solutions. However, the simplex calculation is a little slower than the analytic least-squares calculation. And when the algorithm is examined, it is found that one of the four mechanisms, shrinkage, is not necessary. This fact is confirmed by testing Zernike polynomials in Cartesian coordinates. Eliminating the shrinkage mechanism would make the computing time a little bit shorter. References Caceci, M. S., & Cacheris, W. P. 1984, Byte, May, 340 Cubalchini, R. 1979, J. Opt. Soc. Am., 69, 972 Genberg, V. L. 1983, SPIE, 450, 81 Malacara, D., Carpio-Valad´ez, J. M., & S´anchez-Mondrag´ on, J. J. 1990, Optical Engineering, 29, 672 Nelder, J. A., & Mead, R. 1965, Comp. J., 7, 308 O’Neill, R. 1971, Applied Statistics, 20, 338 Rayces, J. L. 1992, Appl.Optics, 31, 2223