Journal of Electronic Imaging 17(1), 013002 (Jan–Mar 2008)
Region-of-interest processing for electronic visual prostheses Justin R. Boyle Anthony J. Maeder Commonwealth Scientific and Industrial Research Organization Information and Communication Technologies Center E-Health Research Center PO Box 10842, Adelaide Street Brisbane, Queensland 4000 Australia E-mail:
[email protected] Wageeh W. Boles Queensland University of Technology School of Engineering Systems GPO Box 2434 Brisbane, Queensland 4001 Australia
Abstract. Electronic visual prostheses, or “bionic eyes,” are likely to provide some coarse visual sensations to blind patients who have these systems implanted. The quality of artificially induced vision is anticipated to be very poor initially. Research described explores image processing techniques that improve perception for users of visual prostheses. We describe visual perception experiments undertaken with 192 normally sighted viewers to simulate artificially induced vision expected from emerging electronic visual prosthesis designs. Several variations of region-of-interest (ROI) processing were applied to images that were presented to subjects as lowresolution 25⫻ 25 binary images. Several additional processing methods were compared to determine their suitability for use in automatically controlling a zoom-type function for visual prostheses. The experiments show that ROI processing improves scene understanding for low-quality images when used in a zoom application.
strategies to present the most useful information to implanted users considering this great information loss. Experiments described in this paper aim to assess several image processing methods to determine which method best helps users move through a scene. The next section describes the region-of-interest 共ROI兲 importance framework of the processing used. We then describe the experiments and show the types and range of images used and the instructions given to participants. Results are then presented that demonstrate the usefulness of importance map/ ROI processing to select a region within the image and present that alone to a viewer.
1 Introduction Developers of electronic visual prostheses, or “bionic eyes,” aim to restore some basic mobility guidance to blind persons via electric pulses delivered to nerves in the visual pathway. Good reviews of the history and present state of the art in visual prostheses systems can be found in Veraart et al.,1 Dowling,2 Warren et al.,3 Margalit et al.,4 and Hallum et al.5 The numbers of electrodes that can be implanted is finite, and only coarse resolution without gray scale can be expected at least for early designs. There is a large information loss between the images captured from the prosthesis camera and the stimulation delivered to the electrodes. We have been reviewing useful image processing
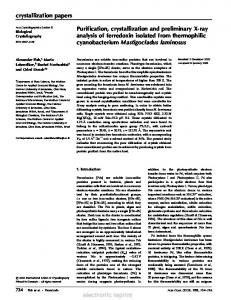
2 Processing Techniques Our philosophy for image processing is to identify important or salient areas within an image and present a representation of this spatial variation to the implant electrodes. There are numerous ROI algorithms that claim high correlation with subjective tests using eye-tracking machines 共e.g., Refs. 6–8兲. We have applied variations to a regionbased method referred to as importance mapping,9 which aims to predict where the human eye fixates on an image using several image features known to influence attention. Figure 1 depicts the process. An image is first segmented into regions of similar properties. We use a split and merge segmentation algorithm based on gray level variance. Feature maps/images are then constructed from the segmented image corresponding to five features known to influence attention:
© 2008 SPIE and IS&T. 关DOI: 10.1117/1.2841708兴
Paper 06173R received Sep. 28, 2006; revised manuscript received May 21, 2007; accepted for publication Aug. 6, 2007; published online Feb. 15, 2008. 1017-9909/2008/17共1兲/013002/12/$25.00 © 2008 SPIE and IS&T.
Journal of Electronic Imaging
013002-1
• Intensity contrast—Regions of high-intensity contrast from surrounding regions are more important.10 • Size—The larger a region, the more important.11 Jan–Mar 2008/Vol. 17(1)
Boyle, Maeder, and Boles: Region-of-interest processing for electronic visual prostheses
scaling the result so that the region of highest importance has a value of 1.0. It is the method of combing the feature maps, i.e., the weights depicted as k earlier, that form the processing variations applied in these tests. Two experiments were conducted: • Presentation of the entire ROI processed image—The whole image was ROI-processed, downsampled, and binarized and then displayed to viewers. • Presentation of only the salient area found from ROI processing only—This experiment employed ROI methods to identify salient areas, and then only those salient areas, were downsampled, binarized, and displayed. 3
Fig. 1 Importance mapping concept; lighter regions denote areas of high importance.
• Shape—Elongated regions are more important than round regions.12 • Centralness—Regions in the center of the viewing area are more important.13 • Foreground/background—The closer an object, the more important.14 Each region in the feature map is assigned an importance score, normalized from 0 共not important兲 to 1 共very important兲—that is, lighter areas in the feature maps should grab a viewer’s attention more than darker areas. From the five feature maps, an overall importance map is created from combining these feature maps. We perform a normalized sum of squares as indicated here: 5
IM共Ri兲 =
关k · 共Ri兲兴2 兺 k=1 max共Ri兲
,
共1兲
where IM共Ri兲⫽importance of region Ri, k sums through the five importance factors, k⫽ weight applied to vary contribution of feature to overall importance map, max共Ri兲⫽ maximum region importance. The final IM is produced by Journal of Electronic Imaging
Experiment 1—ROI Processing Applied to Entire Image 3.1 Image Preparation The images used in the tests were prepared as shown in Fig. 2. We tested six image processing methods: four variations of importance mapping, edge detection, and a nonprocessed “base case.” In all methods, the final image was nearest-neighbor resized to 25⫻ 25 spatial resolution, which is representative of electrode numbers in prosthesis prototypes15 and is a level that others have found to result in reasonable performance in visual acuity, reading speed, and obstacle avoidance.16–18 One test case had gray levels equalized before thresholding at the 128 gray level, while a second test set had thresholding only at the 128 level with no histogram equalization. Histogram equalization spreads the gray levels out across the full grayscale range, and it is intuitive to apply this equalization to use the full dynamic range obtainable from the image. Other methods of histogram transformations 共e.g., stretch, uniform兲 may be considered, but as the eventual image is reduced to very few shades, the differences are unlikely to be influential. Histogram equalization depends on illumination and object shades of gray and can introduce spurious shadings in the thresholded image that do not actually represent image objects 共see Fig. 3兲. Hence it was desired to find whether there were any differences in the preferred processing algorithm using histogram equalization. The final preparation step shown in the image blocks at the bottom of Fig. 2 involves comparing the thresholded images with the original 256⫻ 256 test image and inverting 共i.e., changing black pixels to white and vice versa兲 if necessary to most closely match the original gray level. The importance map algorithm highlights areas of high interest by mapping to gray scale, where white areas denote high importance. For example, the original image in Fig. 2 shows a dark figure and shadow on a light background. The importance map algorithm highlights the figure and shadow as white regions on a dark background. In this case, the thresholded images were inverted to appear like the original image. 3.2 Processing Methods Six methods of processing an original high-quality image were compared 共Fig. 4兲:
013002-2
Jan–Mar 2008/Vol. 17(1)
Boyle, Maeder, and Boles: Region-of-interest processing for electronic visual prostheses
Fig. 2 Image preparation for simulated prosthetic vision 共25⫻ 25 binary images兲.
共a兲
IM eq⫽ importance mapping with all features weighted equally:
contrast = size = shape, etc. 共b兲
IM sc⫽ importance mapping with weights selected depending on the image scene type. We have characterized several scene types that a blind person might encounter in terms of image processing descriptors. Table 1 shows some pro-
Journal of Electronic Imaging
013002-3
共c兲
posed weights for each feature map depending on the scene type. The percentage weights shown in the table indicate the weight to apply to that feature map to produce the resulting importance map. A 50% level would indicate neutral leaning/ bias. Previous tests have shown that improved perception may be obtained with processing images with respect to scene type in this way.19 IM tr⫽ weights selected in accordance with a Jan–Mar 2008/Vol. 17(1)
Boyle, Maeder, and Boles: Region-of-interest processing for electronic visual prostheses
Fig. 3 The effects of histogram equalization were assessed in the experiments. 共A兲 Original image; 共B兲 subsampled 共25⫻ 25兲 and thresholded 共128 gray level兲; 共C兲 subsampled 共25⫻ 25兲, with histogram equalized and thresholded 共128 gray level兲. Shaded areas do not necessarily correlate with scene objects in images that have had gray levels equalized 共C兲.
Fig. 4 Processing methods used in the tests 共see text for details兲.
training set of images from that scene type. The process followed for selecting weights is shown in Fig. 5. Step 1 involved producing feature maps for each test image and determining the percentage of pixels in the top 25% of each feature map 共i.e., between 0.75 and 1 in the normalized images兲. This gave a measure of the strength of that feature for that image. For some images, there would be no pixels in the range 0.75 to 1.00 for that feature, while for others, 100% of the image pixels might lie in this 0.75 to 1.00 importance range. Step 2 then involved constructing a training dataset consisting of 15 images of each scene category used in the tests. Figure 5 also shows the training database for Beach images that excludes the test image. Feature map distributions were produced from calculating the percentage of pixels in the range 0.75 to 1.00 for all feature maps
共d兲
of the 14 images in the training set. Step 3 involved comparing the percentage of pixels in this upper 0.75 to 1.00 range in the test image 共determined from step 1兲 with the distributions determined in step 2. Weights were selected according to the position of the test image within the feature distribution. For the example shown in Fig. 5, the “contrast” map associated with a test image had 7.4% of pixels in the range 0.75 to 1.00. Each data point in the plot at the bottom of Fig. 5 represents the percentage of pixels in this same range the contrast feature maps produced from the training dataset of 14 different images depicting Beach scenes. Interpolating the data from this plot, the value of 7.4% of the test image is greater than approximately 67% of the training images. Thus, the weight applied to the contrast feature map when combining feature maps for this test image is 0.67. IM opt⫽ weights iteratively adjusted in order to give the highest number of edges in the resulting
Table 1 Attentional feature weights for each scene type. Attentional feature Intensity contrast
Size
Shape
Centralness
Foreground/ background
Scene
Lots of contrast 共100%兲 versus little contrast 共0%兲
Large regions 共100%兲 versus small regions 共0%兲
Long and skinny 共100%兲 versus broad and round 共0%兲
Most viewing in central view 共100%兲 versus periphery 共0%兲
Foreground 共100%兲 versus background 共0%兲
Office
70%
25%
90%
100%
90%
Home
90%
50%
50%
95%
70%
Street
20%
50%
100%
50%
25%
Outdoors
80%
100%
10%
50%
25%
Head and Shoulders
80%
25%
50%
100%
100%
Café
20%
50%
50%
80%
100%
Toilets
30%
50%
10%
80%
90%
Journal of Electronic Imaging
013002-4
Jan–Mar 2008/Vol. 17(1)
Boyle, Maeder, and Boles: Region-of-interest processing for electronic visual prostheses
Fig. 5 Feature map weights selected from the training set of scene categories.
importance map. Previous simulation tests have found that a subject’s ability to recognize objects in low-quality images is correlated with the quantity of edges in that image.20 We used a mediumscale quasi-Newton line search optimization rouJournal of Electronic Imaging
013002-5
共e兲
tine to adjust the five weights to maximize the number of edges in the importance map. Edge⫽ edge detection. Considering that the number of edges were found to correlate with correct object recognition, we wanted to present an edge Jan–Mar 2008/Vol. 17(1)
Boyle, Maeder, and Boles: Region-of-interest processing for electronic visual prostheses
共f兲
map alone. We used the Canny edge detection method operating on 25⫻ 25 spatial resolution images. No IP⫽ no importance map processing. Finally, an image was presented with no importance processing applied, as a base comparison case. The images were prepared for viewing in an identical manner as earlier, but there was no ROI processing applied, i.e., 256⫻ 256 grayscale test images were nearest-neighbor subsampled to 25⫻ 25 spatial resolution, then thresholded at 128 gray level with one test set undergoing histogram equalization prior to thresholding.
3.3 Images Used We chose six categories that a blind person might encounter and four images for each category 共Fig. 6兲. Image selection was made on the basis of forming functional mobility problems. Dowling et al.21 have reviewed previous efforts in enhancing mobility for visually impaired persons, including the following mobility problems: • • • • • Fig. 6 Images used in the tests comprised a range of scene types that a blind person might encounter.
Lighting conditions and glare Changes in terrain and depth 共stairs, curbs兲 Unwanted contacts 共bumps兲 Street crossings Visual clutter
3.4 Participants and Instructions A group of 242 volunteers participated in the experiment. From this, 50 samples were discarded 共21%兲 due to either incomplete responses or subjects who normally wore
Fig. 7 Example of test stimuli presented to subjects to test whether presenting a region-of-interestprocessed image is useful for mobility. Option 共f兲 shows the no importance processing option, which was most favored. Journal of Electronic Imaging
013002-6
Jan–Mar 2008/Vol. 17(1)
Boyle, Maeder, and Boles: Region-of-interest processing for electronic visual prostheses
Fig. 9 Digital zoom concept—the most salient area is identified in an image and resized to the maximum display resolution.
Fig. 8 When presenting the entire image, results indicate a clear preference for no importance processing 共n = 96兲.
ent 共P = 0.2兲. This indicates that there is no real advantage in tweaking feature weights for the importance map method for low-quality images. Another issue of interest was histogram equalization. A two sample t-test was performed using 36 observations 共six processing methods and the average results of each of six scene types兲 at ␣ = 0.05, found that histogram equalization does not result in significant differences. Figure 8 also shows the processing methods divided into scene type. The lower plot indicates which scene types may be better suited for a particular processing method. For example, one of the processing methods compared in the experiment was edge detection. The data shown in Fig. 8 indicate that low-quality edge maps were best recognized for house and street scenes. ANOVA testing using eight observations of six image types shows significantly higher results for house and street scenes 共P = 0.0005兲.
glasses/contact lenses but who were not wearing them at that time. This left 192 normally sighted or corrected-tonormal viewers. Half the sample 共n = 96兲 viewed the images that were graylevel equalized, while the other half viewed the nonequalized images. The number of samples ranked was equal for all processing methods. Subjects were presented with an original high-quality 共256⫻ 256 grayscale兲 image and the instruction: If you were trying to move through this scene, which version would you find most helpful? The six different versions of the image were presented in a random order below the instruction. An example of the test stimuli presented to subjects is shown in Fig. 7. Viewing conditions for the experiment were not controlled.
4 Experiment 2—Digital Zoom The preceding results indicate that the base case was best for presenting images—i.e., presenting subsampled and binarized images only, without any ROI processing. However, rather than presenting an entire ROI-processed image, improved perceptual results might be obtained with using ROI processing to identify salient areas within an image and presenting those areas alone 共in a subsampled and binarized form兲. In effect the approach is to find interesting areas within the image and perform a “digital zoom”— enlarging those salient areas to the resolution limit set by the implant electrode array 共see Fig. 9兲. It is anticipated that digital zoom would be a common and easily implemented prosthesis function, and it would be useful to make this zoom method automatic for a blind user.
3.5 Experiment 1—Results There was a clear preference in both the equalized and nonequalized viewer group for no importance processing 共base case兲. This was the most chosen method for six of the six scene types, especially for faces, where 85% of subjects chose that processing method. Figure 8 shows the breakdown of viewer preferences. The column heights in the upper plot represent the mean percentage of subjects choosing each processing method across all 24 images. Error bars representing 95% confidence intervals around these mean preferences show the variability among the 24 images. Analysis of variance 共ANOVA兲 performed on the data shown in Fig. 8 showed that the “clear” preference for no importance processing 共No IP兲 was highly significant 共P = 1.5E − 8兲. ANOVA testing also showed that the means of the other processing methods were not significantly differJournal of Electronic Imaging
4.1 Automatic Zoom Methods We conducted an additional test comparing seven methods of zooming into an image. For the purposes of this exercise, the original image was 256⫻ 256 spatial resolution.
013002-7
1. IM_trim 共Fig. 10兲 A trimmed version of an importance map to include only elements above a threshold, thus representing only the very important areas. The threshold used was 95% of the maximum gray level 共256兲 within each image. Images were progressively trimmed from their outer border until only pixels above the threshold remained. Each row and column was trimmed away if pixels within the entire row or column fell below the threshold. Trimming would stop if pixels equal to or above the threshold were detected or the image size reduced to 25 pixels, Jan–Mar 2008/Vol. 17(1)
Boyle, Maeder, and Boles: Region-of-interest processing for electronic visual prostheses
2. Fig. 10 Trim method to select zoom window.
3.
4. 5. Fig. 11 Scope box method to select zoom window.
as this was the minimum image dimension that was presented. As we were presenting square images, we needed to make the final image into a square of dimensions equal to the maximum dimensions of the trimmed box. The smaller dimension was expanded until the image dimensions were equal, and the expansion direction was on the basis that pixels of more important regions were added. IM _ scope 共Fig. 11兲 A 128⫻ 128 box size containing the highest gray level values in a 256⫻ 256 importance map, i.e., one quarter of the image area. The 128⫻ 128 box was moved pixel by pixel across the image until it contained the highest sum of pixel values. The trim method described in step 1 applied to a saliency map generated by code obtained from iLab at the University of Southern California.6,22 A saliency map is created from combining three feature maps corresponding to color, intensity, and orientation at six spatial scales. Unlike the importance map concept, which segments images first into regions, the saliency feature maps are created from differenceof-Gaussian 共Mexican-hat兲 operators applied directly to pixel data 共Fig. 12兲. Default values for the code implementation were used. The 128⫻ 128 box scope method described in step 2 applied to a saliency map. A 128⫻ 128 box containing the horizontal and vertical center of the image 共Fig. 13兲. This method has no dependence on image content and relies on spatial
Fig. 12 Saliency map developed by iLab 共University of Southern California兲. 共top兲 Difference of Gaussians filter applied to three feature maps; 共bottom兲 saliency map output showing regions-of-interest. Journal of Electronic Imaging
013002-8
Jan–Mar 2008/Vol. 17(1)
Boyle, Maeder, and Boles: Region-of-interest processing for electronic visual prostheses
Fig. 13 Zoom window selected from central 25% of image.
position with the image only. It assumes that the centermost part of an image may be the area worth zooming into. 6. Similar to step 5 in that there is no dependence on image content, this method crops a 128⫻ 128 box aligned at the bottom center of the image. This area may be significant for a viewer especially when mobile, as it contains the foreground immediately in front of the camera 共Fig. 14兲. 7. For reference, an option of No Zoom was also included, where the whole 256⫻ 256 image was represented. For all of the preceding methods, the stimulus presented to viewers was the cropped zoomed version from the original resized to 25⫻ 25 spatial resolution 共Fig. 15兲. One test case had graylevels equalized before thresholding at the 128 gray level, while a second test set had only thresholding at the 128 level with no histogram equalization. The same subjects who viewed the earlier described experiment where the entire ROI-processed image was presented also viewed the variations on zoom method. Half the sample 共n = 96兲 viewed the images that were graylevel equalized, while the other half viewed the nonequalized images. An example of the test stimuli presented to subjects is shown in Fig. 16. The presentation order of zoom variations was randomized, and viewing conditions for the experiment were not controlled. Subjects were shown a zoom window overlaid on the original image, in addition to a 25⫻ 25 black-and-white version of the zoom window. When overlaid on the original image, the zoom window was shown as a white square bordered on the inside and outside by a black square to maximize visibility on all background gray levels 共see Fig. 17兲. 4.2 Experiment 2—Results Viewer preferences are shown in Fig. 18. Error bars representing 95% confidence intervals are shown on the upper plot and were obtained from average preferences for the six scene types. ANOVA testing on the seven processing meth-
Fig. 15 Image preparation for digital zoom tests.
ods resulted in strongly significant differences between the means 共P = 7.1E − 8 and 2.3E − 6 for nonequalized and equalized datasets, respectively兲. The trim method applied to saliency maps 共Sal trim兲 had the highest preference for automatically zooming into a part of the image. This method was best overall and for four of the six scene types. For beach scenes, the trim method applied to importance maps 共IM trim兲 was best, while for café scenes, which contained high clutter, No Zoom was best. A two-sample t-test performed using 42 observations 共seven processing methods and the average results of each of six scene types兲 at ␣ = 0.05 found that histogram equalization does not result in significant differences. The trim methods 共Sal trim and IM trim兲 were approximately twice as good as the scope methods 共Sal scope and IM scope兲. This may be due to the scope box method having a fixed box size 共equal to one quarter of the image area兲, while the box size for the trim method varied depending on the image, potentially returning a more useful zoomed image. Thus, if a digital zoom function were to be employed in a prosthesis design to highlight areas that may help a visually impaired user, favorable results are most likely to be achieved with the saliency map method. The trim method on importance maps 共IM trim兲 is also slightly better than zoom windows based on a geometric part of the image that do not consider image content. 5 Limits of the Study The research described in this paper is bounded by the following limitations and assumptions:
Fig. 14 Zoom window selected from central-bottom 25% of image. Journal of Electronic Imaging
013002-9
• Psychophysical sensations of what might be seen with a visual prosthesis was simulated by presenting visual stimuli to normally sighted viewers. Little human trailing of visual prostheses has yet been conducted from which to obtain data from implanted patients. It is anticipated that some of the experiments comparing image processing techniques described in this paper could be repeated using implanted patients when available. Jan–Mar 2008/Vol. 17(1)
Boyle, Maeder, and Boles: Region-of-interest processing for electronic visual prostheses
Fig. 16 Example of test stimuli presented to subjects to test different methods to automatically zoom in to one area of the image. Option 共c兲 shows the saliency trim method, which was most favored.
• The perceived quality of an image is dependent on the number of electrodes in the implant, with higher numbers of electrodes giving higher spatial resolution of images. This work was based on the premise that the number of electrodes in an implant is limited to a finite small number due to size and stimulation constraints 共perceiving individual spots of light from adjacent electrodes rather than one big bright one兲. Image processing was used to optimize the amount of
Fig. 17 Example stimulus showing detail of zoom window border. Journal of Electronic Imaging
Fig. 18 Preferences for methods to automatically zoom in to an image 共n = 96兲.
013002-10
Jan–Mar 2008/Vol. 17(1)
Boyle, Maeder, and Boles: Region-of-interest processing for electronic visual prostheses
useful visual information obtainable from the relatively few electrodes in the implants. • Perception experiments were based on static/still images. Improved perception is anticipated if the techniques are applied to image sequences/video, as a user would be offered a richer representation of a scene, in addition to moving about to see how scene elements 共background/foreground兲 interact. Chen et al.23 conjecture that temporal properties of the human visual system may as much as double the sampling rate of the phosphene matrix, in effect, doubling the spatial frequency band of perception. • The images presented to subjects in simulation experiments were ordered pixel arrays in a square pattern 共equal image height and width兲. The reported evoked visual field of implanted patients is not a regularly ordered array and varies from patient to patient. Due to this wide variability, it was decided to present a symmetric image representation to gauge some understanding of low-quality images. Other studies of simulated prosthetic vision have explored circular pixels, squares on a black background, and Gaussian pixels.16–18,24–26 Also, slight improvements in perception performance have been reported using regular hexagonal mosaics of electrodes rather than rectangular layouts.27 Given that a limited number of stimulating electrodes is physically possible, it is evident that some type of information content enhancing processing is required. It is anticipated that implant users would undergo tuning and training through postoperative exercises similar to auditory implant programs to use viable electrodes efficiently. • Other techniques related to implant electrode stimulation exist that may produce different psychophysical sensations. One such technique could be using different electrode current flow and return paths to create wide variations in perceived visual sensations. This paper does not consider such techniques and is instead based on manipulating conventional pixel-based images digitally 共digital image processing兲 to improve visual perception.
6 Conclusion We have described a comparison of region-of-interest processing methods for the emerging field of electronic visual prostheses. Experiments we have conducted show that it is better to use importance map/region-of-interest processing to select a region within the image and present that alone, rather than presenting the actual importance/salience representation for the entire image. Our modeling with importance maps indicated that there is no advantage in tweaking feature weights or performing histogram equalization when displaying low-quality images. This is a worthwhile conclusion to allow the computational overhead required for this processing to be used elsewhere in prosthesis systems. This work has allowed wider implementation of regionof-interest image processing routines beyond previous applications and facilitated further understanding of the human visual system, specifically perception performance from low-quality visual information. It is hoped that this work provides a basis from which more complex and benJournal of Electronic Imaging
eficial 共e.g., real time兲 image processing units can be developed such that a prosthesis may provide maximum benefits to the blind. Acknowledgments We appreciate all the volunteers who participated in the subjective testing, including students at Brisbane State High School and their coordinating teachers, as well as participating family members and colleagues. We are grateful to Wilfried Osberger, Laurent Itti, and Dirk Walther of iLab for permission to implement variations of their importance map and saliency codes in this research. References 1. C. Veraart, F. Duret, M. Brelén, M. Oozeer, and J. Delbeke, “Vision rehabilitation in the case of blindness,” Expert Rev. Medical Devices, 1共1兲, 139–153 共2004兲. 2. J. Dowling, “Artificial human vision,” Expert Rev. Medical Devices, 2共1兲, 73–85 共2005兲. 3. D. Warren and R. Normann, “Visual neuroprostheses,” in Handbook of Neuroprosthestic Methods, W. Finn and P. Lopresti, Eds., The Biomedical Engineering Series, CRC Press, Boca Raton, FL, 2003, p. 261–306. 4. E. Margalit, M. Maia, J. Weiland, R. Greenberg, G. Fujii, G. Torres, D. Piyathaisere, T. O’Hearn, W. Liu, and G. Lazzi, “Retinal prosthesis for the blind,” Surv. Ophthalmol. 47共4兲, 335–356 共2002兲. 5. L. Hallum, G. Dagnelie, G. Suaning, and N. Lovell, “Simulating auditory and visual sensorineural prostheses: a comparative review,” J. Neural Eng. 4共1兲, S58–S71 共2007兲. 6. L. Itti and C. Koch, “Feature combination strategies for saliencybased visual attention systems,” J. Electron. Imaging 10共1兲, 161–169 共2001兲. 7. C. Privitera and L. Stark, “Focused JPEG encoding based upon automatic pre-identified regions-of-interest,” in Human Vision and Electronic Imaging IV, T. Rogowitz and T. Pappas, Eds., Proc. SPIE 3644, 552–558 共1999兲. 8. W. Osberger and A. Rohaly, “Automatic detection of regions of interest in complex video sequences,” in Human Vision and Electronic Imaging VI, T. Rogowitz and T. Pappas, Eds., Proc. SPIE 4299, 361– 372 共2001兲. 9. W. Osberger and A. Maeder, “Automatic identification of perceptually important regions in an image using a model of the human vision system,” in 14th International Conference on Pattern Recognition, A. Jain, S. Venkatesh, and B. Lovell, Eds., pp. 701–704, IEEE Computer Society 共1998兲. 10. A. Yarbus, Eye Movements and Vision, Plenum Press, New York 共1967兲. 11. J. Findlay, “The visual stimulus for saccadic eye movement in human observers,” Perception 9, 7–21 共1980兲. 12. A. Gale, “Human response to visual stimuli,” in The Perception of Visual Information, W. Hendee and P. Wells, Eds., pp. 127–147, Springer, Secaucus, NJ 共1997兲. 13. G. Elias, G. Sherwin, and J. Wise, “Eye movements while viewing NTSC format television,” SMPTE Psychophysics Subcommittee White Paper 共1984兲. 14. B. Cole and P. Hughes, “Drivers don’t search: they just notice,” in Visual Search, D. Brogan, Ed., pp. 407–417, Taylor and Francis, London 共1990兲. 15. W. Liu, E. McGucken, K. Vichienchom, S. M. Clements, S. C. Demarco, M. Humayun, E. de Juan, J. Weiland, and R. Greenberg, “Retinal prosthesis to aid the visually impaired,” IEEE International Conference on Systems, Man, and Cybernetics, Vol. 4, pp. 364–369 共1999兲. 16. K. Cha, K. Horch, and R. Normann, “Mobility performance with a pixelised vision system,” Vision Res. 32共7兲, 1367–1372 共1992兲. 17. K. Cha, K. Horch, R. Normann, “Simulation of a phosphene-based visual field: visual acuity in a pixelized vision system,” Ann. Biomed. Eng. 20共4兲, 439–449 共1992兲. 18. K. Cha, K. Horch, and R. Normann, “Reading speed with a pixelized vision system,” J. Opt. Soc. Am. A 9共5兲, 673–677 共1992兲. 19. J. Boyle, A. Maeder, and W. Boles, “Scene specific imaging for bionic vision implants,” ISPA2003—Proc. 3rd International Symposium in Image and Signal Processing and Analysis, S. LonCariC, A. Neri, and H. Babic, pp. 423–427, IEEE Signal Processing Society, Part 1 共2003兲. 20. J. Boyle, A. Maeder, and W. Boles, “Inherent visual information for low quality image presentation,” in WDIC 2003—2003 APRS Workshop on Digital Image Computing: Medical Applications of Image Analysis, B. Lovell and A. Maeder, Eds., pp. 51–56, The Australian Recognition Society 共2003兲.
013002-11
Jan–Mar 2008/Vol. 17(1)
Boyle, Maeder, and Boles: Region-of-interest processing for electronic visual prostheses 21. J. Dowling, A. Maeder, and W. Boles, “Mobility enhancement and assessment for a visual prosthesis,” in Human Vision and Electronic Imaging IX, T. Rogowitz and T. Pappas, Eds., Proc. SPIE 5369, 780– 791 共2004兲. 22. Saliency map source code sourced from iLab, University of Southern California: http://ilab.usc.edu/toolkit/共May 22, 2007兲. 23. S. Chen, L. Hallum, G. Suaning, and N. Lovell, “A quantitative analysis of head movement behaviour during visual acuity assessment under prosthetic vision simulation,” J. Neural Eng. 4共1兲, S108– S123 共2007兲. 24. L. Hallum, D. Taubman, G. Suaning, J. Morley, and N. Lovell, “A filtering approach to artificial vision: a phosphene visual tracking task,” in IFMBE Proc., World Congress on Medical Physics and Biomedical Engineering, International Federation for Medical and Biological Engineering, 4 pages 共2003兲. 25. R. Thompson, G. Barnett, and M. Humayun, “Facial recognition using simulated prosthetic pixelized vision,” Invest. Ophthalmol. Visual Sci., 44共11兲, 5035–5042 共2003兲. 26. J. Hayes, V. Yin, D. Piyathaisere, J. Weiland, M. Humayun, and G. Dagnelie, “Visually guided performance of simple tasks using simulated prosthetic vision,” Artif. Organs 27共11兲, 1016–1028 共2003兲. 27. S. Chen, L. Hallum, N. Lovell, and G. Suaning, “Visual acuity measurement of prosthetic vision: a virtual-reality simulation study,” J. Neural Eng. 2共1兲, S135–145 共2005兲.
Wageeh W. Boles is an associate professor in the School of Engineering Systems, Queensland University of Technology. His areas of expertise include image processing and computer vision and applications; object recognition; identification of humans using iris, palm, or facial features; video/ image-based security; and video/imagebased measurements and classifications.
Justin R. Boyle received a BE degree in mechanical engineering from the University of Queensland in 1995 and a PhD degree from Queensland University of Technology in 2005. He is currently a research scientist with the E-Health Research Centre, CSIRO, Brisbane, where he is assessing wearable sensor technologies on health outcomes.
Anthony J. Maeder holds a PhD in software engineering from Monash University, and his current research specializations are digital image processing and human vision, including medical imaging applications. He holds a concurrent appointment as an adjunct professor at the University of Queensland and as research director of the E-Health Research Centre, CSIRO, and he serves on the SPIE International Technical Committee for Medical Imaging.
Journal of Electronic Imaging
013002-12
Jan–Mar 2008/Vol. 17(1)