European Heart Journal – Cardiovascular Imaging (2013) 14, 435–442 doi:10.1093/ehjci/jes163
Regional left ventricular rotation and backrotation in patients with reverse septal curvature hypertrophic cardiomyopathy Floris Kauer, Bas M. van Dalen, Osama I.I. Soliman, Heleen B. van der Zwaan, Wim B. Vletter, Arend F.L. Schinkel, Folkert J. ten Cate, and Marcel L. Geleijnse* Department of Cardiology, The Thoraxcenter, Erasmus University Medical Center, Room BA 302, ’s-Gravendijkwal 230, Rotterdam 3015 CE, The Netherlands Received 28 April 2012; accepted after revision 16 July 2012; online publish-ahead-of-print 16 August 2012
Aims
----------------------------------------------------------------------------------------------------------------------------------------------------------Keywords
Speckle-tracking echocardiography † Regional left ventricular function † Left ventricular rotation † Hypertrophic cardiomyopathy
Introduction Hypertrophic cardiomyopathy (HCM) is a primary autosomaldominant disorder of the myocardium caused by mutations in sarcomeric contractile proteins.1 It is well known that HCM patients have not only diastolic dysfunction but also abnormalities in left ventricular (LV) systolic function, in particular in LV longitudinal velocities,2 longitudinal strain,2,3 radial strain,3 and rotation.4,5 LV rotation is caused by obliquely oriented layers of myocardial tissue in the subendocardium and the subepicardium,6 and can be quantified by speckle-tracking echocardiography (STE).4,7
Since the LV segments in HCM patients are asymmetrically involved in the hypertrophic process,4,8 regional differences in LV rotation may be expected. Therefore, this study sought to investigate regional LV rotation throughout the cardiac cycle in patients with HCM.
Methods Study participants The study population consisted of 44 patients with HCM (age 40 + 14 years, 33 men) and 44 age- and gender-matched, healthy, non-obese
* Corresponding author. Tel: +31 104633533; fax: +31 104635498. Email:
[email protected] Published on behalf of the European Society of Cardiology. All rights reserved. & The Author 2012. For permissions please email:
[email protected]
Downloaded from by guest on January 7, 2016
This study sought to investigate regional left ventricular (LV) rotation in patients with hypertrophic cardiomyopathy (HCM). ..................................................................................................................................................................................... Methods The study comprised 44 patients with HCM with a typical reverse septal curvature (age 40 + 14 years, 33 men) and 44 healthy volunteers (age 39 + 14 years, 32 men) in whom LV rotation could be assessed at the basal and apical LV and results level with speckle-tracking echocardiography, using the QLAB Advanced Quantification Software version 6.0 (Philips, Best, The Netherlands). In HCM patients, lower values of initial counter-clockwise rotation at the basal LV level (1.5 + 1.2 vs. 0.6 + 0.98, P , 0.001) were seen, in particular in the septal segment (1.7 + 1.6 vs. 0.4 + 0.78, P , 0.001). After this period, the direction of rotation changed to clockwise with a peak basal rotation of 24.8 + 2.08 in controls vs. 26.1 + 2.58 in HCM patients (P , 0.05). Peak basal rotation in HCM patients was in particular higher in the anterior (26.6 + 3.0 vs. 24.4 + 2.48, P , 0.01) and septal (25.4 + 2.6 vs. 23.9 + 1.98, P , 0.05) segments. The normalized (corrected for peak basal rotation) global back-rotation rate was lower in HCM patients (4.1 + 3.1 vs. 6.3 + 4.9 s – 1, P , 0.05), in particular driven by a lower rate in the septal segment (3.8 + 2.6 vs. 6.4 + 4.8 s21, P , 0.01). At the apical level, changes in rotation and back-rotation were more homogeneous. ..................................................................................................................................................................................... Conclusion Changes in rotation and back-rotation at the LV basal level in HCM patients are mainly caused by regional changes in the basal septal and anterior segments, the segments mostly involved in the hypertrophic process.
436 (body mass index ,25 kg/m2) volunteers (age 39 + 14 years, 32 men) in whom complete global and regional rotation could be assessed at both the basal and apical LV level. HCM was characterized morphologically and defined by a hypertrophied, non-dilated LV with a typical reverse septal curvature, in the absence of another systemic or cardiac disease that is capable of producing the magnitude of segment thickening seen.9,10 None of the volunteers was known to have hypertension, diabetes, or with a use of medication for cardiovascular disease, and all had a normal 12-lead electrocardiogram, normal left atrial, and LV dimensions, and LV function by transthoracic echocardiography. Informed consent was obtained and the institutional review board approved the study.
Echocardiography
Speckle-tracking analysis To optimize STE, images were obtained at a frame rate of 60 – 80 frames/s. Parasternal short-axis images at the LV basal level (showing the tips of the mitral valve leaflets) with the cross-section as circular as possible were obtained from the standard parasternal position, defined as the long-axis position in which the LV and aorta were most in-line with the mitral valve tips in the middle of the sector. To obtain a short-axis image at the LV apical level (just proximal to the level with end-systolic LV luminal obliteration), the transducer was positioned 1 or 2 intercostal spaces more caudal as previously described by us.12 From each short-axis image, three consecutive end-expiratory cardiac cycles were acquired and transferred to a QLAB workstation (Philips, Best, The Netherlands) for off-line analysis. Analysis of the data sets was performed using the QLAB Advanced Quantification Software version 6.0 (Philips, Best, The Netherlands),
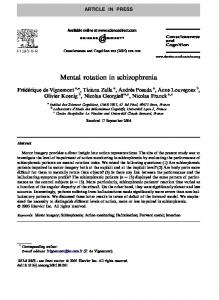
which was recently validated against magnetic resonance imaging for the assessment of LV twist.10,13 To assess LV rotation, six tracking points were placed manually (after gain correction) on an end-diastolic frame on the mid-myocardium in each parasternal short-axis image. Tracking points were separated about 608 from each other and placed on 1 (308, anteroseptal insertion into the LV of the right ventricle), 3 (908), 5 (1508), 7 (2108), 9 (2708), inferoseptal insertion into the LV of the right ventricle), and 11 (3308) o’clock to fit the total LV circumference. Rotation is calculated as the change in angle between the regions of interest that are tracked by the software and the LV centre. This LV centre is calculated by the software as the centre of the six afore mentioned tracking points. By default this LV centre is calculated only in the first frame of the loop. If there is significant intra-thoracic motion of the hearth during the cardiac cycle, this will result in misinterpretation of rotation of the regions of interest because the LV centre is not recalculated in the subsequent frames but remains fixed in position, which will result in rotation even when the regions of interest do not rotate. By the application of motion correction, Qlab will calculate the LV centre on a frame by frame basis and thus correct rotation by filtering out translational cardiac motion. (Figure 1) Data were exported to a spreadsheet program (Excel, Microsoft Corporation, Redmond, WA, USA) and processed by the use of macros written in Microsoft Virtual Basic to determine global and regional LV peak systolic rotation (Rotmax), and global and regional LV rotation at 25, 50, and 75% of ejection, aorta valve closure, mitral valve opening, E-peak, E-end, A-onset, A-peak, and aorta valve opening. Rotational data were subsequently calculated for the anterior, inferior, lateral (averaging the anterolateral and inferolateral segments), and septal (averaging the anteroseptal and inferoseptal segments) parts of the LV. The degree of diastolic back-rotation was expressed as a percentage of Rotmax: back-rotation ¼ (Rotmax 2 Rott)/Rotmax × 100%, where Rott is rotation at time t. The back-rotation velocity at a specific interval (from t1 to t2) during the cardiac cycle was calculated as (Rott2 2 Rott1)/(t2 2 t1). Since the back-rotation rate is both dependent on the absolute rotation and intrinsic myocardial properties, also the normalized back-rotation was calculated, defined as the back-rotation rate corrected for absolute rotation. In the Figures, counter-clockwise rotation as viewed from the apex was expressed as a positive value; clockwise rotation was expressed as a negative value. To adjust for intra- and inter-subject differences in the heart rate, the time sequence was normalized to the percentage of systolic duration. End-systole was defined as the point of aortic valve closure.
Statistical analysis Measurements are presented as mean + SD. Continuous variables were compared using an independent-samples t-test procedure with a confidence interval of 95% or one-way ANOVA procedure when appropriate and relationships between different parameters were assessed by Pearson’s correlation coefficient using analytics software (SPSS 19, IBM Corporation, New York, USA). A P-value ,0.05 was considered statistically significant. Intra-observer and inter-observer variabilities for LV rotation parameters in our centre varies from 2 + 3 to 10 + 9%, and 4 + 4 to 12 + 8%, respectively.
Results Echocardiographic dimensions HCM patients had larger LA dimensions and LV mass (Table 1), in particular because of hypertrophied anterior and septal segments
Downloaded from by guest on January 7, 2016
Two-dimensional grey scale harmonic images were obtained in the left lateral decubitus position using a commercially available ultrasound system (iE33, Philips, Best, The Netherlands), equipped with a broadband (1-5 MHz) S5-1. All echocardiographic measurements were averaged from three heartbeats. From the two-dimensional recordings, the following data were acquired: left atrial size, LV end-diastolic and endsystolic dimensions, and end-diastolic segment thickness. The LV mass was assessed with the two-dimensional area – length method [LV Mass ¼ 0.8 × 1.04 ((diastolic LV internal dimension + diastolic posterior wall thickness + diastolic septal wall thickness)3 2 (diastolic LV internal dimension)3)) + 0.6 g].10 The LV ejection fraction was calculated from LV volumes by the modified biplane Simpson rule in accordance with the guidelines.10 From the mitral-inflow pattern, peak early (E) and active (A) filling velocities, and the E/A ratio were measured. Furthermore, the timing of aortic valve opening and closure, mitral valve opening and closure, the peak and end of the E-wave, and the onset and peak of the A-wave were determined using a pulsed-wave Doppler. In each study, it was verified that the heart rate for the cardiac cycles in which the timing of the different intervals was assessed, was the same as the cardiac cycle used for the analysis of LV rotation parameters. HCM patients were stratified by the grade of diastolic dysfunction (Grades 1– 3)11: Grade 1, abnormal relaxation: E/A ratio ,0.75; Grade 2, pseudo normal filling: 0.75,E/A ratio ,1.5 and E-wave velocity deceleration time .140 ms; and Grade 3, restrictive filling: E/A ratio .1.5 and E-wave velocity deceleration time ,140 ms. In addition, all patients with diastolic dysfunction were required to have an E-wave velocity/peak early diastolic wave velocity of the septal mitral annulus ratio (E/Em ratio) of .8. Seven HCM patients (16%) could not perfectly fulfil all of the criteria for a particular diastolic dysfunction group, and were therefore excluded from this part of the analysis.
F. Kauer et al.
437
Regional LV rotation in HCM
(Figure 2). LV dimensions where lower, whereas the LV ejection fraction was comparable.
Basal LV rotation In control subjects, LV counter-clockwise rotation at the basal LV level from mitral valve closure until 25% ejection was seen. Lower values were seen in HCM patients (1.5 + 1.2 vs. 0.6 + 0.98, P , 0.001). This difference was seen in all basal LV segments (Table 2), but in particular in the septal segment (anterior 2.0 + 1.6 vs. 0.9 + 0.88, P , 0.001, inferior 1.6 + 1.6 vs. 0.6 + 0.78, P , 0.01, lateral 1.4 + 1.2 vs. 0.6 + 0.68, P , 0.01, septal 1.7 + 1.6 vs. 0.4 + 0.78, P , 0.001). After this period, the direction of rotation changed to clockwise with a peak basal rotation of 24.8 + 2.08 in control subjects vs. 26.1 + 2.58 in HCM patients (P , 0.05). The peak basal rotation in HCM patients was in particular higher in the anterior (26.6 + 3.0 vs. 24.4 + 2.48, P , 0.01) and septal (25.4 + 2.6 vs. 23.9 + 1.98, P , 0.05) segments.
Basal LV back-rotation The peak basal rotation was followed by back-rotation in a counter-clockwise direction. Global and regional back-rotation rates at the basal LV level were not significantly different in control subjects and HCM patients, although only in HCM patients the back-rotation rate was lower in the septal compared with the lateral segment (19.6 + 16.9 vs. 43.2 + 41.2 8/s, P , 0.01). However, the normalized (corrected for peak basal rotation) global back-rotation rate at the basal LV level was lower in HCM patients (4.1 + 3.1 vs. 6.3 + 4.9 s21, P , 0.05), in particular
driven by a lower normalized back-rotation rate in the septal segment (3.8 + 2.6 vs. 6.4 + 4.8 s21, P , 0.01).
Basal LV re-rotation In control subjects, but not in HCM patients, a short-lasting change in the direction of basal back-rotation, or re-rotation in a clockwise direction, from E-peak until E-end was seen (20.4 + 1.3 vs. 0.48 + 1.48, P , 0.005, Figure 3). Regionally this difference in rotation was significant in the hypertrophied anterior (21.3 + 2.3 vs. 0.1 + 1.98, P , 0.005) and septal (20.3 + 1.6 vs. 0.5 + 2.08, P , 0.05) segments but not in the inferior (20.2 + 2.2 vs. 0.4 + 2.18, P ¼ NS) and lateral (0.1 + 1.9 vs. 0.4 + 1.98, P ¼ NS) segments.
Apical LV rotation In control subjects, a brief LV clockwise rotation from the mitral valve closure until the aorta valve opening (isovolumic contraction period) was seen. Lower values were seen in HCM patients (20.7 + 0.7 vs. 20.3 + 0.48, P , 0.001). This difference was seen in all but the anterior LV segments (anterior 20.5 + 0.6 vs. 20.5 + 0.78, P ¼ NS, inferior 21.1 + 1.4 vs. 20.3 + 0.58, P , 0.001, lateral 21.0 + 1.1 vs. 20.3 + 0.58, P , 0.001, septal 21.0 + 1.1 vs. 20.5 + 0.68, P , 0.01). After this period, the direction of rotation changed to counter-clockwise with a peak rotation of 7.4 + 2.48 in control subjects vs. 6.9 + 3.08 in HCM patients (P ¼ NS). In none of the regional LV segments the difference between the peak apical rotation in control subjects vs. HCM patients reached significance.
Downloaded from by guest on January 7, 2016
Figure 1 QLAB analysis of regional rotation at the basal level of a patient with severe hypertrophic cardiomyopathy. In the upper panel the mid-myocardial tracking points are shown. In the lower panel the regional rotation curves are displayed by QLAB.
438
F. Kauer et al.
Table 1 Clinical and echocardiographic characteristics of the study population Hypertrophic cardiomyopathy (n 5 44)
Control subjects (n 5 44)
................................................................................ Clinical characteristics 40 + 14
39 + 14
Male, n (%) Heart rate, bpm
33 (75%) 63 + 10
32 (73%) 62 + 13
Systolic blood pressure, mmHg
127 + 18
122 + 14
Diastolic blood pressure, mmHg
77 + 9
75 + 8
Body mass index
24.5 + 3.7
22.6 + 2.4
Age, years
Body surface area, m2
1.9 + 0.2**
1.9 + 0.2
Echocardiographic characteristics Left atrial size, cm 4.6 + 0.7*
3.7 + 0.4
98 + 31*
55 + 18
4.4 + 0.5*
5.0 + 4.9
Lef atrial volume, mL LV end-diastolic dimension, cm Anterior
0.9 + 0.1
1.2 + 0.4*
0.8 + 0.1
Lateral Septal
1.2 + 0.3* 2.2 + 0.4* **
0.9 + 0.1 0.9 + 0.0
LV end-systolic dimension, cm
2.3 + 0.5*
3.4 + 0.5
LV ejection fraction, %
61 + 11
60 + 8
LV mass, g
291 + 114*
141 + 45
65 + 20 43 + 14
69 + 15 50 + 18
E, cm/s A, cm/s E/A ratio
1.7 + 0.8
1.6 + 0.7
Deceleration time, ms
179 + 54
168 + 35
Em septal, cm/s E/Em ratio
6.1 + 2.6* 11.9 + 5.5*
9.8 + 2.6 7.4 + 1.9
LV, left ventricular; E, peak early phase filling velocity; A, peak atrial phase filling velocity; Em, peak early diastolic mitral annular velocity. *P , 0.001 vs. control subjects. **P , 0.001 vs. opposite left ventricular segment.
Apical LV back-rotation The peak apical rotation was followed by back-rotation in a clockwise direction. The global back-rotation rate at the apical LV level and the normalized (corrected for peak apical rotation) global back-rotation rate at the apical LV level were lower in HCM patients (17.9 + 13.4 vs. 26.7 + 16.1 8/s, P , 0.05 and 3.0 + 2.0 vs. 4.2 + 2.6 s21, P , 0.05). This impairment in the back-rotation rate and the normalized back-rotation rate was seen in all regional LV segments, although only in the lateral segment it reached statistical significance (22.4 + 18.8 vs. 32.4 + 18.7 8/s, P , 0.01; and 3.0 + 1.8 vs. 5.1 + 3.5 s21, P , 0.05).
Temporal dispersion in basal and apical back-rotation In control subjects, there was a marked counter-clockwise backrotation from the moment of peak rotation until the E-peak at the LV basal level (24.8 + 2.08 – 20.9 + 1.58, back-rotation 79 + 44%), whereas relative clockwise back-rotation during this interval was significantly less (P , 0.001) at the apical level (7.4 + 2.48 –3.4 + 2.08, back-rotation 52 + 22%). In HCM patients, the difference between back-rotation at the LV basal level (26.1 + 2.58 – 21.6 + 3.08, back-rotation 76 + 39%) and the apical level (6.9 + 3.08 –2.3 + 2.68, back-rotation 60 + 36%) was not significantly different.
Relation of back-rotation to diastolic dysfunction and left atrial volumes Of the 37 analysable HCM patients, 9 patients had normal diastolic function, 2 patients had Grade 1 dysfunction, 19 Grade 2 dysfunction, and 6 Grade 3 dysfunction. The basal septal back-rotation rate was correlated to early diastolic septal mitral annular velocities (r ¼ 0.36, P , 0.05), E/Em (r ¼ 20.31, P , 0.10), and left atrial volume (r ¼ 20.20, P ¼ NS). The normalized basal septal backrotation rate was correlated to early diastolic septal mitral annular velocities (r ¼ 0.47, P , 0.01), E/Em (r ¼ 20.44, P , 0.01), and the left atrial volume (r ¼ 20.31, P , 0.10).
Discussion The major findings of this study in HCM patients with a reverse septal curvature are the following. (i) increased peak basal rotation is caused by regional increases in the peak rotation in the anterior and septal segments, (ii) a decreased normalized basal backrotation rate is in particularly driven by a regional decrease in the septal segment, (iii) at the apical level of the LV global and regional peak rotation rates are not increased, and (iv) the apical back-rotation rate is more homogeneously impaired.
Downloaded from by guest on January 7, 2016
1.9 + 0.5* **
Inferior
Figure 2 Example of a hypertrophied, non-dilated left ventricle with a typical reverse septal curvature; showing increased wall mass in particular in the septal (29 mm) and anterior (32 mm) wall.
Regional LV rotation in HCM
Table 2 Left ventricular rotation parameters in patients with hypertrophic cardiomyopathy and control subjects Control subjects
.................................................................................................. Global
Anterior
Inferior
Lateral
Septal
Patients with hypertrophic cardiomyopathy
.........................................................................................................
Global
Anterior
Inferior
Lateral
Septal
............................................................................................................................................................................................................................................. Basal rotation Peak systolic rotation (8) Apical rotation Peak systolic rotation (8) Basal back-rotation
24.8 + 2.0
24.4 + 2.4
26.3 + 2.9***
26.9 + 3.9
7.4 + 2.4
6.4 + 3.7
10.3 + 5.0***
7.4 + 4.6
23.9 + 1.9***
26.1 + 2.5*
26.6 + 3.0**
8.1 + 3.5
6.9 + 3.0
6.6 + 3.5
Back-rotation (8)
2.2 + 1.6
2.6 + 2.3
3.7 + 2.3
2.9 + 2.1
2.3 + 1.4
2.6 + 2.5
Back-rotation rate (8/s)
23.5 + 13.4
35.7 + 29.9
33.9 + 21.3
30.2 + 21.0
21.8 + 10.1
25.0 + 27.4
39.0 + 22
Back-rotation rate normalized (s21)
6.3 + 4.9
8.6 + 7.5
5.4 + 3.6
5.4 + 3.8
6.4 + 4.8
4.1 + 3.1*
6.6 + 4.5
Apical back-rotation Back-rotation (8) Back-rotation rate (8/s) Back-rotation rate normalized (s21)
3.6 + 2.5
27.3 + 3.5
27.1 + 3.8
9.0 + 5.5
7.5 + 3.7
3.7 + 3.2
3.7 + 3.7
28.7 + 36.7
43.2 + 41.2
4.5 + 4.5
7.2 + 6.0
22.7 + 1.8
23.4 + 2.7
23.7 + 2.9
23.4 + 2.3
23.1 + 2.1
22.1 + 1.4
22.6 + 2.4
23.2 + 2.3
226.7 + 16.1
228.3 + 20.5
237.9 + 27.6
232.4 + 18.7
229.8 + 24.9
217.9 + 13.4*
220.5 + 26.2
230.2 + 22.3
4.2 + 2.6
5.8 + 5.6
4.4 + 4.4
5.1 + 3.5
4.1 + 3.8
3.0 + 2.0*
3.5 + 3.2
4.3 + 3.3
23.0 + 2.4 222.4 + 18.8** 3.0 + 1.8*
25.4 + 2.6*,***
7.1 + 3.5
2.7 + 2.1 19.6 + 16.9**** 3.8 + 2.6**,****
22.5 + 2.0 221.7 + 28.0 2.8 + 2.5
Back-rotation rate normalized ¼ back-rotation rate corrected for maximal systolic rotation (back-rotation rate in % of maximal rotation per second). *P , 0.05, **P , 0.01 compared with healthy controls. ***P , 0.05, ****P , 0.01 compared with opposite LV wall.
439
Downloaded from by guest on January 7, 2016
440
F. Kauer et al.
mitral valve closure; AVO, aorta valve opening; 25, 50, and 75% percentage of systole; AVC, aorta valve closure; MVO, mitral valve opening; Emax and Eend, peak and the end of early passive diastolic filling, Aonset and Amax, beginning and peak late active diastolic filling.
Rotation and back-rotation at the LV basal level LV rotation originates from the dynamic interaction between oppositely wound subepicardial and subendocardial myocardial fibre helices.6 The direction of LV rotation is governed by the epicardial fibres, most likely because of their longer arm of movement.4 In healthy controls, initially a counter-clockwise rotation was seen at the LV basal level, most likely due to the predominant mechanical activity that develops along the right-handed subendocardial helix of myocardial fibres during isovolumic contraction. This phenomenon was less clearly visible in HCM patients, despite more basal clockwise rotation seen later in systole. Impaired subendocardial myocardial fibre function, evidenced in this study by lower longitudinal velocities of the mitral annulus, provides a rational explanation for this finding and is most likely caused by endocardial ischaemia due to microvascular dysfunction, as was previously shown by our group.14,15 Although decreased counter-clockwise rotation at the basal level during isovolumic contraction was seen in all LV segments in HCM patients, it was mostly decreased in the septal segment, the segment mostly involved in the hypertrophic process. After the isovolumic contraction period, increased peak basal clockwise rotation was seen in HCM patients. This finding may also be explained by a dysfunctional subendocardial fibre helix since this helix in systole normally tries to rotate the LV in the opposite, counter-clockwise direction. Also, larger radius differences in hypertrophic muscle between the
subepicardium and the subendocardium may increase the dominant action of the subepicardial fibres and increase the peak basal clockwise rotation.16 In control subjects regional peak basal clockwise rotation was lower in the anterior and septal segments.17 In HCM patients, it was due to a marked increase in the peak basal rotation in these specific segments that global peak basal rotation in HCM was increased, although the peak basal rotation in the septal segment was still lower compared with the lateral segment. Again, as seen in this study, these are the LV segments mostly involved in the hypertrophic process. After the peak basal rotation, back-rotation started. During the isovolumic relaxation period, rotated fibres at the basal and apical level act like a compressed coil that springs open while abruptly releasing potential energy. In a healthy heart this process may be actively supported by still depolarized subendocardial fibres that are, in contrast to the systolic period, now not opposed by active contraction of the subepicardial fibres. In control subjects, there were no significant differences in regional absolute and normalized backrotation rates at the basal LV level. In HCM patients, global normalized back-rotation rate was lower, equalling less percentual backrotation at any time point in the isovolumic relaxation period, as was previously reported by our group.18 In all regional LV segments lower absolute and normalized back-rotation rates were seen, although statistical significance was again only seen for the septal segment, the segment mostly involved in the hypertrophic process with most likely impaired compliance and impaired subendocardial myocardial fibre function.
Downloaded from by guest on January 7, 2016
Figure 3 Average global basal and apical left ventricular rotation curves in hypertrophic cardiomyopathy patients and healthy controls. MVC,
441
Regional LV rotation in HCM
Apical rotation and back-rotation
Temporal dispersion in basal and apical back-rotation and basal re-rotation In control subjects a temporal dispersion in back-rotation between the basal and apical LV level was seen during diastole. It was previously suggested that the base-to-apex relaxation facilitates active restoration of the LV cavity in early diastole.22,23 In addition, a short-lasting change in the direction of basal back-rotation, or re-rotation, from the E-peak until the E-end was seen in contrast to continuous back-rotation at the LV apical level. This re-rotation may be related to the sudden appearance of the rotational forces of the endocardial fibres, at the moment of complete cardiac repolarization. These differences at the apical and basal LV level in normal subjects may have an important role in the development and maintenance of the LV intraventricular pressure gradient24 and the vortex pattern,22 which ensure that suction and expulsion forces are generated in the most energy-efficient way. In HCM patients the hypertrophic geometry, regional cardiac dysfunction, and asynchronous conduction25 distort the timing and efficiency of the loading and expulsion dynamics of the hypertrophic LV. This was already shown by Notomi et al.,24,26 who studied in control subjects and a small number of HCM patients the mechano-haemodynamic causality of three successive echocardiographic phenomena in early diastole: pressure decay during isovolumic relaxation, peak untwist rate, and peak inter ventricular pressure gradient. The regional and global changes in rotational parameters found in this study may attribute to diastolic dysfunction in HCM patients and their inability to raise the intraventricular pressure gradient with exercise without increasing the left atrial
Limitations In the current study, only patients with good echocardiographic image quality that allowed for the complete segmental assessment of LV rotation at both the basal and apical LV levels were included. In our centre this represents about three-fourths of the patients. Obviously, this limitation may hamper the clinical implementation of LV rotation parameters. In addition, there still may have been some influence of the tracking ability, in particular in the problematic anterior wall,7 on measured values.
Conclusion Changes in rotation and back-rotation at the LV basal level in HCM patients with a typical reverse septal curvature are mainly caused by regional changes in the basal septal and anterior segments, the LV segments mostly involved in the hypertrophic process. At the apical level changes in rotation and back-rotation are more homogeneous. Conflict of interest: none declared.
References 1. Bos JM, Ommen SR, Ackerman MJ. Genetics of hypertrophic cardiomyopathy: one, two, or more diseases? Curr Opin Cardiol 2007; 22: 193 –9. 2. Sengupta PP, Mehta V, Arora R, Mohan JC, Khandheria BK. Quantification of regional nonuniformity and paradoxical intramural mechanics in hypertrophic cardiomyopathy by high frame rate ultrasound myocardial strain mapping. J Am Soc Echocardiogr 2005; 18: 737 –42. 3. Serri K, Reant P, Lafitte M, Berhouet M, Le Bouffos V, Roudaut R et al. Global and regional myocardial function quantification by two-dimensional strain: application in hypertrophic cardiomyopathy. J Am Coll Cardiol 2006; 47: 1175–81. 4. van Dalen BM, Kauer F, Soliman OI, Vletter WB, Michels M, ten Cate FJ et al. Influence of the pattern of hypertrophy on left ventricular twist in hypertrophic cardiomyopathy. Heart 2009; 95: 657 –61. 5. Chang SA, Kim HK, Kim DH, Kim JC, Kim YJ, Kim HC et al. Left ventricular twist mechanics in patients with apical hypertrophic cardiomyopathy: assessment with 2D speckle tracking echocardiography. Heart 2010; 96: 49 –55. 6. Greenbaum RA, Ho SY, Gibson DG, Becker AE, Anderson RH. Left ventricular fibre architecture in man. Br Heart J 1981; 45: 248 –63. 7. van Dalen BM, Soliman OI, Vletter WB, Kauer F, van der Zwaan HB, ten Cate FJ et al. Feasibility and reproducibility of left ventricular rotation parameters measured by speckle tracking echocardiography. Eur J Echocardiogr 2009; 10: 669 –76. 8. Frielingsdorf J, Franke A, Kuhl HP, Rijcken E, Krebs W, Hess OM et al. Evaluation of regional systolic function in hypertrophic cardiomyopathy and hypertensive heart disease: a three-dimensional echocardiographic study. J Am Soc Echocardiogr 1998; 11: 778 –86. 9. Nagueh SF, Lakkis NM, Middleton KJ, Spencer WH 3rd, Zoghbi WA, Quinones MA. Doppler estimation of left ventricular filling pressures in patients with hypertrophic cardiomyopathy. Circulation 1999; 99: 254 –61. 10. Lang R, Bierig M, Devereux R, Flachskampf F, Foster E, Pellikka P et al. Recommendations for chamber quantification: a report from the American Society of Echocardiography’s Guidelines and Standards Committee and the Chamber Quantification Writing Group, developed in conjunction with the European Association of Echocardiography, a branch of the European Society of Cardiology. J Am Soc Echocardiogr 2005; 18: 1440 –63. 11. Khouri SJ, Maly GT, Suh DD, Walsh TE. A practical approach to the echocardiographic evaluation of diastolic function. J Am Soc Echocardiogr 2004; 17: 290– 7. 12. van Dalen BM, Vletter WB, Soliman OI, ten Cate FJ, Geleijnse ML. Importance of transducer position in the assessment of apical rotation by speckle tracking echocardiography. J Am Soc Echocardiogr 2008; 21: 895 –8. 13. Goffinet C, Chenot F, Robert A, Pouleur AC, de Waroux JB, Vancrayenest D et al. Assessment of subendocardial vs. subepicardial left ventricular rotation and twist using two-dimensional speckle tracking echocardiography: comparison with tagged cardiac magnetic resonance. Eur Heart J 2009; 30: 608 –17.
Downloaded from by guest on January 7, 2016
In healthy controls, initially a clockwise rotation was seen at the LV apical level, most likely because of the aforementioned predominant mechanical activity that develops along the right-handed subendocardial helix of myocardial fibres during isovolumic contraction. Similarly as at the basal LV level, this phenomenon was less clearly visible in HCM patients, again most likely related to impaired subendocardial myocardial fibre function in HCM patients.15,19 After the isovolumic contraction period counter-clockwise rotation was seen in both control subjects and HCM patients, with comparable peak values. Also, in both groups peak systolic rotation was lowest in the anterior segment, consistent with the presence of less oblique myocardial fibres in the anterior LV segments.6 Several reasons may account for a non-increased peak systolic rotation. In HCM patients with a reverse septal curvature there is a gradient in the LV mass thickness from the basal to the apical myocardium.8 So, the aforementioned mechanisms that may increase LV rotation (larger radius differences in hypertrophic muscle between the subepicardium and the subendocardium, dysfunctional subendocardial fibre helix) will play a less important role at the LV apical level. In addition, the helical fibre configuration may not be optimal because of the distorted apical morphology,4,20 and the effectiveness of LV segment contraction depends on its curvature: the more convex towards the LV cavity the segment is, the less it contracts.21 Similarly, regional absolute and normalized backrotation rates were quite homogeneously lower, although statistical significance was only seen for the lateral segment.
pressure,26,27 clinically related to maximal oxygen consumption.28 – 30
442 14. Soliman OI, Knaapen P, Geleijnse ML, Dijkmans PA, Anwar AM, Nemes A et al. Assessment of intravascular and extravascular mechanisms of myocardial perfusion abnormalities in obstructive hypertrophic cardiomyopathy by myocardial contrast echocardiography. Heart 2007; 93: 1204 –12. 15. Soliman OI, Geleijnse ML, Michels M, Dijkmans PA, Nemes A, van Dalen BM et al. Effect of successful alcohol septal ablation on microvascular function in patients with obstructive hypertrophic cardiomyopathy. Am J Cardiol 2008; 101: 1321–7. 16. Takeuchi M, Borden W, Nakai H, Nishikage T, Kokumai M, Nagakura T et al. Reduced and delayed untwisting of the left ventricle in patients with hypertension and left ventricular hypertrophy: a study using two-dimensional speckle tracking imaging. Eur Heart J 2007; 28: 2756 –62. 17. van Dalen BM, Soliman OI, Vletter WB, ten Cate FJ, Geleijnse ML. Insights into left ventricular function from the time course of regional and global rotation by speckle tracking echocardiography. Echocardiography 2009; 26: 371 – 7. 18. van Dalen BM, Kauer F, Michels M, Soliman OI, Vletter WB, van der Zwaan HB et al. Delayed left ventricular untwisting in hypertrophic cardiomyopathy. J Am Soc Echocardiogr 2009; 22: 1320 –6. 19. Cecchi F, Olivotto I, Gistri R, Lorenzoni R, Chiriatti G, Camici PG. Coronary microvascular dysfunction and prognosis in hypertrophic cardiomyopathy. N Engl J Med 2003; 349: 1027 –35. 20. Taber LA, Yang M, Podszus WW. Mechanics of ventricular torsion. J Biomech 1996; 29: 745 –52. 21. Hutchins GM, Bulkley BH, Moore GW, Piasio MA, Lohr FT. Shape of the human cardiac ventricles. Am J Cardiol 1978; 41: 646– 54. 22. Sengupta P, Krishnamoorthy V, Korinek J, Narula J, Vannan M, Lester S et al. Left ventricular form and function revisited: applied translational science to cardiovascular ultrasound imaging. J Am Soc Echocardiogr 2007; 20: 539 –51.
F. Kauer et al.
23. Sengupta PP, Khandheria BK, Korinek J, Wang J, Jahangir A, Seward JB et al. Apexto-base dispersion in regional timing of left ventricular shortening and lengthening. J Am Coll Cardiol 2006; 47: 163– 72. 24. Notomi Y, Popovic Z, Yamada H, Wallick D, Martin M, Oryszak S et al. Ventricular untwisting: a temporal link between left ventricular relaxation and suction. Am J Physiol Heart Circ Physiol 2008; 294: pH505 –13. 25. Nagakura T, Takeuchi M, Yoshitani H, Nakai H, Nishikage T, Kokumai M et al. Hypertrophic cardiomyopathy is associated with more severe left ventricular dyssynchrony than is hypertensive left ventricular hypertrophy. Echocardiography 2007; 24: 677 –84. 26. Notomi Y, Martin-Miklovic M, Oryszak S, Shiota T, Deserranno D, Popovic Z et al. Enhanced ventricular untwisting during exercise: a mechanistic manifestation of elastic recoil described by Doppler tissue imaging. Circulation 2006; 113: 2524 –33. 27. Davis KL, Mehlhorn U, Schertel ER, Geissler HJ, Trevas D, Laine GA et al. Variation in tau, the time constant for isovolumic relaxation, along the left ventricular base-to-apex axis. Basic Res Cardiol 1999; 94: 41 –8. 28. Abozguia K, Nallur-Shivu G, Phan TT, Ahmed I, Kalra R, Weaver RA et al. Left ventricular strain and untwist in hypertrophic cardiomyopathy: Relation to exercise capacity. Am Heart J 2010; 159: 825– 32. 29. Rovner A, Greenberg NL, Thomas JD, Garcia MJ. Relationship of diastolic intraventricular pressure gradients and aerobic capacity in patients with diastolic heart failure. Am J Physiol Heart Circ Physiol 2005; 289: H2081 –8. 30. Notomi Y, Srinath G, Shiota T, Martin-Miklovic MG, Beachler L, Howell K et al. Maturational and adaptive modulation of left ventricular torsional biomechanics: Doppler tissue imaging observation from infancy to adulthood. Circulation 2006; 113: 2534– 41.
doi:10.1093/ehjci/jes272 Online publish-ahead-of-print 27 November 2012
.............................................................................................................................................................................
Pacemaker lead extraction complicated by a ‘free floating’ infected mass in the right atrium with embolization to the lung Senthil Kirubakaran* and Christopher Aldo Rinaldi Guy’s and St Thomas’ NHS Trust, Westminster Bridge Road, London SE16EH, UK
* Corresponding author. Tel: +44 1962881573; Fax: +44 2071881011; Email:
[email protected]
An 81-year-old man with ischaemic cardiomyopathy and a biventricular pacemaker and defibrillator was referred for system extraction due to infection. A transoesophageal echocardiogram (TOE) demonstrated a large mass/thrombus on the right atrial pacing lead (Panel 1). Surgical extraction was felt to be a high risk, therefore under general anaesthesia and using TOE, the left ventricular and right atrial leads were removed by manual traction and the defibrillator lead using a Panel 1 Left-large infected mass seen attached to the right atrial pacing lead, rightlaser system (Spectranetics Excimer Laser large mobile mass within the right atrium following lead extraction. System). Following extraction, the mass which was previously attached to the right atrial lead, was ‘free-floating’ within the right atrium (Panel 1, see Supplementary data online, Movie 1). After 1 min, this disappeared with likely embolization to the pulmonary circulation. This case illustrates the rare finding of leaving residual infected masses following transvenous pacemaker lead extractions and highlights the potential complication of embolization to the lungs. Transoesophageal echocardiography has been shown to be useful in these cases for determining the presence and evaluating the size of infected masses on pacing leads. When considering a surgical approach, factors such as mass friability, the presence of a patent foramen ovale or ASD and other surgical indications should be assessed. Supplementary data are available at European Heart Journal – Cardiovascular Imaging online. Published on behalf of the European Society of Cardiology. All rights reserved. & The Author 2012. For permissions please email:
[email protected]
Downloaded from by guest on January 7, 2016
IMAGE FOCUS