1 TU Wien, Institute of Materials Science and Testing, Vienna, Austria ... 3 Max Planck Institute of Colloids and Interfaces, Dept. of Biomaterials, Potsdam, ...
Mat. Res. Soc. Symp. Proc. Vol. 823 © 2004 Materials Research Society
W8.8.1
Regular, low density cellular structures - rapid prototyping, numerical simulation, mechanical testing J. Stampfl1 , M.M. Seyr2 , M.H. Luxner2 , H.E. Pettermann2 , A. Woesz3 , P. Fratzl3 1 TU Wien, Institute of Materials Science and Testing, Vienna, Austria 2 TU Wien, Institute of Lightweight Design and Structural Biomechanics, Vienna, Austria 3 Max Planck Institute of Colloids and Interfaces, Dept. of Biomaterials, Potsdam, Germany
ABSTRACT Cellular solids form the basis of many biological and engineering structures. Most models use the relative density and the mechanical properties of the bulk material as the main parameter for the prediction of the mechanical properties of such structures. In this work the influence of the architecture of periodic cellular solids on the mechanical properties is investigated numerically and experimentally. Using computer aided design, structures with 8x8x8 base cells are designed and fabricated. The physical prototypes which are tested experimentally are made from thermosetting and thermoplastic polymers by employing Rapid Prototyping (RP) techniques. Various RP techniques are compared regarding their suitability for the fabrication of cellular materials. For numerical simulation of the cellular structures, linear Finite Element analysis is employed. Three-dimensional models are set up using higher order beam elements. In a first step, the structure is treated as an infinite medium and homogenization via a ’periodic micro-field approach’ is used. The entire elastic tensors for different relative densities are evaluated, from which the directional dependencies of the Young’s moduli are derived. In a second step, simulations of finite structures are performed for direct comparison with experiments. Samples consisting of several basic cells are modeled which leads to a better correspondence to the experimental setup. Finite structures of different numbers of cells are modeled to study the influence of the sample size. The experimental and numerical results correspond very well and form a consistent picture of the problem. The multi-disciplinary approach leads to a comprehensive view of effects which govern the mechanical behaviour of the investigated cellular structures. RAPID PROTOTYPING OF CELLULAR MATERIALS Rapid Prototyping (RP) offers the possibility to fabricate cellular structures with defined internal and external geometry [1]. Furthermore, recently developed techniques enable the fabrication of complex structures with very small feature resolution. Microstereolithography for instance enables the user to fabricate parts with feature resolutions in the range of 5-10 µm [2, 3]. In the course of this work, RP techniques have been used to fabricate polymeric cellular structures whose mechanical properties (strength, stiffness) were investigated experimentally. Cellular structures exhibit multiple undercut features. The utilized process must be able to shape such features. In the course of this work, two RP processes were utilized: Stereolithography (SLA) and selective laser sintering (SLS) [4]. SLA offers excellent feature resolution. Problems might arise with structures which cannot be built without support. Due to the cellular structure of the fabricated parts, support structures cannot be removed mechanically. The unit cells of the
W8.8.2
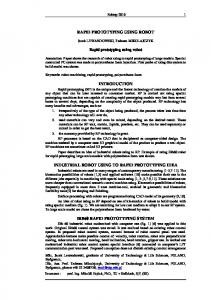
Translated simple cubic (tsc)
Body centered cubic (bcc)
Reinforced bcc (rbcc)
Simple cubic (sc)
Gibson−Ashby (G−A)
Figure 1: Unit cells of the investigated structures. structures used for this work (see Fig. 1) are manufacturable by SLA. SLS uses unsintered powder as support for overhanging features, therefore no limit regarding possible geometries has to be considered. Using the unit cells depicted in Fig. 1, cellular solids with 8x8x8 cells (cell size 4mm) were built and tested in uniaxial compression using a Zwick Z050/TH3A tensile testing machine. At least 4 specimens of each geometry and relative density were tested. A maximum strength versus stiffness plot of all tested specimens is shown in Fig. 2. This chart indicates a roughly linear dependence between strength and stiffness. For structures where the relative density varies, a similar relationship [5] is expected from theoretical considerations. Fig. 2 indicates that this relation is also true for varying architectures. NUMERICAL MODELING The adaptation of natural cellular materials to a given load pattern leads to higher performance, usually at the cost of a stronger directional dependence of the properties. In order to assess the directional sensitivity, the uniaxial stiffness for a number of cellular architectures has been calculated depending on the load direction. Several analytical and numerical approaches for characterizing the relation between the architecture of highly porous materials and its mechanical properties can be found in the
W8.8.3
100
Stiffness (MPa)
80
60
40
20
0
0
0,5
1
2 1,5 Strength (MPa)
2,5
3
Figure 2: Stiffness versus strength of the investigated cellular structures. Values are obtained from experimental tests. The error bars indicate the standard deviation. The correlation coefficient of the data shown in this diagram is 0.96. literature. Analytical models for the description of the relation between relative density and effective stiffness properties are given by Gibson and Ashby [5]. Numerical approaches based on tetrakaidecahedron unit cells [6, 7, 8] and hollow-sphere arrangements [9] are reported. In the present study the structure-property relations for the structures depicted in Fig. 1 will be investigated by numerical simulations. The aim is to understand the governing mechanisms and to compare the simulation results with the experimental data. Therefore, different modeling approaches are employed. For each structure a representative, space filling, three-dimensional, strut based unit cell is defined. For all numerical investigations linear elastic finite element analyses are carried out. The structures are modeled with higher order beam elements. The multiple appearance of ’material’ in vertices is considered approximately with respect to both the density and the stiffness. To capture the stiffening effect of the material concentration in the vertices a modified model with rigid beam elements within the vertices is developed. The directional and density dependence of the mechanical properties is evaluated by treating the structures as an infinite medium. Within this model homogenization via a ’periodic micro field approach’ is done. For better correspondence with the experimental setup, finite medium models, consisting of n × n × n base cells are created. With these models the influence of the free sample surfaces as well as details of the load initiation can be captured. NUMERICAL RESULTS In a first step, the entire elastic tensors for all structures and different relative densities in the range between 0.1 and 0.2 are evaluated with the unit cell model without correction of the stiffness in
W8.8.4
001-axis
011-axis
010-axis
0.07
SC BCC RBCC TSC GA
normalized Young’s modulus
0.06 0.05
0.04 0.03
0.02 0.01 0
10
20
30
40
50
o
60
70
80
90
orientation [ ] Figure 3: Directional dependency of the Young’s modulus normalized by the bulk Young’s modulus in 001-010 plane for different structures with relative density of 0.1. Table 1: Density exponent β for all structures and different directions. [001] [011] [111] SC 1.00 1.83 1.85 BCC 1.03 1.02 1.01 RBCC 1.01 1.02 1.02 G-A 1.98 1.74 1.76 the vertices. Fig. 3 shows the directional dependency of the Young’s modulus for all structures with a relative density of 0.1 in a principal plane. The correlation between the relative density ρ r and the effective Young’s modulus E ∗ can be represented by the relation: E ∗ = α ρβr .
(1)
The values for the density exponent β in three different directions of the structures are shown in Tab. 1. The results correspond well with the predictions made by [5], where it is shown, that the effective stiffness varies linearly with the relative density, as long as the structure has ’straight-through’ struts in load direction. In contrast, the effective stiffness varies with the second power of the relative density if bending is the governing mechanism. For the Gibson-Ashby (G-A), see Fig. 4, and simple cubic (SC) structures the values of β change with directions. This means that the governing mechanisms in these structures are direction dependent. Due to the disregarded higher stiffness in the vertices, the response of this model is too compliant for structures in which bending is the governing mechanism. For this reason the
W8.8.5
Figure 4: GA structure deformed under uniaxial compression in numerical simulation (top) and experiment (bottom). model with corrected stiffness is used exemplarily for the G-A structure, in which bending is the governing mechanism. Using the modified model, the value of β increases to 2.45 in the 001 direction. The influence of the free sample surfaces is evaluated with the finite sample models. By increasing the sample size, the free surface effects decrease and the values for the effective stiffness converge to the values of the infinite medium model. The finite sample models tend to be stiffer than infinite models. For a 9×9×9 structure the effective stiffness of the finite model is 10-20% higher than that of the infinite model. CONCLUSION Regarding the density exponent β, the numerical results for the infinite medium models are in good accordance with the predictions made by analytical models [5]. The mechanisms which govern the relation between relative density and uniaxial stiffness of the structure are identified. There is also good agreement between experimentally and numerically obtained stiffness values. Further investigations are necessary in the case of structures with high directional sensitivity (for instance SC and TSC, see Fig. 5) where differences between numerical and experimental results are observed. ACKNOWLEDGEMENT This work was financially supported by the Austrian Science Fund under contract P15852.
W8.8.6
0.045 0.040 0.035
spec. Stiffness
0.030 Modelling
0.025
SLS 0.020
SLA
0.015 0.010 0.005 0.000 SC
TSC
BCC
RBCC
GA
Figure 5: Specific stiffness obtained from numerical modeling (left bar), SLS structures (middle bar) and SLA structures (right bar). The error bars indicate the standard deviation.
References [1] D.W. Hutmacher. J. Biomaterials Science - polymer edition, 12 (2001), 107-124. [2] A. Bertsch, S. Zissi, J.Y. Jezequel, S. Corbel, and J.C. Andr´e. Microsystem Technologies, 3(2), 1997, 42-47. [3] T. Nakamoto, K. Yamaguchi, P.A. Abraha, and K. Mishima. J. Micromech. Microeng., 6 (1996), 240-253. [4] A. Woesz, J. Stampfl, and P.Fratzl. Adv. Eng. Mat., 6 (2004), 134-138. [5] L.J. Gibson, M.F. Ashby. Cellular Solids: Structure and properties, second ed. Cambridge University Press, 1997. [6] Y.W. Kwon, R.E. Cooke, and C. Park. J. Mat. Sci. and Eng., A343, 2003, 63-70. [7] H.X. Zhu, J.F. Knott, and N.J. Mills. J. Mech. Solids., 45 (1997), 319-343. [8] R.M. Christensen. Int. J. Solids Struct., 37 (2000), 93-104. [9] W.S. Sanders, and L.J. Gibson. J. Mat. Sci. and Eng., A352, 2003, 150-161.