PSD gives better discrimination between genetically hard and soft classes than either ...... crush profile features with CPSD21 offer the best classification ac-.
Relationship Between Single Wheat Kernel Particle-Size Distribution and Perten SKCS 4100 Hardness Index T. Pearson,1,2 J. Wilson,1 J. Gwirtz,3 E. Maghirang,1 F. Dowell,1 P. McCluskey,4 and S. Bean1 ABSTRACT
Cereal Chem. 84(6):567–575
The Perten Single Kernel Characterization system is the current reference method for determination of single wheat kernel texture. However, the SKCS 4100 calibration method is based on bulk samples. The objective of this research was to develop a single-kernel hardness reference based on single-kernel particle-size distributions (PSD). A total of 473 kernels, drawn from eight different classes, was studied. Material from single kernels that had been crushed on the SKCS 4100 system was collected, milled, then the PSD of each ground single kernel was measured. Wheat kernels from soft and hard classes with similar SKCS hard-
ness indices (HI 40–60) typically had a PSD that was expected from their genetic class. That is, soft kernels tended to have more particles at 373 μm was observed. Particles >373 μm are likely to be removed by sieving during commercial milling operations anyway. As such, the PSD >373 μm was removed and the percentages of the PSD were recomputed using the sum of all the PSD percentages 21 μm (CPSD21). This PSD value explains >99% of the variance of the principal component. Given that CPSD21 is more intuitive and simpler to use than the principal component, this was the PSD feature chosen as the new reference for single kernel hardness. Crush force histograms, discrete Fourier transforms of the raw crush force profile, normalized crush profiles, spectrograms of the crush profile, and crush profile models using the summation of
three Gaussians were used to build regression equations to estimate the cumulative PSD at 21 μm. Fourier transforms, histograms, spectrograms, and Gaussian modeling did not improve the calibrations over what could be accomplished with the SKCS low level parameters and normalized crush profiles (data not shown). Thus, only the low level parameters that the SKCS already generated and normalized crush force profiles were used. The raw crush profiles were normalized so that they all had the same length (128 data points) and were divided by the dry weight of the kernel. This normalized the higher forces required to crush larger kernels and adjusted for the softening effect of higher moisture contents. The particle-size estimate developed by Williams et al (1998) was applied to this data and the estimate was used as a potential feature. This particle-size estimate used SKCS parameters to estimate the particle-size index of whole wheat flour passed through a 75-μm sieve. The SKCS parameters used for this estimate were: 1) peak force of the raw crush profile; 2) XCON (logarithm of the ratio of force and conductance computed at the time of maximum force); 3) ln(temperature), (temperature is taken of the crescent 9 by a thermocouple); 4) gompB (a modeling parameter related to the shape of the histogram of crush profile slope values); 5) (kernel weight)2; 6) Dy fraction 25–30 (area under crush profile slope histogram 25–30); 7) (crush area × XCON)1/2 where crush area is the area under the raw crush profile. In addition, all SKCS low level data were used (Martin et al 1993) including logarithms, square roots, squared values, and some cross products of weight, moisture, peak force, conductance, and crush area, as well as crush profile slope histogram fractions (Dy fractions). Stepwise regression was used to select a small subset of features best able to estimate CPSD21. Variable selection and regression model calibrations were performed on a training set that consisted of a random selection of half the data. The regression model was tested on a validation set that contained the other half of the data. The selection method was based on adding or deleting variables from the model that resulted in the largest reduction of mean square error of prediction (MSE). After prediction of CPSD21, this feature and other SKCS features were used to develop classification models to discriminate genetically hard kernels from soft kernels. Stepwise Discriminant analysis was used as the feature selection and classification method.
Fig. 1. Hand-cranked mill used to further process kernels after crushing in the SKCS 4100 system. Vol. 84, No. 6, 2007
569
RESULTS AND DISCUSSION Average PSD and average cumulative PSD for each wheat class are shown in Figs. 2 and 3, respectively. These have the characteristics of hard and soft wheat as reported by Harland (1994). The soft kernels generally have a higher percentage of small particles 10 μm.
This indicates that, even though the compression forces required to crush these kernels may be similar, as indicated by HI, the genetically hard and soft kernel fragments are different, as indicated by CPSD21. The CPSD21 measurement does differ considerably from the 75-μm sieve, which is used in Approved Method 55-30 (AACC International 2000) for determining wheat hardness. However, cumulative PSD values at 75 μm do not discriminate genetic classes nearly as well as CPSD21 does. Using the cumulative distribution at 75 μm to classify kernels into genetic classes, a classification error rate of 15.6% was achieved (data not shown). In contrast, using CPSD21 to classify kernels achieved an error rate of 9.3%. As can be seen from Fig. 2, hard kernels begin to have more particles than soft kernels above ≈45 μm. If cumulative PSD values >45 μm are used, then the discrimination between the hard
Fig. 3. Average cumulative particle-size distribution for each wheat class. Average hardness index and CPSD21 values are listed after each class in the legend.
Fig. 4. Scatter plot of SKCS hardness and actual cumulative PSD value at 21 μm. Note that the soft kernels have larger CPSD21 values, this trend holds even at hardness values of 40–60, where there are data points from both hardness classes. 570
CEREAL CHEMISTRY
TABLE II Mean Moisture, Weight, and SKCS Hardness Index for All Cultivars Studied Moisture Sample Descriptiona
Mean
Weight SD
Mean
SKCS HI SD
Mean
SD
Hard cultivars Arapahoe (NIST) Blanca Grande (WWQL) Blanca Grande (USW) Hard Alpowa (WWQL) ID377S (WWQL) Klasic (WWQL) Len (NIST) Newton (NIST) Platte (USW) Tam 105 (NIST) Trego (USW) Yecora Rojo (NIST) Average
9.2 8.9 9.2 9.6 9.2 9.9 10.2 10.0 9.6 9.3 9.6 9.7 9.5
0.9 1.4 1.3 1.0 1.3 1.4 1.1 1.0 1.0 1.5 0.9 0.7 1.1
46.0 42.0 47.5 50.1 46.1 47.7 39.2 35.6 36.3 33.3 37.4 57.8 43.3
5.3 6.1 7.9 5.2 4.0 6.1 3.9 4.3 4.8 3.8 6.1 6.7 5.4
57.2 50.4 60.2 56.1 68.4 51.1 73.5 66.0 62.6 69.8 61.3 49.4 60.5
13.8 11.5 14.9 8.9 14.0 10.6 10.4 13.4 14.3 10.6 14.8 11.1 12.4
Soft cultivars Alpowa (USW) Brundage (USW #1) Brundage (USW #2) Cardinal (NIST) Eltan (USW) Madsen (WWQL) Madsen (NIST) Madsen (USW #1) Madsen (USW #2) Malcolm (NIST) Titan (NIST) Tres (NIST) (Club) Average
9.9 10.5 10.6 10.7 9.7 8.7 10.0 10.1 10.2 10.5 9.9 10.9 10.1
1.1 1.3 0.9 1.1 1.7 1.3 1.0 1.4 1.4 0.9 1.1 0.9 1.2
33.6 39.3 48.3 48.0 33.2 39.3 51.3 43.9 42.6 56.5 40.9 45.4 43.5
4.6 5.0 8.3 7.4 5.5 4.0 7.6 7.2 5.9 7.9 6.6 5.6 6.3
24.0 18.3 23.7 20.4 28.6 47.3 27.4 36.6 21.6 22.9 10.9 34.7 26.4
12.7 13.7 10.1 14.3 12.0 11.3 14.4 11.1 11.0 7.9 11.3 9.7 11.6
a
USW, U.S. wheats, Portland, OR; WWQL, Western Wheat Quality Lab, Pullman, WA; WSCIA, Washington State Crop Improvement Association, Pullman, WA; NIST, National Institue of Standards, Gaithersburg, MD.
TABLE III Classification Performance for Each Cultivar Using SKCS Hardness and by Cumulative Single-Kernel Particle-Size Distributions (PSD) at 21 μma HI Class No. of Kernels
CPSD21 Class No. of Kernels
Sample Descriptionb
Hard
Soft
Hard cultivars Arapahoe (NIST) Blanca Grande (WWQL) Blanca Grande (USW) Hard Alpowa (WWQL) ID377S (WWQL) Klasic (WWQL) Len (NIST) Newton (NIST) Platte (USW) Tam 105 (NIST) Trego (USW) Yecora Rojo (NIST) Average of all hard cultivars
16 13 17 18 18 14 20 19 17 20 17 15 85.4%
4 7 3 2 2 6 0 1 3 0 2 5 14.6%
20 15 17 20 20 17 20 17 20 20 18 20 93.7%
Soft cultivars Alpowa (USW) Brundage (USW #1) Brundage (USW #2) Cardinal (NIST) Eltan (USW) Madsen (WWQL) Madsen (NIST) Madsen (USW #1) Madsen (USW #2) Malcolm (NIST) Titan (NIST) Tres (NIST) (club) Average of all soft cultivars
1 0 1 1 2 10 3 2 0 0 0 2 9.4%
19 20 19 18 17 10 17 16 19 20 20 17 90.6%
0 0 2 0 0 11 8 6 1 2 0 4 14.5%
a b
Hard
Soft
CPSD21 Mean
SD
0 5 3 0 0 3 0 3 0 0 1 0 6.3%
6.4 10.1 7.5 7.6 5.1 9.8 4.6 8.2 6.4 6.5 7.8 5.8 7.1
1.7 1.9 3.1 1.5 1.1 1.7 1.3 2.4 1.7 1.4 2.0 1.3 1.8
20 20 18 19 19 9 12 12 18 18 20 15 85.5%
19.3 19.7 16.2 15.4 19.4 10.9 12.7 12.7 15.9 14.7 18.2 14.3 15.8
1.7 4.2 3.2 2.1 4.4 3.2 2.3 2.2 3.6 3.5 3.0 2.7 3.0
Kernels classed as soft had HI < 46 or CPSD21 > 11.5. USW, U.S. wheats, Portland, OR; WWQL, Western Wheat Quality Lab, Pullman, WA; WSCIA, Washington State Crop Improvement Association, Pullman, WA; NIST, National Institue of Standards, Gaithersburg, MD. Source of each sample is shown in parentheses. Vol. 84, No. 6, 2007
571
and soft kernels will obviously be reduced. Kernels with CPSD21 values ≤11.5 were considered hard, while kernels with greater CPSD21 values were classed as soft. The cutoff of 11.5 was chosen because this is where the value of zero intersected the correlation line between the PSD principal component and CPSD21. Table II compares the classification accuracies using SKCS HI and CPSD21 for each cultivar studied. As shown in Table III, the Madsen sample from the WWQL had the highest classification error rate when using SKCS HI. The mean of CPSD21 for the WWQL Madsen sample was 10.9,
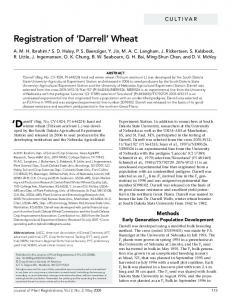
Fig. 5. Capillary electrophoresis separations of gliadins from four Madsen samples: a) USW #1, b) USW #2, c) NIST, and d) WWQL.
indicating that the PSD data for at least half of these kernels was more similar to hard kernels. As shown in Table II, the moisture of the Madsen WWQL sample was substantially lower than other samples studied. While the very low moisture (such as 8.7%) could have increased the HI, it should not have changed its PSD. Analysis of gliadins from the four Madsen samples showed the WWQL sample had a different pattern than did the other Madsen samples (Fig. 5d). The most obvious difference was in the latemigrating ω-gliadins (4–5 min), but other minor differences were noted in the α/β-gliadins (1.5–3 min). Madsen USW #2 (Fig. 5b) also had slight differences in the α/β region compared with the USW #1 and NIST samples (Fig. 5a and c, respectively). Gliadin fingerprinting is an accepted technique for identifying and differentiating wheat cultivars and CE has been used to successfully differentiate wheat cultivars from all classes of wheat (Bean and Lookhart 2000). Thus, differences in the CE patterns of the Madsen samples indicated that the USW #2 and WWQL were biotypes of Madsen or were contaminated with other wheat cultivars. As a result of the CE investigation and low moisture content of the Madsen WWQL sample, data from the Madsen WWQL sample was not included in any further analysis or calibration. Among the hard kernel cultivars, the Blanca Grande sample from WWQL had the highest classification error rate, with seven of the 20 kernels being classified as soft by HI and five classified as soft by CPSD21. Thus, the HI is classifying these kernels based on physical properties that do not agree with genetic class. Also, the Klasic sample had six kernels classified as soft by the SKCS, while the PSD indicates that only three should be classed as soft. The NIST Yecora Rojo sample is another example where the SKCS and PSD do not match. Yecora Rojo are large kernels (Table II) and perhaps the SKCS over-compensates for large kernels when computing hardness. Stepwise feature selection was applied to select SKCS features that were best able to estimate CPSD21. The stepwise procedure selected eight features as listed in Table IV. Multiple regression was used with these eight features to estimate CPSD21 from the single kernel cumulative PSD. A scatterplot of predicted and actual CPSD21 is shown in Fig. 6. The validation set had R2 = 0.73 and MSE = 9 2.98. As seen in Table IV, the independent variable gompB was the most significant variable contributing to the regression model. This variable describes the histogram of slope values computed from the raw SKCS crush profile (Martin et al 1993). This indicates that large and small changes in crush force are important
2
Fig. 6. Scatter plot of predicted and actual CPSD21 values, validation set only. R = 0.73 and MSE = 2.98 between actual and predicted values. 572
CEREAL CHEMISTRY
factors in predicting CPSD21. It is well recognized that the more abrupt fracturing of the hard kernels causes an increased count of large and moderate slope values in the crush profile (Martin et al 1993). Classification into Genetic Hardness Class by Discriminant Analysis Discriminant analysis was used to classify kernels into genetic hardness class (soft or hard) based on various PSD and SKCS features. The stepwise selection showed that Predicted CPSD21, weight2, and points 32 and 75 of the normalized crush profile as the best subset of features for classifying kernels as hard or soft. As summarized in the Table V, using a combination of predicted CPSD21 with low level SKCS features, the classification errors can be reduced by ≈50% when compared with classifications using HI alone. From Table V, it appears that predicted CPSD21 is a slightly better feature for classifying kernels into genetic hardness classes than the PSI estimate using SKCS features (Williams et al 1998). The PSI estimate from William et al (1998) used a 75-μm sieve according to Approved Method 55-30 (AACC International 2000). However, as discussed earlier, use of the cumulative PSD at 75 μm will decrease classification accuracy, as the harder kernels begin to have more particles at >40 μm. While the cumulative
TABLE IV Selected SKCS Variables for Estimating CPSD21 in the Order Selected and Contribution to Model R2 and MSE Variable 9
gompB Crush point 76 ln(weight) 1/2 (Crush area) Location of peak force Crush point 114 Crush point 86 Crush point 37
Model R2
MSE
0.53 0.60 0.64 0.69 0.72 0.73 0.74 0.75
3.83 3.56 3.36 3.12 3.00 2.95 2.91 2.87
PSD value at 75 μm and the PSI after passing flour through a 75μm sieve are quite different measures, these data suggest that the 75-μm sieve may not be optimal for discriminating hard and soft wheat classes. Also, as discussed earlier, a combination of SKCS crush profile features with CPSD21 offer the best classification accuracies than either feature type alone. Table VI shows the classifications made for each subclass when 2 using predicted CPSD21, weight , and points 32 and 75 of the normalized crush profile, and compares these classifications when using HI alone. Comparing the classifications made using predicted PSD and raw crush profile parameters with those made with HI alone, it is evident that the four combined features increase classification accuracies compared with HI alone for club, HRS, HWS, SWS, and SWW, while there is little improvement for HRW, HWW, and SRW. Thus, even though HWW was not included in the original calibration of the SKCS, the additional methods used in this study do not greatly improve classification accuracy of HWW. However, classification accuracy for SWS and SWW are improved so that samples containing soft white and hard white classes may be better identified. Figure 7 displays average normalized crush profiles of the different hardness classes. During crushing of a single kernel, a force is exerted until the kernel first fractures. This is displayed between points 1 and 15 of the crush profiles (Fig. 7). However, it is likely that the soft kernels break down into smaller particles during this initial kernel fracture. Between points 15 and 40, the kernel fragments undergo further crushing as the gap between rotor and crescent of the SKCS decreases; however, this requires less force than the initial fracturing. After point 40, small fragments are slowly broken down until they exit the rotor/crescent. In the region between point 40 and the rotor/crescent exit, the hard classes increase the crush force at a faster rate, leading to a higher and broader peak. This is likely caused by more moderately sized particles remaining from the hard classes. In contrast, the small particles from soft classes do not require as much crush force to break down, leading to a lower peak overall and, in particular, lower forces between points 65 and 90 that lead up to the peak, as
TABLE V Comparison of Classification Accuracies Using Various SKCS and PSD Parameters Classification Accuracies Training Set
Validation Set
Avg of Training and Validation Sets
Independent Variables
Hard
Soft
Hard
Soft
Hard
Soft
SKCS Hardness Index (HI) Actual CPSD21 SKCS cumulative PSI estimate (Williams et al 1998) CPSD21 HI + CPSD21 Predicted CPSD21 + weight2, and points 32 and 75 of the normalized crush profile HI + actual CPSD21
90% 87% 88% 93% 91% 93% 96%
90% 93% 89% 86% 93% 94% 95%
89% 97% 89% 94% 94% 95% 98%
92% 90% 92% 94% 93% 97% 94%
90% 95% 88% 93% 93% 95% 97%
91% 89% 91% 90% 92% 96% 95%
TABLE VI Classifications Using Predicted CPSD21, Weight2, and Points 32 and 75 of the Normalized Crush Profile and Hardness Index Alonea Classification Based on Predicted PSD and SKCS Crush Profile Features Wheat Class
Hard
Soft
Club Hard red spring Hard red winter Hard white spring Hard white winter Soft red winter Soft white spring Soft white winter
0% 98% 93% 94% 92% 3% 0% 6%
100% 3% 7% 6% 8% 97% 100% 94%
a
Classification Based on HI Alone Hard
Soft
21% 90% 93% 86% 92% 3% 5% 10%
79% 10% 7% 14% 8% 97% 95% 90%
Total Kernels 19 40 60 100 59 39 20 136
Results organized by class and include both the training and validation sets. Vol. 84, No. 6, 2007
573
CONCLUSIONS
Fig. 7. Average normalized crush profiles for all wheat classes studied. Note that the hard wheat classes have higher values at the beginning of the last peak, whereas the soft classes have a lower slope leading up to the last peak. Vertical lines denote points 32 and 75 selected to better discriminate between hard and soft classes.
shown in Fig. 7. For predicting CPSD21, points 37, 76, 86, and 114 of the crush profile were chosen by the stepwise regression procedure. Additionally, for classifying soft and hard wheat classes, points 32 and 75 of the normalized crush profiles were chosen. Points 30 through 100 lie in the portion of the crush profile where the smaller particles are crushed. This region of the crush profile may be the most significant for discriminating soft and hard classes because it is working with kernel fragments rather than the whole kernel, as is the case at the beginning of the crush profile. As the whole kernel is being compressed, it may be subject to variations due to kernel orientation and morphology. In contrast, in the middle of the crush profile leading up to the final peak, the smaller kernel pieces may be more immune to variance caused by kernel orientation and shape. The experimentation and data presented lay the groundwork for a single kernel calibration of the Perten SKCS 4100 based on PSD rather than the current method of assigning hardness values to the NIST set. A future calibration would need to comprise a larger data set consisting of a controlled range of kernel moisture contents. Additionally, the method may be more repeatable if the mill rolls were powered by a motor rather than a hand crank to maintain more consistent roll speeds. Another source of error could be the presence of large bran material still present after milling. It is unknown what effect this has on the resulting PSD. If large bran particles remain in the PSD, the profiles will fluctuate widely with respect to the volume percent in the 1,000– 2,000 μm size ranges. These bran particles vary in size and cannot be broken up with sonication in the laser diffraction instrument. This may be eliminated by sieving the material before measuring PSD by laser diffraction. It is unknown what effect large bran pieces may have on the SKCS. Another source of error that is harder to control is the loss of material in the SKCS and through milling. Samples that did not have at least 90% recovery were excluded. Approximately 5% of samples had