1 Grain Marketing and Production Research Center, ARS, USDA, Manhattan, KS. 66502. Mention of a ... printed with customary crediting of the source. American ...
Single Wheat Kernel Color Classification by Using Near-Infrared Reflectance Spectra D. Wang,1 F. E. Dowell,1,2 and R. E. Lacey3 ABSTRACT
Cereal Chem. 76(1):30-33
An optical radiation measurement system, which measured reflectance spectra, log (1/R), from 400 to 2,000 nm, was used to quantify single wheat kernel color. Six classes of wheat samples were used for this study, including red wheat that appears white and white wheat that appears red. Partial least squares regression and multiple linear regression were used to develop classification models with three wavelength regions, 500–750, 500–1,700, and 750–1,900 nm, and three data pretreatments, log (1/R),
first derivative, and second derivative. For partial least squares models, the highest classification accuracy was 98.5% with the wavelength region of 500–1,700 nm. The log (1/R) and the first derivative yielded higher classification accuracy than the second derivative. For multiple linear regression models, the highest classification accuracy was 98.1% obtained from log (1/R) spectra from the visible and near-infrared wavelength regions.
The color of wheat kernels, which varies from light yellow to red brown, is influenced by the presence of red pigmentation in the seed coat and by growing conditions. In a true-breeding cultivar color does not vary and, thus, wheats can be consistently classified as red or white (Evars and Bechtel 1988). These two basic colors are commonly considered in the classification of wheat for grading purposes. Red wheat and white wheat have different milling, baking, and taste properties and different visual characteristics (Paulsen and Heyne 1981, DePauw and McCaig 1988, Bason et al 1995, Dowell 1997). In the world markets, a premium may be paid for a particular color class on the basis of nutritional and end-use values (Bason et al 1995, Ronalds and Blakeney 1995). The red seed coat in hexaploid wheat is controlled by three separate genetic loci (R-A1, R-B1, and R-D1), and thus color can vary among red cultivars (Metzger and Sibaugh 1970, Freed et al 1976, Anonymous 1995). Baker (1981) indicated that various combinations of red genes impart different shades of red to the genotypes. Flintham (1993) reported that the degree of red pigmentation increased with the number of red genes (one to three). Thus, the number of genes can make some light red cultivars and single red gene wheats difficult to distinguish from white wheat. In addition to genetics, rain damage, which can “bleach” red wheat, soil conditions, disease, and insect damage frequently cause variations within each color class and affect the visual appearance of the kernel. Therefore, red and white wheats are not always visually distinguishable. Currently, personnel of the U.S. Department of Agriculture’s Grain Inspection, Packers, and Stockyards Administration (GIPSA) visually examine wheat samples to determine kernel color. Each inspector may use slightly different criteria to distinguish red wheats from white wheats. This subjective method can result in unreliable classification when the threshold between red and white is not distinct. When misclassified, wheats from different color classes may get mixed, resulting in lots of lower quality and value than the pure lots. Several methods to measure wheat color have been studied. Kernels can be soaked in a solution of sodium hydroxide (NaOH)
to assist inspectors in determining color class. Genetically red kernels tend to turn red after soaking, whereas genetically white kernels tend to turn light cream in color (Quartley and Wellington 1962, Kimber 1971, DePauw and McCaig 1988, Dowell 1997). Chen et al (1972) converted perceived color of wheat to a point in a three-dimensional color space by using a colorimeter. Other methods quantify kernel color by measuring reflectance at many different wavelengths (Massie and Norris 1965; Hawk et al 1970; McCaig et al 1992, 1993; Ronalds and Blakeney 1995; Delwiche and Massie 1996). Typically, these researchers measured the color of bulk samples and did not include kernels that were not obviously red or white. Quantifying the color of individual kernels is necessary to determine whether a bulk sample has a mixture of red and white wheat classes. Thus, some means of measuring single kernel color, including kernels that are not clearly red or white, is needed. The objectives of this research were to: 1) identify genetically red and white wheat varieties on the basis of spectral characteristics, and 2) determine the wavelengths that contribute to wheat color classification.
1 Grain
Marketing and Production Research Center, ARS, USDA, Manhattan, KS 66502. Mention of a trademark or proprietary product does not constitute a guarantee or warranty of the product by the U.S. Department of Agriculture and does not imply its approval to the exclusion of other products that also may be suitable. 2 Corresponding author. Phone: 785/776-2753. Fax: 785/776-2792. E-mail: fdowell@ usgmrl.ksu.edu 3 Agricultural Engineering Department, Texas A&M University, College Station, TX 77843-2117. Publication no. C-1999-0105-01R. This article is in the public domain and not copyrightable. It may be freely reprinted with customary crediting of the source. American Association of Cereal Chemists, Inc., 1999.
30
CEREAL CHEMISTRY
MATERIALS AND METHODS Six U.S. market classes of wheat, hard red spring, hard red winter, soft red winter, hard white wheat, soft white wheat, and durum, were supplied by USDA GIPSA (Kansas City, MO). Each class was represented by six or seven cultivars. Twenty-five kernels were randomly selected from each cultivar for a total of 150 or 175 kernels per class. In addition, 200 kernels were selected from wheats determined to be difficult-to-classify as red or white by USDA GIPSA. Most durum wheat in the United States is genetically white. Red durum wheat is grown to a very limited extent for feed purpose only. Therefore, only white durum wheats were used in this research. Samples originated from the 1993– 1995 crop years and are described by Wang et al (in press). All samples were stored at ambient temperature in air-tight containers. Single wheat kernel reflectance spectra from 400 to 2,000 nm at 2-nm intervals were collected with an optical radiation measurement system, which was described by Wang et al (in press). However, only wavelengths within the 500-1,900 nm range were used because poor sensor sensitivity and low energy levels resulted in excessive noise outside this range. Thus, the wavelength regions 500–750, 500–1,700, and 750–1,900 nm were used to determine single wheat kernel color class. Data were analyzed by partial least squares (PLS) regression (Galactic Industries, Salem, NH) and multiple linear regression (MLR) (SAS Institute, Cary, NC). Twoclass classification models were developed to determine genetically red and white wheat kernels. The wheat samples were first separated into calibration and testing sets. The calibration set contained 450 randomly selected kernels with an equal number of red
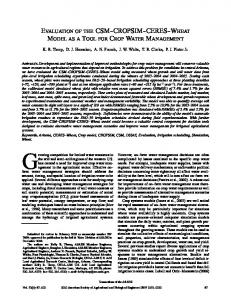
and white wheats. The testing set contained 675 kernels including 350 red kernels and 325 white kernels. Red and white kernels were assigned constant values of 1.0 and 2.0, respectively. A kernel was considered to be correctly categorized if the predicted value lay on the same side of the midpoint of assigned values. Analyses were conducted on the absorbance spectra, log (1/R), and on the first and second derivatives of the absorbance spectra (Wang et al, in press). For PLS, the model performance is reported as the multiple coefficient of determination (r 2 ) and standard error of cross validation (SECV) of each calibration. The number of factors used for PLS models is the minimum required to give the maximum r 2 value. For MLR, the STEPWISE method and the RSQUARE method were used. The STEPWISE method was used to reduce independent variables (wavelengths). After the STEPWISE process, the RSQUARE method was used to find a model consisting of independent variables that predict color classification with the highest r 2 value. RESULTS AND DISCUSSION Color Classification by PLS Calibration equation statistics of PLS models and calibration accuracies of the calibration sample set are summarized in Table I. Among the wavelength regions, the 500–1,700 nm region tended to give the best results. In this wavelength region, r2 values ranged from 0.83 to 0.85 for three different data pretreatments. Also, the SECV ranged from 0.19 to 0.21 for three different data pretreatments. The average classification accuracy of the calibration sample set in this region was the highest: 99.8, 98.9, and 98.4% for the log (1/R), first derivative, and second derivatives, respectively. The testing sample set gave similar results. These results indicate that the wavelength region for wheat color classification should not be limited to the visible region (400–700 nm), which is supported by the plots of the weight of PLS factors for log (1/R) (Fig. 1). The first and second factors had a strong feature band at ≈500 nm, which indicates that the wavelength region at ≈500 nm is the most important for wheat kernel color classification. For the second factor, the greatest weights occurred at 1,360, 1,660, and 1,860 nm. For the third factor, a strong feature band occurred at 700–1,350 nm and the greatest weights occurred at 1,460 and 1,930 nm. Those bands and wavelengths with high weight indicate that some wavelength regions in the near-infrared (NIR) region can be used for wheat kernel color classification. However, the lowest r 2 values, the
lowest classification accuracy, and the highest SECV generally occurred with models developed with only the NIR region (750– 1,900 nm). Among the data pretreatments, the r 2 value for log (1/R) (r 2 = 0.82) and the first derivative (r 2 = 0.82) was significantly higher (P < 0.05) than that of the second derivative (r 2 = 0.69) in the wavelength regions of 500–750 nm. Similar results were seen in the 500–1,700 nm region. Also, as the level of pretreatment, from log (1/R) to the second derivative, became more complex, the number of PLS factors necessary to maintain values for r2 and SECV, compared with those of less complex pretreatments, increased. Also, more PLS factors were needed for the longer wavelength region (500– 1,700 nm) and the NIR region (750–1,900 nm) than for the visible region (500–750 nm). More factors are likely needed because additional wavelengths are included in the longer-wavelength models. The performances of PLS classification models on the testing sample set are also summarized in Table I. The testing samples include both obvious and difficult-to-classify kernels. The highest classification accuracy (98.5%) was obtained from the first derivative in the wavelength region of 500–1,700 nm. Most misclassified kernels belonged to the difficult-to-classify category. This result compares favorably with the result achieved by Delwiche and
Fig. 1. Important wavelength regions for single wheat kernel color classification as shown by the weight of the first three partial least squares factors.
TABLE I Calibration Equation Statistics and Testing Results of Partial Least Squares Models for Single Wheat Kernel Color Classification Calibration Equation Statisticsa Pretreatment Region (nm) log(1/R) 500–750 500–1,700 750–1,900 First derivative 500–750 500–1,700 750–1,900 Second derivative 500–750 500–1,700 750–1,900
Factorsc
r2
Testing Resultsb
Accuracy (%)
SECVd
n1
n2
Accuracy (%)
SEPe
3 8 13
0.82a f 0.85b 0.78c
98.2 99.8 96.0
0.212 0.191 0.237
475 (3)g 475 (2) 475 (9)
200 (13) 200 (9) 200 (12)
97.6 98.4 96.9
0.30 0.29 0.34
4 7 13
0.82a 0.85b 0.78c
98.4 98.9 96.0
0.214 0.196 0.237
475 (3) 475 (2) 475 (18)
200 (8) 200 (8) 200 (11)
98.4 98.5 95.7
0.31 0.30 0.33
11 16 16
0.69a 0.83b 0.79c
93.1 98.4 96.7
0.278 0.210 0.229
475 (18) 475 (11) 475 (17)
200 (23) 200 (9) 200 (10)
93.9 97.0 96.0
0.30 0.30 0.31
a
For the calibration sample set, red wheat (n = 225) includes hard red spring, hard red winter, and soft red winter; white wheat (n = 225) includes hard white, soft white, and durum. b For the testing sample set, n1 = number of obviously red and white kernels, 225, and 250, respectively; n2 = number of difficult-to-classify kernels, 125 and 75 for red and white, respectively. c Number of partial least squares factors. d Standard error of cross validation. e Standard error of prediction. f Values within a column followed by different letters are significantly different at P < 0.10. g Parentheses show number of kernels misclassified. Vol. 76, No. 1, 1999
31
Massie (1996), who correctly classified ≈98% of the obvious red and white kernels using a seven-factor PLS model over the visible region of 500–750 nm. The first derivative performed better on the testing samples in the visible region. For example, with log (1/R), the classification accuracy was 97.6%; when the first derivative was used, the classification accuracy increased to 98.4%. In each data pretreatment, the highest classification accuracy occurred in the wavelength region of 500–1,700 nm. The classification accuracy was lowest in the wavelength region of 750–1,900 nm, and the second derivative also yielded the lowest classification accuracy among different data pretreatments. However, even with the second derivative, a classification accuracy of 97% was achieved in the 500– 1,700 nm wavelength region. Although difficult-to-classify kernels are difficult to differentiate visually, wheat kernel color is controlled by three red genes, and the intrinsic properties related to red genes should be similar for each wheat color class. Also, the reflectance spectrum in the visible region represents mostly the surface properties of a measured object, while the reflectance spectrum in the NIR region represents both surface and internal properties of a measured object. It can be assumed that the spectral curve of each color class should be similar in shape and that the effect of visible color variation for each color class should be reduced in the NIR region. Therefore,
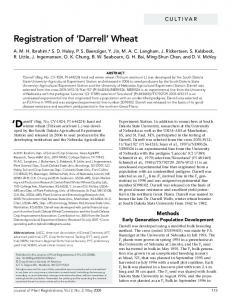
Fig. 2. Important wavelength regions for single wheat kernel color classi2 fication as shown by the coefficient of determination (r ) of single-term regression.
the accuracy of classifying difficult-to-classify kernels should be improved by using both the visible and NIR regions. Table I supports the observation that, generally, more kernels were correctly classified when NIR wavelengths were included. Color Classification by MLR Calibration equation statistics of six-term MLR models and classification accuracies of the calibration sample set are summarized in Table II. The wavelengths used in each MLR equation were those that produced the highest r2 and lowest SECV values for the calibra-
Fig. 3. Log (1/R) (top panel), first derivative (middle panel), and second derivative (bottom panel) absorption curves of tannin.
TABLE II Calibration Equation Statistics and Testing Results of Six-Term Multiple Linear Regression Models for Single Wheat Kernel Color Classification Calibration Equation Statisticsa Treatments Log(1/R) First derivative Second derivative
Wavelengths, nm (coefficients) 490 (3.257), 552 (−10.23), 918 (44.05), 1,050 (−54.78), 1,212 (19.90), 1,422 (−3.008), (2.834) 710 (402.80), 740 (321.60), 772 (341.73), 952 (−432.80), 1,082 (−387.26), 1,112 (−368.18), (2.669) 756 (−9599.9), 784 (−23949), 810 (−22596), 836 (−16508), 862 (−6650.3), 1,396 (−983.37), (2.768)
a
r2
Testing Resultsb Accuracy (%)
SECVc
n2
Accuracy (%)
SEP d
(2)f
200 (11)
98.1
0.30
n1
0.86ae
99.6
0.191
475
0.83b
98.7
0.209
475 (10)
200 (12)
96.7
0.31
0.80c
97.6
0.228
475 (11)
200 (21)
95.3
0.31
For the calibration sample set, red wheat (n = 225) includes hard red spring, hard red winter, and soft red winter; white wheat (n = 225) includes hard white, soft white, and durum. b For the testing sample set, n1 = number of obviously red and white kernels, 225 and 250, respectively; n2 = number of difficult-to-classify kernels, 125 and 75 for red and white, respectively. c Standard error of cross validation. d Standard error of prediction. e Values within a column followed by different letters are significantly different at P < 0.10. f Parentheses show number of kernels misclassified. 32
CEREAL CHEMISTRY
tion sample set. The wavelengths in MLR equations covered both the visible and NIR regions. The important wavelength regions and wavelengths for single wheat kernel color classification with high r 2 values are shown in Fig. 2. The wavelength region at ≈500 nm had the highest correlation with wheat kernel color. Correlation coefficients at 1,460 and 1,930 nm also indicate a difference between red and white wheats. While a complete interpretation of why these wavelengths were selected may not be possible, some insights can be drawn by considering published experiments of NIR absorbers. Additionally, the characteristic absorbance patterns of chemical compounds can be studied by preparing spectra of pure compounds. According to previous research (Miyamoto and Everson 1958, Pomeranz 1988), phlobaphene, a type of condensed tannin, was identified as the red pigment in the wheat seed coat. To find the wavelengths related to red pigment, the absorbance spectrum of tannin powder (C76H52O46; MW 1,701.21) (Eastman Kodak, Rochester, NY) was measured from 400 to 2,000 nm. The spectral curves of tannin with log (1/R), the first derivative, and the second derivative are shown in Fig. 3. Some wavelengths of the tannin with a strong absorption had a high correlation with wheat kernel color class. For log (1/R), wavelengths of 446, 452, and 668 nm had a strong correlation with wheat color class and yielded r2 values from 0.29 to 0.63 (data not shown) when single wavelengths were used in the single-term linear regression models. Other wavelengths such as 1,000, 1,130, 1,174, 1,390, 1,460, and 1,926 nm also were correlated with wheat color (r2 > 0.1). For the first derivative, the absorption band of the tannin at ≈678 nm had a strong correlation with wheat color (r2 = 0.76) when single-term linear regression was used. For the second derivative, the wavelengths at 644, 726, 836, and 1,396 nm were correlated with wheat color (r 2 > 0.2). If the wavelengths used in MLR equations were compared with the wavelengths of the tannin with a strong absorption, some wavelengths in MLR equations were related to the strong absorption wavelengths or bands of the tannin. Color classification wavelengths reported by Delwiche and Massie (1996) (576 and 804 nm) and Ronalds and Blakeney (1995) (490, 525–600, 680–730, 758, 836, and 970 nm) are similar to some reported in this research. However, previous researchers did not include durum in the white wheat class nor wavelengths >1,100 nm. If some wavelengths used in MLR equations are not related to the major constituents of wheat such as protein, moisture, oil, starch, and cellulose, then these wavelengths may represent an interaction between these major constituents or other constituents contributing to color classification. For log (1/R), the wavelengths 1,050, 1,212, and 1,422 nm (Table II) do not directly correspond to any of the broadly defined food constituents (protein, starch, oil, water, and cellulose), and therefore those wavelengths may contribute to color classification (Murray and Williams 1990, Shenk et al 1992). For the first derivative, the 952, 1,082, and 1,112 nm wavelengths also do not directly correspond to any of the defined food constituents. The performance of MLR models on the testing sample set is also summarized in Table II. The highest classification accuracy of 98.1% was obtained from log (1/R). Among data pretreatments, calibration equations with the second derivative yielded the lowest classification accuracy. For color classification, log (1/R) is recommended. In summary, for PLS models, the highest testing set classification accuracy was 98.5% obtained from the first derivative in the wavelength region of 500–1,700 nm. Most of the misclassified kernels belonged to the difficult-to-classify kernel set. This result indicates that very high percentages of correct classification were achieved with obvious red and white kernels. The classification accuracy was the lowest when the wavelength region of 750– 1,900 nm was used, and the second derivative yielded the lowest classification accuracy at each data pretreatment. However, even with the second derivative, the classification accuracy of 97% was
achieved in the wavelength region of 500–1,700 nm. For MLR models, the best model with a testing set classification accuracy of 98.1% was obtained from log (1/R) in the wavelength region covered by both the visible and the NIR regions. LITERATURE CITED Anonymous. 1995. Annual Wheat Newsletter. Vol. 41:346-347. Kansas State University: Manhattan, KS. Baker, R. J. 1981. Inheritance of seed coat color in eight spring wheat cultivars. Can. J. Plant Sci. 61:719-721. Bason, M. L., Zounis, S., Ronalds, J. A., and Wrigley, C. W. 1995. Segregating red and white wheat visually and with a tristimulus colour meter. J. Agric. Res. 46:89-98. Chen, C. Y., Skarsaune, S. K., and Watson, C. A. 1972. Relation of kernel color to wheat class and grade. Cereal Sci. Today 17:340-343. Delwiche, S. R., and Massie, D. R. 1996. Classification of wheat by visible and near-infrared reflectance from single kernels. Cereal Chem. 73:399405. DePauw, R. M., and McCaig, T. N. 1988. Utilization of sodium hydroxide to assess kernel color and inheritance in eleven spring wheat varieties. Can. J. Plant Sci. 68:323-329. Dowell, F. E. 1997. Effect of NaOH on visible wavelength spectra of single wheat kernels and color classification efficiency. Cereal Chem. 74:617-620. Evars, A. D., and Bechtel, D. B. 1988. Microscopic structure of the wheat grain. Pages 47-92 in: Wheat Chemistry and Technology, Vol. 1. Y. Pomeranz, ed. Am. Assoc. Cereal Chem.: St. Paul, MN. Flintham, J. 1993. Grain color and sprout-resistance in wheat. Pages 3036 in: Pre-Harvest Sprouting in Cereals 1992. M. K. Walker-Simmons and J. L. Ried, eds. Am. Assoc. Cereal Chem.: St. Paul, MN. Freed, R. D., Everson, E. H., Ringlund, K., and Gullord, M. 1976. Seed coat color in wheat and the relationship to seed dormancy at maturity. Cereal Res. Comm. 4:147-149. Hawk, A. L., Kaufmann, H. H., and Watson, C. A. 1970. Reflectance characteristics of various grains. Cereal Sci. Today 15:381-384. Kimber, G. 1971. The inheritance of red grain colour in wheat. Pflanzenzuechtung 66:151-157. Massie, D. R., and Norris, K. H. 1965. Spectral reflectance and transmittance properties of grain in the visible and near infrared. Trans. ASAE 8:598-600. McCaig, T. N., McLeod, J. G., Clarke, J. M., and DePauw, R. M. 1992. Measurement of durum pigment with a near-infrared instrument operating in the visible range. Cereal Chem. 69:671-672. McCaig, T. N., DePauw, R. M., and Williams, P. C. 1993. Assessing seedcoat color in a wheat breeding program with a NIR/VIS instrument. Can. J. Plant. Sci. 73:175-182. Metzger, R. J., and Sibaugh, B. A. 1970. Location of genes for seed coat color in hexaploid wheat, Triticum aestivum L. Crop Sci. 10:495-496. Miyamoto, T., and Everson, E. H. 1958. Biochemical and physiological studies of wheat seed pigmentation. Agron. J. 50:733-734. Murray, I., and Williams, P. C. 1990. Chemical principles of near-infrared technology. Pages 17-34 in: Near-Infrared Technology in the Agricultural and Food Industries. P. Williams and K. Norris, eds. Am. Assoc. Cereal Chem.: St. Paul, MN. Paulsen, G. M., and Heyne, E. G. 1981. Development of hard white winter wheats for the Great Plains. Wheat Grower 4:26-28. Pomeranz, Y. 1988. Chemical composition of kernel structures. Pages 97158 in: Wheat Chemistry and Technology, Vol. 1. Y. Pomeranz, ed. Am. Assoc. Cereal Chem.: St. Paul, MN. Quartley, C. E., and Wellington, P. S. 1962. Biochemical tests for seed identification. J. Nat. Inst. Agric. Bot. 9:179-185. Ronalds, J. A., and Blakeney, A. B. 1995. Determination of grain color by near infrared reflectance and near infrared transmittance spectroscopy. Pages 149-153 in: Leaping Ahead with Near Infrared Spectroscopy. G. D. Batten, P. C. Flinn, L. A. Welsh, and A. B. Blakeney, eds. R. Aust. Chem. Inst.: Victoria, Australia. Shenk, J. S., Workman, J. J., and Westerhaus, M. O. 1992. Application of NIR spectroscopy to agricultural products. Pages 383-432 in: Handbook of Near-Infrared Analysis. D. A. Burns and E. W. Ciurczak, eds. Marcel Dekker: New York. Wang, D., Dowell, F. E., and Lacey, R. E. In press. Single wheat kernel color classification using neural networks. Trans. ASAE.
[Received May 19, 1998. Accepted September 24, 1998.] Vol. 76, No. 1, 1999
33