(QA) process in industry. Practitioners can effectively allo- cate their limited resources to high ranking APIs first. We demonstrate our technique Remi with an ...
REMI: Defect Prediction for Efficient API Testing Mijung Kim* , Jaechang Nam* , Jaehyuk Yeon† , Soonhwang Choi† , and Sunghun Kim* *
†
Department of Computer Science and Engineering
Software R&D Center ‡
The Hong Kong University of Science and Technology Hong Kong, China
{mjkimab,jcnam,hunkim}@cse.ust.hk
ABSTRACT Quality assurance for common APIs is important since the the reliability of APIs affects the quality of other systems using the APIs. Testing is a common practice to ensure the quality of APIs, but it is a challenging and laborious task especially for industrial projects. Due to a large number of APIs with tight time constraints and limited resources, it is hard to write enough test cases for all APIs. To address these challenges, we present a novel technique, Remi that predicts high risk APIs in terms of producing potential bugs. Remi allows developers to write more test cases for the high risk APIs. We evaluate Remi on a real-world industrial project, Tizen-wearable, and apply Remi to the API development process at Samsung Electronics. Our evaluation results show that Remi predicts the bug-prone APIs with reasonable accuracy (0.681 f-measure on average). The results also show that applying Remi to the Tizen-wearable development process increases the number of bugs detected, and reduces the resources required for executing test cases.
Categories and Subject Descriptors D.2.9 [Management]: Software Quality Assurance
Keywords Defect Prediction, API Testing, Quality Assurance
1.
INTRODUCTION
In modern software industry, it is common to develop and deploy APIs which implement common functionalities that can be used as a form of library for third-party systems. Therefore, it is important to ensure the reliability of these APIs while developing them in-house because any uncovered bugs in APIs will quickly become widespread among the third-party systems. ‡This work was supported by Samsung Electronics Software R&D Center.
Samsung Electronics CO., LTD Suwon, South Korea
{jaehyuk.yeon,soonhwang.choi}@samsung.com To ensure the reliability of APIs, testing is a common and important practice during API development processes. One of the common testing methodologies for APIs under development is to create a certain number of unit test cases for each API (e.g., two test cases for each API). However, this methodology is neither efficient nor effective especially in industrial projects because there are a large number of APIs and not every API is equally bug-prone. If we could identify high risk APIs, developers could test more on these high risk APIs. For example, API developers can elaborately allocate resources to detect more bugs more quickly from the high risk APIs. In this paper, we present a novel defect prediction technique called Remi (Risk Evaluation Method for Interface testing) that is targeted for testing APIs in the development process. Remi measures the risk of APIs in terms of producing potential bugs. Using a machine learning classifier, Random Forest, Remi builds a prediction model that predicts bug-proneness of APIs, and ranks the APIs with respect to the predicted buggy probability. The API ranks returned by Remi can be used during a quality assurance (QA) process in industry. Practitioners can effectively allocate their limited resources to high ranking APIs first. We demonstrate our technique Remi with an industrial API development project for Tizen-wearable, which has been actively developed by Samsung Electronics (Samsung). Our empirical evaluation measures the performance of the APIlevel defect prediction and the efficiency of the QA process for API testing at Samsung. The results of our evaluation show that the prediction accuracy of Remi is reasonable (0.681 f-measure on average). The results also show that applying Remi to the software development process increases the number of bugs detected and reduces the cost required for executing test cases. Overall, using our tool, Samsung has improved the effectiveness and the efficiency of the API testing process for Tizen-wearable. This paper makes the following contributions: • A novel approach to API-level defect prediction that is targeted for API testing. • An empirical evaluation to assess Remi. • Successfully applying Remi in an industrial API development project for efficient API testing.
2.
RELATED WORK
Defect Prediction on Industrial Projects: Software defect prediction has been applied in industrial projects for software quality assurance [3, 11, 12]. Ostrand et al. pre-
Table 1: Metrics in Remi. For a detailed description of each metric, refer to the metrics for C/C++ in https://scitools.com/feature/metrics and [10]. Type Code Metrics
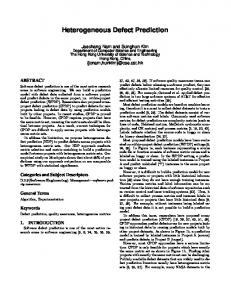
Figure 1:
Overview of our approach.
dicted the density of defects in two large software systems from AT&T [12]. They found that 20% of files with the highest predicted defect number actually detected 71% and 92% of defects [12]. Nagappan et al. predicted post-release defects in a binary file on five Microsoft products by using complexity metrics [11]. Engstr¨ om et al. proposed a regression-test-selection technique that selects test cases associated with those source code files that have been predicted to be bug-prone in the past and stored in a cache [3]. Lewis et al. applied two defect prediction approaches, FixCache and Rahman algorithms, to two Google projects [9] at the file-level and found that the defect prediction needs to be improved for the front-line developers. Unlike these techniques that work at a file-level granularity, Remi is designed for the practical use of defect prediction techniques at the API-level—our study shows that Remi can be effectively applied to the API development process in practice. API Testing on Industrial Projects: There are several existing techniques that assess the reliability of APIs used in industry by creating crash-inducing inputs for APIs [6, 7, 14]. Shelton et al. from Microsoft adopted an automatic testing framework, Ballista [8], and customized it to assess the robustness of Win32 APIs [14]. They used the exceptional values returned by Ballista as inputs for Win32 APIs. Similarly, Hoffman et al. investigated a way to generate domain-specific boundary values, and used them as crashinducing inputs for Java APIs used in two Java components developed by Bell labs [6]. Jorgensen et al. developed a technique for API testing by combining model-based testing and category partitioning, and conducted an empirical study on a Microsoft Windows application [7]. Unlike these techniques that create test inputs for APIs, Remi focuses on efficient resource allocation during the QA process.
3.
OUR APPROACH
Figure 1 depicts the overview of our approach. Remi has four inputs, the source code of the APIs, a software repository containing revision history, the function call graph for the source code of the APIs, and bug history associated with the APIs. Remi outputs a list of ranked APIs along with the buggy probability. Remi consists of five processing phases: collecting metrics, aggregating metrics at the API-level, labeling APIs, building a prediction model, and ranking the APIs. First, Remi collects two types of metrics at the functionlevel, the source code metrics and the development process metrics, to prepare for a data set used for the phase of aggregating metrics at the API-level. Because an API consists of a set of functions, Remi first collects the metrics for each function reachable from the API. Table 1 presents the metrics used in Remi. For source code metrics, Remi collects 28 metrics regarding McCabe’s Cyclomatic complexity, volume (e.g., lines of code), and object-oriented features (e.g.,
Process Metrics
Metrics AltCountLineBlank, AltCountLineCode, AltCountLineComment, CountInput,CountLine, CountLineBlank, CountLineCode, CountLineCodeDecl, CountLineCodeExe, CountLineComment, CountLineInactive, CountLinePreprocessor, CountOutput, CountPath, CountSemicolon, CountStmt, CountStmtDecl, CountStmtEmpty, CountStmtExe, Cyclomatic, CyclomaticModified, CyclomaticStrict, Essential, Knots, MaxEssentialKnots, MaxNesting, MinEssentialKnots, RatioCommentToCode numCommits, totalLocDeleted, avgLocDeleted, maxLocDeleted, totalLocAdded, avgLocAdded, maxLocAdded, totalLocChurn, avgLocChurn, maxLocChurn, totalDistinctAuthors, numFixes
coupling between object classes) [15]. Also, Remi collects 12 development process metrics from the source code repository such as the number of commits, the various measures of lines of deleted/added/changed code, and the number of previous fixes [10, 13]. Second, to predict defects at the API-level, Remi aggregates the metrics collected at the function-level to the APIlevel with respect to the calling context of an API. To acquire metrics at the API-level, Remi utilizes the function call graph for the source code of APIs, and summates the metric values associated with the functions within the calling context of an API. We choose to aggregate metrics in this way because in order to perform the prediction for the API instances, the metrics at the API-level need to take into account those metrics associated with the functions reachable from the API. Remi summates the metric values of the functions invoked in a various given call depth. For example, if the call depth given is 1, Remi summates the metrics up to the immediate children of each API in the call graph. Third, as the last step to prepare for the data set used to build the prediction model, Remi labels each API as buggy or clean. To do this, Remi uses bug fix history, which is a typical labeling method for defect prediction studies [10]. Specifically, we label APIs based on the existence of past bugs identified in previous release candidates (RC). There are two types of bug data that we use to identify bugs in previous RCs. First, we use the information from commit messages containing the fix-related keywords (e.g., fix or resolve) in the source code repository [10]. If there are any fix commits that make changes in functions within the calling context of an API, Remi labels the API as buggy. Second, we use history of the bugs identified by executing the test suite in the past. If at least one test failure associated with an API is recorded in the same period of collecting metrics, Remi labels such API as buggy, otherwise, as clean. Using these two types of past bug data, if an API is labeled as buggy by either fix commits or test results, we regard the API as buggy. Fourth, when the metrics at the API-level and labeled APIs are ready, Remi builds a prediction model using Random Forest [2]. Since defect prediction performance may vary based on various machine learners and project datasets, it is difficult to decide the best learner [4]. For APIs of Tizen-wearable, Random Forest leads to the best prediction performance in our repeated experiments1 . For this reason, 1
In our experiments, we used the Weka framework with the
Table 2: Results for RQ1. Representative prediction results of Tizen-wearable RC2. Packages Package 1 Package 2 Average
Depth 0 Precision
1.000 0.667 0.834
Depth All
Recall F-measure Precision
Recall F-measure
0.968 0.154 0.561
0.935 0.462 0.699
0.984 0.250 0.617
1.000 0.600 0.800
0.967 0.522 0.745
we use Random Forest for Remi in our empirical study. Finally, Remi ranks APIs with respect to the buggy probability of the prediction outcomes. Remi considers that APIs predicted at a higher buggy probability are likely to be more risky. This rank information is used by the QA team to decide which APIs need more testing effort.
4.
EVALUATION
To evaluate Remi, we investigate two research questions: • RQ1: How accurately can Remi predict buggy APIs? • RQ2: How useful is Remi for API testing in the actual API development process? To set up our experiments, we applied Remi to Tizenwearable, which is implemented in C/C++ at Samsung. Among the 56 functional packages containing approximately 3000 APIs found in Tizen-wearable, we applied Remi to 36 packages containing approximately 1100 APIs in which at least one bug exists or no build error occurs while releasing a release candidate (RC). We conducted the defect prediction in three consecutive RCs from RC2 to RC4 in which Remi builds a prediction model from the data collected in RC (n−1) and predicts bugs for the data collected in RC (n). For example, Remi builds a prediction model using data collected in RC2 and predicts bug-prone APIs for RC3. Based on the prediction results, the QA team performs API testing by allocating its resources to those bug-prone APIs. We repeat this process for RC4.
4.1
RQ1: Prediction Accuracy
We measure precision, recall, and f-measure for each Tizenwearable package. Table 2 presents the prediction results from Package 1 and 2 in Tizen-wearable RC2 and their average results. Since the RCs in the experiments were the outcome of intensive QA activities, most packages in RCs were already reliable. Thus, most packages except for Package 1 and 2 have no buggy APIs based on our labeling methods. We build the prediction model using the data collected from RC1 and predict the defects in RC2 using the model. Precision represents how many of the APIs predicted as buggy are correct. Recall measures how many buggy APIs are predicted from all actual buggy APIs. Since precision and recall have a trade-off, we compute f-measure which is a harmonic mean value of precision and recall. Table 2 also presents the prediction results by different depths of the call graph used during the metric aggregation (Section 3). We report the prediction results of Depth 0 and All for each package. Depth All means we summate metrics using all descendant functions of an API in the call graph. In Package 1, Remi achieves the high f-measure in both of Depths 0 and All (0.984 and 0.967, respectively). Although the f-measure in Package 2 is not as high as that in Package 1, we observed that 46% of the buggy APIs were ranked in the top 14% of APIs by Remi. This result indicates that default options for Random Forest, Logistics, Simple Logistics, LMT, J48, Naive Bayes, Bayes Network, and SMO [5].
Table 3: Results of RQ2 for the test development phase. (M) indicates resources consumed for modifying existing tests. (N) indicates resources for developing new tests. Resources Bug-Detect Ability Test Bugs Version Man-Day API Cases Detected w/o Remi 7 (M) 70 70 2 RC2 w/ Remi 19.7 (N) 158 158 2 w/o Remi 4.7 (M) 47 47 0 RC3 w/ Remi 3.25 (N) 26 26 2
our ranking is effective in prioritizing the riskier APIs so that the Samsung QA team can allocate its resources for these riskier APIs first. Table 2 shows the different prediction results in Depth 0 and Depth All. The packages may have more complexity in terms of the source code and process metrics when comparing the metric values in Depth All to those in Depth 0. Since higher metric values are likely to entail more APIs being predicted as bug-prone, the prediction results in Depth All have a better f-measure (0.522) of Package 2 in Depth All than that in Depth 0. Aggregating metrics at the APIlevel with a deeper call graph depth may be helpful and lead to a better prediction performance. To investigate the impact of different call graph depths, we applied Depth 0, 1, 3, 5, and All for all packages in Tizen-wearable. However, we observed that the deeper depth did not always lead to the better results as seen in Depth All of Package 1. One possible reason is that defects of APIs reside in functions invoked in different depths of the function call graph. We plan to identify the reasonable depth before building a prediction model as future work.
4.2
RQ2: Effects on API Testing
We evaluate the effects of Remi on API testing when Remi is applied during the API development process. In particular, we measure the bug detectability of the test suite and the allocated resources in two phases of API testing: test case development and test case execution. Table 3 presents the results for the test case development phase before and after applying Remi. The first two columns list subject versions applied with and without Remi. Before applying Remi, the QA team at Samsung modifies a subset of existing test cases that is affected by API specification changes or that contains invalid test inputs. After applying Remi, Samsung arranged an additional QA team whose members develop new test cases for risky APIs predicted by Remi. For this experiment, we define risky APIs to those APIs predicted with a 50% or higher buggy probability because the QA team at Samsung confirmed that 50% is the most suitable cut-off for effectively putting QA effort in their RC release cycles. Note that we conduct the experiment for RC3 at the same development starting point where all detected bugs by the modified and created test cases in RC2 have been fixed. Therefore, RC3 is developed on one single version rather than two different versions for with and without Remi. Column 3 presents the allocated testing resources in man-days. A man-day in Samsung is defined as eight hours of work per person. Columns 4 and 5 show the number of APIs and the number of the corresponding test cases, respectively. The last column represents the number of detected bugs by the test cases. The result in Table 3 indicates that Remi improves the effectiveness of the API testing as newly developed test cases
Table 4: Results of RQ2 for the test execution phase. Resources Version w/o Remi w/ Remi w/o Remi RC3 w/ Remi RC2
Man-Hour 2.18 2.18 2.11 2.11
Bug-Detect Ability Test Detected Detection Run Bugs Rate 873 6.5 0.74% 873 18 2.06% 845 8.1 0.96% 845 9 1.07%
for the risky APIs to detect additional bugs. Although more resources are consumed by the group using Remi due to the large percentage of buggy APIs during the early version (RC2), Remi reduces the use of a considerable amount of resources in RC3 (19.7 and 3.25 man-days in RC2 and RC3, respectively). This resource reduction is possible because the number of APIs predicted as buggy by Remi is much less than that in RC2. This implies that the reliability of Tizen-wearable improved after the intensive testing during RC2 by developing new test cases for those highly ranked APIs in terms of risk. Table 4 presents the results for the test suite execution phase. Column 3 shows the consumed resources in manhours, which are defined as 400 test executions per hour because testers at Samsung are advised to execute 100 test cases in 15 minutes. The last three columns present the number of test cases executed (Test Run), the number of detected bugs after Test Run, and the bug detection rate to Test Run, respectively. To illustrate the efficiency of Remi, we execute the test cases that are associated with the top 30% of total APIs ranked by Remi. For the fair comparison, we randomly select the same number of test cases (30%) for Test Run without Remi. Because of the randomness of selecting test cases, we repeat this 1,000 times [1]. As shown in Table 4, the bug detectability of the test suite executed using Remi outperforms the one without Remi in terms of the number of detected bugs with statistical significance (Wilcoxon signed-rank test, p