Nat. Hazards Earth Syst. Sci., 10, 2539–2546, 2010 www.nat-hazards-earth-syst-sci.net/10/2539/2010/ doi:10.5194/nhess-10-2539-2010 © Author(s) 2010. CC Attribution 3.0 License.
Natural Hazards and Earth System Sciences
Remote landslide mapping using a laser rangefinder binocular and GPS M. Santangelo1 , M. Cardinali1 , M. Rossi1 , A. C. Mondini1,2 , and F. Guzzetti1 1 CNR
IRPI, via Madonna Alta 126, 06128 Perugia, Italy di Scienze della Terra, Universit`a degli Studi di Perugia, Piazza dell’Universit`a, 06123 Perugia, Italy
2 Dipartimento
Received: 24 May 2010 – Revised: 13 August 2010 – Accepted: 15 November 2010 – Published: 9 December 2010
Abstract. We tested a high-quality laser rangefinder binocular coupled with a GPS receiver connected to a Tablet PC running dedicated software to help recognize and map in the field recent rainfall-induced landslides. The system was tested in the period between March and April 2010, in the Monte Castello di Vibio area, Umbria, Central Italy. To test the equipment, we measured thirteen slope failures that were mapped previously during a visual reconnaissance field campaign conducted in February and March 2010. For reference, four slope failures were also mapped by walking the GPS receiver along the landslide perimeter. Comparison of the different mappings revealed that the geographical information obtained remotely for each landslide by the rangefinder binocular and GPS was comparable to the information obtained by walking the GPS around the landslide perimeter, and was superior to the information obtained through the visual reconnaissance mapping. Although our tests were not exhaustive, we maintain that the system is effective to map recent rainfall induced landslides in the field, and we foresee the possibility of using the same (or similar) system to map landslides, and other geomorphological features, in other areas.
1
Introduction
Preparing reliable landslide inventory maps is key to several types of geomorphological investigations, and to determine landslide hazards and risk. Landslides can be recognized and mapped at different geographical scales using a number of techniques (Guzzetti et al., 2000), including: (i) direct Correspondence to: M. Santangelo (
[email protected])
field mapping (Brunsden, 1985; Ardizzone et al., 2007), (ii) interpretation of stereoscopic aerial photographs (Rib and Liang, 1978; Turner and Schuster, 1996), (iii) surface and sub-surface monitoring (Petley, 1984; Franklin, 1984), (iv) systematic analysis of chronicles and archive information (Reichenbach et al., 1998), and (v) by exploiting a variety of air- and space-borne remote sensing technologies (Mantovani et al., 1996; K¨aa¨ b, 2002; McKean and Roering, 2003; Cheng et al., 2004; Catani et al., 2005; Metternicht et al., 2005; Singhroy, 2005; Ardizzone et al., 2007). Regardless of the adopted technique, detecting and mapping landslides is a difficult, time-consuming, and error prone task (Roth, 1983; Carrara et al., 1992; Guzzetti et al., 2000; Galli et al., 2008). Any technology that can facilitate the recognition and mapping of landslides, that can reduce the time or cost for the production of a landslide inventory map, or that can improve the accuracy and quality of a landslide map, should be considered and tested. In this work, we present the results of an experiment aimed at testing a modern technology for the regional mapping of landslides in the field. More precisely, the experiment was intended to perform a preliminary evaluation of the possibility of using a rangefinder binocular coupled with a GPS receiver to help map recent landslides in the field, remotely. If successful, the technology may represent an aid for the rapid production of reconnaissance inventory maps over large areas. The scope of the experiment was not to perform a systematic comparison of the considered technology with consolidated methods and technologies for the production of landslide inventory maps over large areas (Guzzetti et al., 2000; Malamud et al., 2004; Galli et al., 2008), including the visual interpretation of aerial photographs or satellite imagery aided by field surveys (Rib and Liang, 1978; Wieczorek, 1984; Galli et al., 2008).
Published by Copernicus Publications on behalf of the European Geosciences Union.
2540
M. Santangelo et al.: Landslide mapping using laser binocular and GPS Table 1. Main technical data for the Vectronix VECTOR IV rangefinder binocular. One mil is equal to 1/6400 of 360◦ . Source: Vectronix AG (2008). Field of view Range capability Minimal distance Accuracy (1σ ) 50 m–2000 m Accuracy (1σ ) < 50 m and > 2000 m Magnification Azimuth accuracy (1σ ) Inclination accuracy (1σ ) Weight
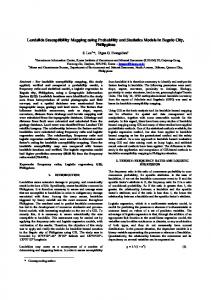
Fig. 1. Instruments used. (A) Vectronix VECTOR IV rangefinder binocular. (B) Leica Geosystems ATX1230 GG GPS/GLONAS receiver. (C) Xplore Technologies iX104C4 Rugged Tablet PC with ESRI’s ArcGIS release 9.3.1 and Leica Mobilematrix on ArcGIS release 3.1 software.
The experiment was conducted in the period from March to April 2010 in the Monte Castello di Vibio area, Umbria, Central Italy, a hilly area of about 21 km2 where landslides are abundant. Sedimentary rocks, Tertiary to recent in age, crop out in the area, including fluvial deposits along the valley bottoms, continental gravel, sand and clay, and layered sandstone and marl. 2
Instrumentation
The instrumentation used for the experiment consisted of (Fig. 1): (i) a Vectronix VECTOR IV binocular with 7× magnification optics, a high performance 1500 nm laser distance meter with a 6 km operational range, a digital magnetic compass, and a digital clinometer (Table 1), (ii) a Leica Geosystems ATX1230 GG GPS/GLONAS double frequency receiver, and (iii) an Xplore Technologies iX104C4 Rugged Tablet PC running Windows XP, ESRI’s ArcGIS release 9.3.1, and Leica Mobilematrix on ArcGIS release 3.1 software. For improved performance and simplicity of use, the binocular was mounted on a tripod. The total weight of the system is about 8.7 kg, including 3.5 kg for the tripod, 2.4 kg for the Tablet PC, 1.7 kg for the binocular, and 1.1 kg for the GPS receiver. The GPS receiver obtains three-dimensional (latitude, longitude, and elevation) geographical coordinates of the point where the rangefinder binocular is installed (the viewpoint). Via wireless technology, information on the position of the viewpoint is sent to the binocular. Using this information, and data captured by the laser distance meter, the digital compass, and the clinometer, the rangefinder binocular obtains three-dimensional geographical coordiNat. Hazards Earth Syst. Sci., 10, 2539–2546, 2010
6.75◦ , 120 mil 6000 m 5m ±2 m ±3 m 7× ±0.3◦ , ±5 mil ±0.2◦ , ±3 mil 1.68 kg
nates of distant points remotely. The binocular is wired to the Tablet PC for real-time data acquisition and geographical feature editing. To obtain a geographical representation of a distant landslide, the operator aims the rangefinder binocular to the landslide, and measures points along the landslide perimeter. In the GIS, the individual points are transformed into a polygon to represent the landslide.
3
Experimental setting
The experiment was conducted in three steps. First, thirteen landslides caused by prolonged rainfall in the period from January to March 2010, in the Monte Castello di Vibio area were recognized and mapped in the field during a regional reconnaissance campaign (Fig. 2). These were all the landslides visible from roads in the ∼21 km2 study area. For mapping the landslides, we used the methodology adopted in a nearby area by Ardizzone et al. (2007) to map similar rainfall-induced landslides occurred in the winter of 2004. Four geomorphologists (in two teams) drove and walked systematically along the roads in the study area. The teams stopped where single or multiple landslides were identified, and at scenery points to check individual and multiple slopes, and to take single or pseudostereoscopic photographs of each landslide or group of landslides. In the field, the geomorphologists prepared a preliminary map of the landslides using 1:10 000 scale base maps. Individual landslides were placed on the map visually, using the geomorphological and topographic information available on site. The two teams checked and photographed some of the landslides repeatedly. The cartographic and photographic information obtained in the field by the different geomorphologists was used in the laboratory to map visually the individual slope failures on 1:10 000 scale ortho-photographic base maps. Where information from multiple sources was available for the same landslide, the information was merged heuristically to obtain a single representation of the landslide. www.nat-hazards-earth-syst-sci.net/10/2539/2010/
M. Santangelo et al.: Landslide mapping using laser binocular and GPS
2541 285742 E 4748697 N
4748697 N
280127 E
A B 5 C D 9
8
3 2
7
6
1
4
0
0.5
4744866 N
4744866 N
N
1 km
©2010 Google - Map data ©2010 Tele Atlas
280127 E
285742 E
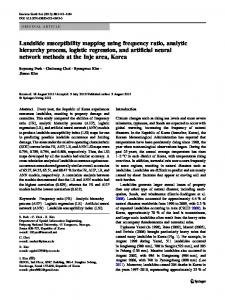
Fig. 2. Landslide event inventory map for the Monte Castello di Vibio area, Umbria, Central Italy. Red dots show the location of 13 landslides mapped through the visual reconnaissance survey and using the rangefinder binocular and GPS. Blue triangles show location of four viewpoints, and dashed lines identify fields of view. Numbers (1–9) identify landslides mapped through the reconnaissance survey and using the rangefinder binocular. Letters (A–D) identify slope failures mapped also by walking the GPS receiver along the landslide perimeter (see Fig. 3). Source of base maps: © 2010 Google – Map data, and © 2010 Tele Atlas.
The rainfall-induced landslides were shallow soil slides, ranged from 5 to 15 min (average 7 minutes). The mapping shallow compound slide-earth flows, and translational slides, time depended on the size and complexity of the slope ranging in area from AL = 218 m2 to AL = 7706 m2 (mean failure, the appearance and local visibility of the landslide, AL = 2174 m2 , standard deviation, σ , AL = 1993 m2 ), and on the number of landslides visible (hence, that could be for a total landslide area AL = 28267 m2 . The visual mapped) from the same viewpoint. In addition to the time reconnaissance survey was conducted on 9 February and in the field, in the laboratory data transfer and editing of the on 18 March 2010, and required a total of nine hours of geographical and thematic information in the GIS required fieldwork, and five additional hours of a GIS expert in the an average of 2 to 5 min per landslide, including automatic laboratory for mapping, editing and final feature correction. smoothing of the line representing the landslide boundary, Based on these figures, we estimate that the average time for improved cartographic appearance. Line smoothing was required for the visual mapping a single (typical) landslide necessary because use of the relatively limited number of ranged between 30 min and one hour (average 45 min). points measured with the rangefinder binocular and GPS would have resulted in an unrealistic, angular appearance Next, the same landslides were mapped using the of the individual landslides. The mapped landslides ranged rangefinder binocular and GPS system. The same team in area from AL = 77 m2 to AL = 4678 m2 (mean AL = of four geomorphologists that performed the visual recon1978 m2 , σ AL = 1565 m2 ), for a total landslide area AL = naissance mapping executed the remote mapping operating 23965 m2 , 15.2% less than in the visual reconnaissance from viewpoints located at distances ranging from ∼250 m mapping. to ∼3 km to the landslides. Due to the local perspective Lastly, to obtain an accurate (“reference”) geographical and the terrain morphology, only eleven landslides were mapped individually. Two landslides (n. 8 and n. 9 in Fig. 2) representation of the position and geometry of a subset of the slope failures, geomorphologists walked the GPS were recognized as a combined feature using the rangefinder receiver along the perimeter of four landslides (A, B, C, D binocular, and mapped as a single landslide. To investigate biases (or errors) introduced by different operators, two or in Fig. 2). For this operation, the GPS captured geographical coordinates every meter, a spatial sampling frequency higher three geomorphologists mapped some of the same landslides than the one used to measure points along the landslide repeatedly. The repeated measurements were performed in a with the rangefinder binocular. No correction was period of time not exceeding 30 min, i.e. in the same (or very Figureperimeter 2 applied to the GPS signal, and the expected planimetric error similar) lighting and visual conditions. Remote mapping of for the individual GPS measurements was ±5 m, or less. In the individual landslides in the field using the rangefinder the walk along the perimeter of a slope failure, we included binocular and GPS was conducted on 17 March and 1 April the crown area and the deposit of the landslide. In places, 2010. The time required for mapping a single landslide in the field (from identification to completion of the mapping) it was not straightforward (or unequivocal) to identify the www.nat-hazards-earth-syst-sci.net/10/2539/2010/
Nat. Hazards Earth Syst. Sci., 10, 2539–2546, 2010
2542
M. Santangelo et al.: Landslide mapping using laser binocular and GPS
local boundary of the landslide, particularly along the sides of the slope failure, where topography was hummocky, and where the vegetation was tall. In these places, the ability of the geomorphologist to follow the landslide boundary was hampered by the reduced visibility of the slope failure, a consequence of the local perspective, of the size of the landslide, and of the fact that the landslide boundary was locally indistinct. The geographical coordinates of the individual landslides were automatically superimposed in the GIS on the geographical information obtained using the rangefinder binocular. Direct mapping of the landslides using the GPS receiver was performed on 1 April 2010. The time to walk around a single landslide varied from 30 min to 1 h, depending on the size of the landslide and the complexity of the terrain. 4
Results
We now compare the landslide maps produced using the different mapping methods. For the purpose, we assume that the maps obtained by walking the GPS receiver along the landslide perimeter are the most accurate and reliable representations of the individual slope failures. The assumption is justified considering that: (i) with local exceptions, the recognition of recent, fresh landslides is relatively simple from a distance, and (ii) the error associated with the individual GPS measurements (±5 m) is lower than the error made by mapping a landslide visually in the reconnaissance mapping, and lower than the error associated to the measurements obtained by the rangefinder binocular, which include GPS measurements. In Fig. 3 we compare the maps of four landslides obtained: (i) through visual reconnaissance mapping and interpretation of digital photographs taken in the field, (ii) using the rangefinder binocular and GPS, and (iii) by walking the GPS receiver along the perimeter of the individual landslides. Pictures in the left-hand column of Fig. 3 (3.1–3.4) portray digital photographs of the slope failures taken in the field at distances ranging from several hundreds to a few thousands meters. In the photographs, the dotted yellow lines were added to outline the location and shape of the landslides. Images in the second column of Fig. 3 (3.5–3.8) portray the mapping of the four landslides obtained by walking the GPS receiver along the perimeter of the slope failures (light blue dots). For the individual landslides, the mapping obtained by the GPS was considered an accurate representation of the slope failure, and taken as reference for comparison with the other mappings. Images in the third column of Fig. 3 (3.9– 3.12) show the result of the field-based visual reconnaissance mapping (violet lines) with the reference mapping obtained by walking the GPS receiver along the landslide perimeter (light blue dots). Lastly, Fig. 3.13–3.16 portray the mapping obtained using the rangefinder binocular and GPS, compared to the mapping obtained by walking the GPS receiver along the perimeter of the slope failures. In the later images, Nat. Hazards Earth Syst. Sci., 10, 2539–2546, 2010
the yellow points along the dashed lines show the raw data captured in the field, and the continuous red lines show the adjusted representations of the landslide perimeters obtained by smoothing of the raw data in the GIS. Light blue dots show points captured walking the GPS receiver along the landslide perimeter. Inspection of Fig. 3 reveals that there is good agreement between the slope failures mapped using the rangefinder binocular and GPS, and the same failures mapped by walking the GPS receiver along the landslide perimeter. Further, the cartographic representation of the individual landslides obtained by the rangefinder binocular and GPS is similar (Fig. 3.15), better (Fig. 3.14 and 3.16), or significantly better (Fig. 3.13) than the mapping obtained with the reconnaissance survey. In particular, Fig. 3.13 shows that the location and size of the landslide in the visual reconnaissance inventory (Fig. 3.9) were incorrect, probably due to the difficulty in locating the landslide visually from a distance on the available base map. Similarly, image 12 in Fig. 3 shows that the landslide mapped during the visual reconnaissance survey is smaller, of different shape, and in a slightly different position than the same landslide mapped using the rangefinder binocular (Fig. 3.16) and the GPS (Fig. 3.8). In an attempt to quantify the degree of similarity (or discrepancy) between the different mappings, we determined the error index E (Carrara et al., 1992), and the corresponding matching index M (Galli et al., 2008), for the individual landslides. For the purpose, we used Eqs. (1) and (2): E=
(AL1 ∪ AL2 ) − (AL1 ∩ AL2 ) , 0≤E ≤1 (AL1 ∪ AL2 )
M = 1 − E, 0 ≤ M ≤ 1
(1) (2)
where, AL1 and AL2 are the areas of a single landslide measured by two separate mappings, and ∪ and ∩ are the geographical union and intersection of the two landslides, obtained in the GIS. From Eqs. (1) and (2), if two mappings show a landslide of exactly the same shape and size in the same geographical location (a rare condition), matching is perfect (M = 1) and cartographic error is nil (E = 0). On the contrary, where two mappings disagree totally (e.g., Figs. 3.9, 3.13), error is largest (E = 1) and cartographic matching is nil (M = 0). Table 2 lists the results for the thirteen mapped landslides. Analysis of the indices reveals that the mismatch E between the mapping obtained using the rangefinder binocular and the mapping obtained by walking the GPS along the landslide perimeter is reduced (min = 0.17, max = 0.29, mean = 0.19, σ = 0.06), when compared to the mismatch measured between the mapping obtained with the rangefinder binocular and the visual reconnaissance mapping (min = 0.37, max = 1, mean = 0.65, σ = 0.22). This confirms that maps obtained using the rangefinder binocular are similar to the (“reference”) maps obtained by walking the GPS www.nat-hazards-earth-syst-sci.net/10/2539/2010/
M. Santangelo et al.: Landslide mapping using laser binocular and GPS
Field photograph
2543
Reconnaissance mapping vs. GPS mapping
Rangefinder binocular vs. GPS mapping
Landslide A
GPS mapping
(5 )
(9 )
(13)
(2 )
(6 )
(10)
(14)
(3 )
(7 )
(11)
(15)
Landslide C
Landslide B
(1 )
Landslide D
N
(4 )
(8 )
(12)
(16)
0
25 50
100 m
Fig. 3. Comparison of landslide maps prepared for four landslides in the Monte Castello di Vibio area, Umbria, Central Italy. From left to right, columns show: (i) photographs taken in the field to help the visual reconnaissance mapping (dotted yellow lines added to outline the landslides), (ii) maps obtained by walking the GPS receiver along the perimeter of the individual landslides, (iii) maps portraying the result of the visual reconnaissance mapping (violet lines) and mapping obtained by walking the GPS receiver along the landslide perimeter (light blue dots), (iv) maps obtained using the rangefinder binocular and GPS (yellow dashed lines show raw data obtained in the field, and red lines show smoothed landslide boundaries for improved cartographic appearance) and mapping obtained by walking the GPS receiver along the landslide perimeter (light blue dots).
Figure 3
along the landslide perimeter, and significantly dissimilar to the visual reconnaissance mapping. Further, analysis of the error indices indicates that the mismatch between the mapping obtained using the rangefinder binocular and that obtained by walking the GPS along the landslide perimeter
www.nat-hazards-earth-syst-sci.net/10/2539/2010/
is significantly less than the mismatch measured by Carrara et al. (1992), Ardizzone et al. (2002), and Galli et al. (2008), who compared landslide maps prepared through the visual interpretation of stereoscopic aerial photographs.
Nat. Hazards Earth Syst. Sci., 10, 2539–2546, 2010
2544
M. Santangelo et al.: Landslide mapping using laser binocular and GPS
Landslide B
Landslide A
Landslide B N
(1 )
(2 )
(3 )
0
25
50
100 m
Fig. 4. Comparison of maps prepared for two landslides in the Monte Castello di Vibio area, Umbria, Central Italy. (1) Two mappings prepared by the same operator using the rangefinder binocular and GPS from a distance of ∼2.5 km (orange), and from a distance of ∼250 m (violet). (2) Mappings performed by two operators (yellow and red lines) using the rangefinder binocular from a distance of ∼2.5 km. (3) Mappings obtained by three operators (yellow, red, and pink lines) using the rangefinder binocular and GPS from a distance of ∼250 m. In all maps, light blue dots show data obtained by walking the GPS receiver along the landslide perimeter.
obtained by GPS (light blue dots). The measurements of the area of the landslide confirm the degree of matching: (i) AL = 2189 m2 for GPS, (ii) AL = 2083 m2 for binocular and GPS positioned at 250 m distance (4.8% difference), and (iii) AL = 1976 m2 for binocular and GPS positioned at 2500 m distance (9.6% difference). Further, in Fig. 4.1 points laying on the orange and violet lines are at a maximum distance of 8 m, and most of them within a distance of 4 m, Landslide BIN vs. VRS BIN vs. GPS code E M E M from the boundary of the landslide obtained by walking the GPS along the landslide perimeter (light blue dots). A 1.00 0.00 0.17 0.83 Figure 4.2 shows two representations of the same landslide B 0.71 0.29 0.16 0.84 (A, in Fig. 2) obtained by two separate investigators (red C 0.45 0.55 0.15 0.85 and yellow lines) that used the rangefinder binocular from D 0.54 0.46 0.29 0.71 1 0.77 0.23 the same surveying distance of about 2500 m. Similarly, 2 0.93 0.07 Fig. 4.3 shows three mappings of the same landslide (B, 3 0.95 0.05 in Fig. 2) obtained by different operators (red, yellow, 4 0.49 0.51 and blue lines) that used the binocular and GPS to 5 0.56 0.44 measure the landslide from a distance of about 250 m. 6 0.48 0.52 Comparison of the measurements confirms the accuracy 7 0.37 0.63 of the mappings obtained by different operators using the 8, 9 0.59 0.41 rangefinder binocular. We take this as an indication that the equipment tested can be used to map landslides consistently (i.e., accurately) in the field. Considering both maps, points laying on the orange, violet and red lines are at a maximum distance of 10 m, and most of them within a distance of We next compare mappings of two landslides obtained Figure54m, from the boundary of the landslides obtained by GPS using the rangefinder binocular from different measuring distances, and by different operators (Fig. 4). Figure 4.1 (light blue dots). For the two landslides, the measured shows two representations of the same landslide (B, in areas are also similar. For Fig. 4.2, AL = 1878 m2 for GPS, AL = 1789 m2 (red line, 4.7% difference), and AL = 1718 m2 Fig. 2) obtained by the same operator using the rangefinder binocular positioned at two distances from the slope failure: (yellow line, 5.2% difference). For Fig. 4.2, AL = 2189 m2 (i) about 250 m (violet line), and (ii) about 2500 m (orange for GPS, AL = 2083 m2 (red line, 4.8% difference), AL = 2204 m2 (yellow line, 0.7% difference), and AL = 2027 m2 line). The two representations of the same landslide are similar, and in agreement with the “reference” mapping (violet line, 7.4% difference). Table 2. Landslide cartographic errors. E (error index) computed using Eq. (1), M (matching index) computed using Eq. (2). For landslide codes see (Fig. 2). BIN, mapping obtained using the rangefinder binocular; VRS, mapping obtained through visual reconnaissance survey; GPS mapping obtained by walking the GPS receiver along the landslide perimeter.
Nat. Hazards Earth Syst. Sci., 10, 2539–2546, 2010
www.nat-hazards-earth-syst-sci.net/10/2539/2010/
M. Santangelo et al.: Landslide mapping using laser binocular and GPS 5
Discussion
Despite local problems related to the difficulty in determining the “exact” position and extent of a landslide in the field, the mapping of the landslide obtained by taking the GPS receiver along the perimeter of the individual slope failure was undoubtedly the most accurate. This procedure is resource intensive and clearly impractical to map slope failures in a large area, where landslides are numerous, or in difficult, hazardous, or inaccessible terrain. Use of the rangefinder binocular and GPS allowed capturing information on the geographical location, size, and shape of the landslides in the field, remotely. For the purpose of preparing regional, landslide event-inventory maps at 1:10 000 scale (or smaller), the quality of the landslide information obtained remotely was comparable to the quality of the similar information obtained by walking the GPS receiver along the landslide perimeter, and was locally superior to much superior to the information obtained through the reconnaissance mapping (Fig. 3). We now discuss general advantages and main limitations of the remote mapping using the rangefinder binocular and GPS receiver, compared to the visual reconnaissance field mapping. In a field-based reconnaissance mapping, landslides are identified visually. To locate and map the individual slope failures, the geomorphologist relies on a base map, which almost invariably pre-dates the landslides. This can result in local errors (Figs. 3.4 and 3.13), where landslides are difficult to locate visually, or where the base map does not show clear or sufficient topographical (morphological) information to place and map the landslides, e.g., where the pre-failure topography does not show signs of the post-failure geometry of the landslide. Use of the rangefinder binocular and GPS solves the problem, allowing for an accurate (within the nominal accuracy of the instruments) location of the individual landslides. The remote mapping may result in landslide maps that are in local contrast with the topography shown on the base map. Where this is a problem, postprocessing of the landslide information in the GIS can reduce the mismatch. The remote mapping requires less time, skills, and resources than the visual reconnaissance mapping to map the same landslides. First, accurate geographical information is obtained digitally and stored directly in the GIS. This reduces the post-processing effort, which is a considerable part of the reconnaissance mapping procedure. Second, the operator performing the mapping needs “only” to be able to recognize the landslide in the field, and to trace the landslide perimeter with the rangefinder binocular. This is simpler than the reconnaissance mapping that requires that the geomorphologist reads and understands the local topography shown on the base map.
www.nat-hazards-earth-syst-sci.net/10/2539/2010/
2545
Despite the clear advantages, landslide mapping using the rangefinder binocular has limitations. First, only landslides that can be clearly seen from viewpoints, and that are at distances within the operational range of the laser rangefinder (6 km, for the Vectronix VECTOR IV), can be measured successfully. As an example, landslides numbered 8 and 9 in Fig. 2 could not be resolved individually, and were – erroneously – mapped as a single landslide. This is evidence that the technology will not replace the interpretation of aerial or satellite images, completely. Also, the GPS signal must be available at the surveying points, for the system to work. The equipment may not work always and everywhere, and for all landslides. As an example, the system may not work in forested terrain or in foggy areas. We conclude that use of the system will not guarantee the completeness of the inventory (Malamud et al., 2004; Galli et al., 2008). Second, the system requires power to work (for the Tablet PC, the GPS receiver, and the binocular). In our test, use of the system was limited only by the run time of the battery of the Tablet PC (∼4 h with a single battery). The system is not heavy (< 10 kg) or bulky (Fig. 1), and can be easily transported and used by a single person. However, the system was most effective when operated with the support of a vehicle, which allowed for: (i) recharging the batteries of the Tablet PC, extending the operational period of the system, (ii) maintaining the GPS system connected throughout the field work, and (iii) keeping the binocular mounted on the tripod, reducing the time required to set up the system at each measuring point. Third, the system is expensive to buy. In Italy, the total cost for the instruments and the software used in the experiment ranges between 18 000 C to 35 000 C, depending chiefly on the cost of the GIS software license. The hardware that we have tested requires proprietary GIS software. Should the hardware use open-source or free GIS software, the cost of the system could be reduced substantially. We stress that our experiment, and the analysis of the results, were based on a limited number of landslides (13 slope failures), all of the same type. We acknowledge that this limits the validity of our work. The rangefinder binocular was tested on landslides triggered by a single rainfall period in one geographical area characterized by a specific morphological and geological setting. This also limits the force of our conclusions. More efforts are required to test the technology with different landslide types, and in diversified geomorphological and environmental settings. Lastly, new tests are needed to compare the mapping performed using the rangefinder binocular with maps obtained adopting consolidated methods for the production of regional landslide inventories, chiefly the visual interpretation of aerial photographs (Rib and Liang, 1978; Wieczorek, 1984; Galli et al., 2008).
Nat. Hazards Earth Syst. Sci., 10, 2539–2546, 2010
2546 6
M. Santangelo et al.: Landslide mapping using laser binocular and GPS
Conclusions
We have tested a system composed of a high-quality laser rangefinder binocular, coupled with a GPS receiver, and connected to a Tablet PC running GIS and dedicated software, to help recognize and map recent rainfall-induced landslides in the field, remotely. The experiment was successful, and demonstrated that the technology is effective to prepare accurate landslide event-inventory maps (Malamud et al., 2004) at 1:10 000 scale, or smaller. Despite a few limitations, and the need for more extensive tests, including a comparison with established methods for the production of regional inventories (Rib and Liang, 1978; Wieczorek, 1984; Galli et al., 2008), we foresee the possibility of using the equipment systematically to map similar and different landslides remotely in other geographical areas and morphological settings. We further expect that the system, or other systems based on instruments with similar technical characteristics, will contribute substantially to the production of new accurate and reliable landslide event-inventory maps, particularly where post-event aerial photography or very high resolution satellite images are not available. This will have a positive feedback for geomorphological studies, and hazard and risk evaluations (Guzzetti et al., 2000). Acknowledgements. We are grateful to the Regione dell’Umbria, Direzione Ambiente Territorio e Infrastrutture, that provided the technical equipment used for the experiment and funding for the study. MR and MS were supported by grants of the Italian national Department for Civil Protection. ACM was supported by a grant of the ASI MORFEO project. Disclaimer In this work, use of copyright, brand, logo and trade names is for descriptive and identification purposes only, and does not imply an endorsement from the authors or their institutions. Edited by: O. Katz Reviewed by: two anonymous referees
References Ardizzone, F., Cardinali, M., Carrara, A., Guzzetti, F., and Reichenbach, P.: Impact of mapping errors on the reliability of landslide hazard maps, Nat. Hazards Earth Syst. Sci., 2, 3–14, doi:10.5194/nhess-2-3-2002, 2002. Ardizzone, F., Cardinali, M., Galli, M., Guzzetti, F., and Reichenbach, P.: Identification and mapping of recent rainfall-induced landslides using elevation data collected by airborne Lidar, Nat. Hazards Earth Syst. Sci., 7, 637–650, doi:10.5194/nhess-7-6372007, 2007. Brunsden, D.: Landslide types, mechanisms, recognition, identification, in: Landslides in the South Wales coalfield, edited by: Morgan, C. S., Proceedings Symposium, April 1-3, The Polytechnic of Wales, 19–28, 1985. Catani, F., Farina, P., Moretti, S., Nico, G., and Strozzi, T.: On the application of SAR interferometry to geomorphological studies: estimation of landform attributes and mass movements, Geomorphology, 66(1–4), 119–131, 2005.
Nat. Hazards Earth Syst. Sci., 10, 2539–2546, 2010
Carrara, A., Cardinali, M., and Guzzetti, F.: Uncertainty in assessing landslide hazard and risk, ITC Journal, 2, 172–183, 1992. Cheng, K. S., Wei, C., and Chang, S. C.: Locating landslides using multi-temporal satellite images, Adv. Space Res., 33(3), 96–301, 2004. Franklin, A. J.: Slope instrumentation and monitoring, in: Slope Instability edited by: Brunsden, D. and Prior, D. B., John Wiley and Sons, 1–25, 1984. Galli, M., Ardizzone, F., Cardinali, M., Guzzetti, F., and Reichenbach, P.: Comparing landslide inventory maps, Geomorphology, 94, 268–289, 2008. Guzzetti, F., Cardinali, M., Reichenbach, P. and Carrara, A.: Comparing landslide maps: A case study in the upper Tiber River Basin, central Italy, Environ. Manage., 25(3), 247–363, 2000. K¨aa¨ b, A.: Monitoring high-mountain terrain deformation from repeated air- and spaceborne optical data: examples using digital aerial imagery and ASTER data, ISPRS J. Photogramm., 57(1– 2), 39–52, 2002. Malamud, B. D., Turcotte, D. L., Guzzetti, F., and Reichenbach, P.: Landslide inventories and their statistical properties, Earth Surf. Proc. Land., 29(6), 687–711, 2004. Mantovani, F., Soeters, R., and van Westen, C. J.: Remote sensing techniques for landslide studies and hazard zonation in Europe, Geomorphology, 15, 213–225, 1996. Metternicht, G., Hurni, L., and Gogu, R.: Remote sensing of landslides: An analysis of the potential contribution to geo-spatial systems for hazard assessment in mountainous environments, Remote Sens. Environ., 98(2–3), 284–303 2005. McKean, J. and Roering, J.: Objective landslide detection and surface morphology mapping using high-resolution airborne laser altimetry, Geomorphology, 57(3–4), 331–351, 2003. Petley, D. J.: Ground investigation, sampling and testing for studies of slope instability, in: Slope instability, edited by: Brunsden, D. and Prior, D. B., Wiley, Chichester, 67–101, 1984. Reichenbach, P., Guzzetti, F., and Cardinali, M.: Map of sites historically affected by landslides and floods in Italy, 2nd edn., CNR Gruppo Nazionale per la Difesa dalle Catastrofi Idrogeologiche Publication n. 1786, scale 1:1 200 000, 1998. Rib, H. T. and Liang, T.: Recognition and identification, in: Landslide Analysis and Control, edited by: Schuster, R. L. and Krizek, R. J. ,National Academy of Sciences, Transportation Research Board Special Report 176, Washington, 34–80, 1978. Roth, R. A.: Factors affecting landslide susceptibility in San Mateo County, California, Association Engineering Geologists Bulletin, 20(4), 353–372, 1983. Singhroy, V.: Remote sensing of landslides, in: Landslide risk assessment, Glade, T., Anderson, M. G., and Crozier, M. J., John Wiley, 469–492, 2005. Turner, A. K. and Schuster, R. L. (Eds.): Landslides: Investigation and Mitigation, Washington, D.C., National Research Council, Transportation Research Board Special Report 247, 673 pp., 1996. Vectronix, A. G.: VECTOR IV Laser Rangefinder Operating & Operator Maintenance Instructions, Vectronix A.G., User Manual Version 2.1, Heerbrugg, Switzerland, 2008. Wieczorek, G. F.: Preparing a detailed landslide-inventory map for hazard evaluation and reduction, Bulletin of the Association of Engineering Geologists, 21(3), 337–342, 1984.
www.nat-hazards-earth-syst-sci.net/10/2539/2010/