Adv. Geosci., 19, 75–82, 2008 www.adv-geosci.net/19/75/2008/ © Author(s) 2008. This work is distributed under the Creative Commons Attribution 3.0 License.
Advances in Geosciences
Integrated remote sensing techniques for the detection of buried archaeological adobe structures: preliminary results in Cahuachi (Peru) N. Masini1 , E. Rizzo2 , R. Lasaponara2 , and G. Orefici3 1 CNR-IBAM
(Istituto per i Beni Archeologici e Monumentali), C.da S. Loja 85050 Tito Scalo (PZ), Italy (Istituto di Metodologie di Analisi Ambientale), C.da S. Loja 85050 Tito Scalo (PZ), Italy 3 Centro de Estudios Arqueol´ ogicos Precolombinos (CEAP), Nasca, Peru 2 CNR-IMAA
Received: 8 August 2008 – Revised: 3 November 2008 – Accepted: 3 November 2008 – Published: 14 November 2008
Abstract. This paper is focused on the jointly use of satellite Quickbird (QB) images and Ground Probing Radar (GPR) for assessing their capability in the detection of archaeological adobe structures (sun-dried earth material). Such detection is particularly complex. due to the low contrast generally existing between the archaeological features and the background. Two significant test areas were investigated in the Ceremonial Centre of Cahuachi (in the Nasca territory, Southern Peru) dating back to 6th century BC to 4th century AD. Our results showed that both satellite and GPR data provided valuable indications for unearthing precious ancient remains. Our preliminary analyses pointed out that the integrated use of non destructive remote sensing techniques has high potentiality for its important scientific implications and for its significant contributions to cultural resource management.
1
Introduction
The use of remote sensing technology for the detection, identification, and interpretation of archaeological resources is one of the most fascinating challenges to be addressed from the cultural, scientific and technical point of view. The integrated use of remote sensing technology and methodologies besides its important scientific implications, can contribute significantly to the preservation, monitoring and management of cultural resources.
A multisensor and multiscale approach can be fruitfully used for the reconstruction of ancient landscape and for locating and mapping new archaeological features relating to ancient buildings, roads, walls, land division (Kvamme et al., 2006). The use of satellite and geophysical prospection is highly desirable, especially for enhancing subtle anomalies of archaeological interest. In particular the application of such technologies to detect buried adobe structures is still an open issue (Linford, 2006; Kvamme et al., 2006). This is mainly due to the relatively low geophysical parameter contrast between the buried adobe (sun-dried earth material) archaeological remains and the surrounding areas (Lascano et al., 2003). The high scientific, technical and archaeological interest in this issue is driven from the fact that for several thousand years, adobe had been widely used in Middle East, North Africa, Central and Southern America and a number of ancient population, still little known, used the adobe for building their domestic, defence and religious settlements This paper is focused on the evaluation of the capability of Very High Resolution (VHR) satellite images and GPR for the identification and mapping of archaeological adobe structures. The investigations were performed for two significant test areas selected inside the Ceremonial Centre of Cahuachi, located in the drainage basin of Rio Nasca (Southern Peru), where ongoing archaeological excavations have been unearthing remarkable examples of adobe architecture of the Paracas and Nasca civilizations.
Correspondence to: N. Masini (
[email protected]) Published by Copernicus Publications on behalf of the European Geosciences Union.
76
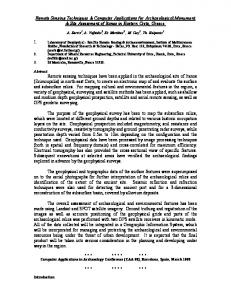
Fig. 1. QuickBird RGB composition (R=red, G=green B=blue) of the investigated area, acquired on 25 March 2005. A and B denote the sectors where the archaeological surveys have been performed in the last forty years. The excavations and trials have been only focused on sector A and in particular in the Gran Piramide (A1), Grande Templo (A2), Monticulo (A3), Piramide de Naranja (A4), Templo del Escalonado (A5).
2 Study area The two test sites under investigation were selected inside the Ceremonial Centre of Cahuachi, located close to Nasca, southern Peru. Cahuachi is situated at an elevation of 365 m a.s.l. on a Pre-Montane desert formation in the drainage basin of Rio Grande (Southern Peru), characterized by a hot and arid climate with very little measurable rainfall recorded each year. Geologically it is located on Quaternary sedimentary rock formations (that are riverine and riverine alluvial) of a tectonic depression (Ica-Nasca Depression). A few kilometres from the archaeological site are the Andean foothills, composed of Jurassic and Cretaceo formations (Montoya et al., 1994). Cahuachi was built by the Nasca, one of the most important and evolved precolombine civilizations, capable of realizing the “Nasca lines” inscribed in the UNESCO World Heritage List. The spatial extension and historical importance of Cahuachi, makes it one of the most important cultural heritage sites of the ancient Peru. The drainage basin of Rio Grande has been populated by sedentary groups at least since the Formative Period (Initial Period, 1800–800 BC; Paracas culture, 800–200 BC). In the Early Intermediate Period (200 BC–600 AD) the region flourished under the Nasca Culture, during which Cahuachi was founded and developed. Cahuachi is believed to have been an important ceremonial centre (Silverman, 1993; Orefici, 1992; Orefici, 1993) Adv. Geosci., 19, 75–82, 2008
N. Masini et al.: Remote sensing archaeology in Cahuachi (Peru) which served as a place of pilgrimage for the population living in the basin of Rio Grande. The archaeological evidences spread out on a large desolate area sited on the left of Nasca river, characterized by about forty mounds, along with 3 and 4-sided enclosures. It includes a cultivated strip around the river and a desolate hill on the North. Since 1984 archaeological surveys have been in progress by an Italian-Peruvian Mission directed by G. Orefici, which put in evidence that the area of archaeological interest is around 25 sq km. In particular, the archaeological surveys have been focused on two sectors referred to as A (0.16 sq km) and B (0.10 sq km) (Fig. 1). Up to now the excavations have been only concentrated on sector A considered to be the core of the entire ceremonial settlement (Orefici, 1992; Orefici, 1993). Sector B is sited at Nortwest of sector A and includes a certain number of mounds and a visible buried enclosure on the southern side (Fig. 1). Up to now, about half of the sector A has been brought to light. The archaeological mission has completely unearthed and restored the so-called “la Grande Piramide (Orefici, 1993; see A1 in Fig. 1), a huge asymmetrical Pyramid. Whereas, a terraced temple (Templo del Escalonado; A5, Fig. 1) and a smaller pyramid (Piramide de Naranja, A4, Fig. 1) are in advanced state of excavation. Sector A also includes another mound (Monticulo; A3 in Fig. 1), that has been partially unearthed, and a terraced mound not still excavated (Gran Templo; Fig. 1, A2). The results of archaeological excavations allowed us to identify five building historical phases, during which changes of architectural types, building characteristics, materials, ceramics, stylistic and iconographical features were recorded. These changes reflect the functional and cultural evolution of the site, which was at the beginning a sort of sanctuary or Huaca. Then it became a ceremonial centre and later the Theocratic Capital of the Nasca state. Each historical change was characterized by distinct architectural and building features. The first phase (Paracas age: 400–200 BC) is characterized by isolated structures built with conic shape elements of adobe. The buildings are terraced structures. On the top, there were the quincha, construction systems, composed of wood and cane framework, covered in mud and plaster. The second phase reflects the existence of a consolidated hierarchical social structure, in which the religious class was dominant. The spatial organization changed because of the need for new and wider spaces for ritual ceremonies. The platform type was abandoned for more articulated and monumental terraced temples, built with bread shape adobe elements. To this aim, most of the pre-existent temples were enlarged according to reshaping procedures based on the filling of walls and spaces between structures with soil, adobe, vegetable mat and other materials, such as textiles and ceramics, which were broken with the explicit aim of sacrifice. The third phase of the sector A took place in the apogee of the history of Cahuachi. In this period big terraced structures www.adv-geosci.net/19/75/2008/
N. Masini et al.: Remote sensing archaeology in Cahuachi (Peru) of adobe (The Gran Piramide and the Gran Templo) and the enclosure were built. The building reshaping procedure, above described, was still used. The fourth phase was characterized by the division of architectural spaces which were embellished by colonnades in wood (algarrobo) and covered by clay and reeds. It was the period of the beginning of the decadence of Cahuachi, probably also caused by an earthquake and flash floods, as proved by the several collapsed structures unearthed and the geological studies. Finally, in the fifth phase (300–400 AD) there was the abandonment of the site and the covering of the monuments with desert sand. Although over the years, important findings have been recorded from archaeological excavations, we still know very little about the ancient Nasca culture and Cahuachi area. Important information can be continuously extracted and recorded and in such a context remote sensing techniques could be fruitfully adopted. 3
Aims of the remote sensing approach to Cahuachi areas
Being that the composition of adobe is quite similar to the earth material, the detection of archaeological features is a challenge as difficult as it is engaging. The presence of ancient remains could not produce any significant spatial anomalies detectable by using geophysical prospection or from an aerial view. This paper is focused on the assessment of the capability of satellite VHR-QB images and GPR for the identification of archaeological adobe structures. To this aim two different test sites were selected, one inside sector A, where the excavations are currently in progress; and the second inside sector B. GPR measurements were performed in a test site selected in sector A, to address the excavation and QB images were employed to geo-reference the prospected area. Whereas, for sector B, the investigations were performed using only QuickBird images. Sections 4 and 5 describe respectively the active and passive multiscale remote sensing techniques employed to support the archaeological research. 4 4.1
Satellite based analysis Satellite data and processing
QuickBird is the commercial satellite that provides the highest spatial resolution of multispectral images. It has panchromatic and multispectral sensors with resolutions of 61–72 cm and 2.44–2.88 m, respectively, depending upon the off-nadir viewing angle (0–25 degrees). It provides a good stereo geometry and a high revisit frequency of 1–3.5 days depending www.adv-geosci.net/19/75/2008/
77 on latitude. The panchromatic sensor collects information at the visible and near infrared wavelengths and has a bandwidth of 450–900 nm. The multispectral sensor acquires data in four spectral bands from blue to near infrared (NIR). The QB data used for this study (Catalog ID 90100100 153B9E00) were acquired on the 25th March 2005 at around 3 p.m. with an off nadir view angle of 11.9 degrees. The identification of archaeological adobe structures is particularly complex to perform using any type of remote sensing technique. In fact, the presence of ancient remains could not produce any significant spatial anomalies detectable from aerial/or space view. In order to roughly characterize the presence of archaeological marks from an aerial view the historical aerial photos were analysed. In particular, the availability of a long running time series of aerial images taken during the last twenty years of archaeological excavations, allowed us to compare the archaeological features visible before the excavations with the real unearthed archaeological structures. This comparison puts in evidence three important facts: (i) the subsurface adobe structures were generally not visible from an aerial view; (ii) surface wall remains were more easily identified due to the high contrast in brightness between the clay of the surface adobe walls and the surrounding alluvial deposits which cover a large part of the mound; (iii) shallow walls were detectable thanks to the small shadow produced on the ground (see Fig. 2a–b). The investigations were performed considering both single spectral channels and numerical combinations. All of them were first investigated individually and then combined by using a data fusion algorithm in order to integrate the geometric detail of panchromatic and the spectral information of the multispectral images. The benefits achievable from fusion algorithms have been assessed in a number of different application fields (see, for example, Ranchin et al., 2003) and also specifically in the case of satellite – based detection of archaeological remains (Lasaponara and Masini, 2006). The data fusion was performed by using an algorithm based on least square method (Zhang, 2004). This algorithm, has been adopted by Digital Globe (http://www.pcigeomatics.com/support center/tech papers/ techpapers main.php) and it is also available in a PCIGeomatica routine. In order to enhance the low contrast between the archaeological features and the surrounding area Principal Component Analysis (PCA) was adopted. PCA is a linear transformation which decorrelates multivariate data by translating and/ or rotating the axes of the original feature space (Richards, 1986). In this way the data can be represented without correlation in a new component space. In order to do this, the process firstly computes the covariance (Unstandardized PCA) or the correlation (standardized PCA) matrix among all input spectral channels. Then Adv. Geosci., 19, 75–82, 2008
78
N. Masini et al.: Remote sensing archaeology in Cahuachi (Peru)
Fig. 2. Types of archaeological marks.
4.2
Fig. 3. Zooms of the sector B which put in evidence the best performance of the panchromatic image (a) respect to red (b) and NIR data fusion products (c).
eigenvalues and eigenvectors are calculated in order to obtain the new feature components. The PCA transforms the input multispectral bands into new components whose number is equal to or less than the input channels. The first component contains the major portion of the variance, each successive component contains less of the total dataset variance. The first component provides a sort of average of all the input channels, whereas the later components may represent information variance for a small area or what is essentially noise. In the latter case it must be disregarded. The PCA could make the identification of distinct features and surface type easier. This is a direct result of different facts: (i) only the meaningful low correlated data can be considered, (ii) the effect of noise can be easily identified and strongly reduced because it is in the later components. Moreover, the PCA can be used to obtain a new color enhancement technique, “Decorrelation Stretching”, based on the following steps: (i) PCA transformation, (ii) each PCA component is contrast stretched, (iii) stretched components are rotated back using the inverse PCA transformation (iv) finally, the resulting components are shown in RGB.
Adv. Geosci., 19, 75–82, 2008
Satellite based results
The processing of QB imagery was aimed at the enhancement of features related to the borders of mounds, platforms and enclosers. For the test site selected in sector B, all the four bands (blue, green, red and near infrared) were analysed, in order to experience the multispectral capability of QuickBird imagery for the identification of spatial anomalies originated by buried adobe structures. The comparative visual inspection of the available dataset (panchromatic, multispectral channels and image fused images) puts in evidence the fact that the panchromatic provides more and better quality information (see Fig. 3a–c). In the panchromatic image of Fig. 4a the most significant features have been highlighted. In particular two rectangular platforms (6 and 7) with dimensions of about 45×55 m are well visible. The number 3 denotes a mound whose dimensions are about 32×35 m, whereas 4 and 5 indicate other features possibly referable to mounds, as well. The image shows also the presence of marks produced by partially surfacing enclosure walls which border the southern, eastern and western sides of the complex of platforms and mounds (with dimensions equal respectively to 326, 68 and 130 m). Other features could be related to another smaller enclosure which seems to be connected to mounds 3 and 5. Because of the low contrast of the features, in particular related to platforms and some mounds, the images have been enhanced by using PCA, as shown in Fig. 4b). Among the computed components, the first (PC1) provided the best performance. This is in perfect accordance with the fact that the first PCA substantially provides an average of all the input spectral channels, e.g. a map very close to the brightness of the scene quite similar to the panchromatic image. www.adv-geosci.net/19/75/2008/
N. Masini et al.: Remote sensing archaeology in Cahuachi (Peru)
Fig. 4. Sector B: panchromatic image (a) and PCA1 product (b).
In particular, the comparative visual inspection puts in evidence a significant improvement obtained by PC1 for the shadow marks linked to shallow structures which mainly characterize the platforms (see Fig. 5a–b). Whereas the soil marks which reveal the surface clayed walls of the enclosure are well visible both in the panchromatic and the PC1 map (Fig. 5c). Finally, results from ground survey clearly showed that two different types of spatial anomalies were detected and they were linked to two types of archaeological features: (i) shadow marks originated by the differences in height of very shallow walls covered by a layer of sand and cobbles and other incoherent material of alluvial origin. In Fig. 2, left side, the shadow marks are shown with the height of the sun specifically computed for the acquisition time of the satellite data (25 March 2005 at 3 p.m.) (ii) soil and shadow marks: the former caused by partially surface structures, whose prevailing clayey composition make them brighter than the darker alluvial deposits; the www.adv-geosci.net/19/75/2008/
79
Fig. 5. Sector B: platforms 6 and 7 and detail of the enclosure (respectively in a, b and c) observed by the panchromatic (left) and PC1 (right). The comparative visual inspection puts in evidence a significant improvement obtained by PC1 for the shadow marks which mainly characterize the platforms.
latter originated by the differences in height of the same structures. Figure 2, right side, shows the combined effect of soil and shadow-marks.
5 5.1
GPR prospections Field data acquisition and processing
The GPR technique has been applied in sector A on the NW of Gran Piramide. The aim of prospections was the detection of potential connection structures between the Gran Piramide and the Piramide de Naranja, by estimating shape and depth (Fig. 6). The relatively low geophysical parameters (resistivity and dielectric constant) contrast between the buried archaeological walls (adobe clay structure) and the sandy and clayey material which characterises the subsurface geology was the key Adv. Geosci., 19, 75–82, 2008
80
N. Masini et al.: Remote sensing archaeology in Cahuachi (Peru) which covers the archaeological objects will be higher, in fact the hyperbola analysis estimated a value around 0.15 m/ns. Therefore, by exploiting the estimated em velocity, for the 400 MHz antenna, the time range of 30 ns corresponds to a maximum investigated depth around to 2 m. 5.2
Fig. 6. The investigated area by GPR.
problem for illuminating the geometry of the buried structures (for the acquisition methodology, see Chianese et al., 2004; Rizzo et al., 2005) In correspondence to a number of areas, we carried out several GPR profiles, using the Subsurface Interface Radar (SIR) 3000 manufactured by Geophysical Survey Systems. The SIR 3000 consists of a digital control unit with keypad, VGA video screen and connector panel. The unit is backpack portable, requiring one or two operators, and the antenna used was the 400 MHz (by GSSI) which is a monostatic type. The GPR acquisitions were on in continuous mode with a two-way time range of 40 ns, and an interval band pass filter of 100–800 ns. The survey was acquired without a “wheel accessory”, so that a speed variation could occur. However, a reference metre rule was located along each profile and marked at each meter, and this has allowed us to adopt a distance normalization (DN) to mitigate uncertainties on the antenna positions. The ReflexW software (Sandmeier, 2000) has been used to process the data. The high quality of the traces requires only standard analysis techniques for data processing and reducing the background noise (normalization, zero time correction, background removal processing). In order to estimate the average electromagnetic wave velocity, a wall of known thickness fitted with a metallic plate was used to gain a maximum reflection of em waves. A velocity of about 0.1 m/ns has been estimated observing the half two-travel time of the corresponding metallic plate reflection. Therefore, the em velocity of the geological material Adv. Geosci., 19, 75–82, 2008
Results
In this paper, GPR profiles carried out in the area of Fig. 6b will be presented and discussed. The investigated area is between the Piramide de Naranja, and a square (plaza undida). The aim of georadar prospections was to find possible structures which connect the temple with the square. The area of investigation was defined by a grid of 20 m×10 m. 21 parallel profiles were carried out using a step-size of 1 m but of different lengths (Fig. 6b) though remaining between the survey lines. The GPR profiles of the investigated area show the same kind of reflections which could be associated which buried walls, floors, archaeological objects and geological formations. Herein, we focus on some specific profiles highly representative of the final results. The parallel profiles in Fig. 7 are the profiles R13 and R14, which are 10 m long, have an interval distance of 1 m and an investigation depth of around 2 m (with v=0.15 m/ns). The GPR profiles point out several reflections up to 15 ns (about 1 m). In detail two mean reflections are visible in profile R13: one between x=3 m and x=4 m at a depth of around 10 ns (about 0.75 m) and one dip between x=4 m and x=6.5 m at a depth of between 0.55 m and 0.30 m. The same results are visible in profile R14 but all of them have shifted between x=4 m and x=7.5 m. The smaller reflection on the left part could be associated with the presence of a buried wall. The dip reflection could be associated with a geological layer which covers the buried wall or a floor behind the wall at the external part of the pyramid. Moreover, several hyperbolas are visible in profile R13, which could be associated with stones or buried archaeological objects. The GPR investigations were confirmed by the presence of a wall which was unearthed during the excavations carried out two weeks later, thus providing valuable information on the connecting structures between the Gran Piramide and the Piramide de Naranja (Fig. 8).
6
Conclusions
The use and development of remote sensing data integration methods for supporting archaeological prospection is highly desirable and this can be particularly effective for enhancing subtle anomalies such as those linked to the presence of buried adobe structures. In this paper, both satellite Quickbird (QB) images and Ground Probing Radar (GPR) have been analysed in order to assess their capability in detecting buried archaeological www.adv-geosci.net/19/75/2008/
N. Masini et al.: Remote sensing archaeology in Cahuachi (Peru)
81
Fig. 7. GPR profiles R13 and R14.
adobe structures. Such an assessment was performed for two significant test areas selected from within the Ceremonial Centre of Cahuachi in Southern Peru. Our preliminary results pointed out the feasibility of VHR satellite and GPR data for identifying buried, shallow and surface adobe walls. Results from the ground survey clearly showed that two different types of spatial anomalies were detected and that they were linked to two types of archaeological features: – shadow marks originated by the differences in height of very shallow walls covered by a layer of sand and cobbles and other incoherent material of alluvial origin. – soil marks caused mainly by partially surface structures, whose prevailing clayey composition make them brighter than the darker alluvial deposits; Both of these features were detected by using panchromatic scene along with the first component of PCA. As a whole, the detected features provided valuable information useful for the characterization of the layout of mounds, platforms and enclosures which compose sector B of the Ceremonial Centre of Cahuachi. GPR also proved capable of detecting buried adobe structures as confirmed by the archaeological excavations which unearthed a wall, thus providing important information on the masonry connection system around the Gran Piramide of Cahuachi. Edited by: L. V. Eppelbaum Reviewed by: two anonymous referees
www.adv-geosci.net/19/75/2008/
Fig. 8. (left) GPR data acquisition: on the background the Gran Piramide; (right) detail of the wall unearthed by the archaeologists.
References Chianese, D., D’Emilio, M., Di Salvia, S., Lapenna, V., Ragosta, M., and Rizzo, E.: Magnetic Mapping, Ground Penetrating Radar Surveys and Magnetic Susceptibility Measurements for the Study of the Archaeological Site of Serra di Vaglio (Southern Italy), J. Archaeol. Sci., 31, 633–643, 2004. Kvamme, K., Ernenwein, E., Hargrave, M., Sever, T., Harmon, D., and Limp, F.: New Approaches to the Use and Integration of Multi-Sensor Remote Sensing for Historic Resource. Identification and Evaluation, Report of SERDP Project, SI-1263, 2006. Lasaponara, R. and Masini, N.: Performance evaluation of data fusion algorithms for the detection of archaeological features by using satellite QuickBird data, in: Space to place, edited by: Campana, S. and Forte, M., Proceedings of 2nd International Conference on Remote Sensing in Archaeology (Rome, 4–7 December 2006), BAR International Series, 13–20, 2006. Lasaponara, R. and Masini, N.: On the potential of Quickbird data for archaeological prospection, Int. J. Remot. Sens., 27(15–16), 3607–3614, 2006. Linford, N.: The application of geophysical methods to archaeological prospection, Report of Progress in Physics, 69, 2205–2257,
Adv. Geosci., 19, 75–82, 2008
82 2006. Lascano, E., Osella, A., De La Vega, M., Buscaglia, S., Senatore, X., and Lanata, J. L.: Geophysical prospection at Floridablanca archaeological site, San Julian Bay, Argentina, Archaeological Prospection, 10(3), 175–192, 2003. Montoya, M., Grac`ıa, W., and Caidas, J.: Geolog`ıa de los Quadrangulos de Lomitas, Palpa, Nasca y Puquio, INGGEMET (Istituto Geologico Minero y Metallurgico), Lima, 1994. Orefici, G.: Nasca, Archeologia per una ricostruzione storica, Jaca Book, 1992. Orefici, G.: Nasca, Arte e societ`a del popolo dei geoglifi, Jaca Book, Milano, 1993.
Adv. Geosci., 19, 75–82, 2008
N. Masini et al.: Remote sensing archaeology in Cahuachi (Peru) Rizzo, E., Chianese, D., and Lapenna, V.: Integration of magnetometric, gpr and geoelectric measurements applied to the archaeological site of Viggiano (Southern Italy, Agri Valley- Basilicata), Near Surface Geophysics, 3, 13–19, 2005. Sandmeier, K. J.: Reflexw 2.1 Manual. Sandmeier Software: Zipser Strabe 1, 76227 Karlsruhe, Germany, 2000. Silverman, H.: Cahuachi in the Ancient Nasca World, University Of Iowa Press, 1993. Zhang, Y.: Understanding Image Fusion, Photogrammetric Engineering and Remote Sensing, 70, 657–661, 2004.
www.adv-geosci.net/19/75/2008/