Hindawi Publishing Corporation Computational Intelligence and Neuroscience Volume 2015, Article ID 620360, 12 pages http://dx.doi.org/10.1155/2015/620360
Research Article Fuzzy Inference System Approach for Locating Series, Shunt, and Simultaneous Series-Shunt Faults in Double Circuit Transmission Lines Aleena Swetapadma and Anamika Yadav Department of Electrical Engineering, National Institute of Technology, Raipur 492010, India Correspondence should be addressed to Anamika Yadav;
[email protected] Received 20 June 2015; Accepted 4 August 2015 Academic Editor: Elio Masciari Copyright © 2015 A. Swetapadma and A. Yadav. This is an open access article distributed under the Creative Commons Attribution License, which permits unrestricted use, distribution, and reproduction in any medium, provided the original work is properly cited. Many schemes are reported for shunt fault location estimation, but fault location estimation of series or open conductor faults has not been dealt with so far. The existing numerical relays only detect the open conductor (series) fault and give the indication of the faulty phase(s), but they are unable to locate the series fault. The repair crew needs to patrol the complete line to find the location of series fault. In this paper fuzzy based fault detection/classification and location schemes in time domain are proposed for both series faults, shunt faults, and simultaneous series and shunt faults. The fault simulation studies and fault location algorithm have been developed using Matlab/Simulink. Synchronized phasors of voltage and current signals of both the ends of the line have been used as input to the proposed fuzzy based fault location scheme. Percentage of error in location of series fault is within 1% and shunt fault is 5% for all the tested fault cases. Validation of percentage of error in location estimation is done using Chi square test with both 1% and 5% level of significance.
1. Introduction In general, the transmission line faults are categorized into series faults and shunt faults. Unlike the shunt faults, which are characterized by substantial increase in current flow, the low magnitude of current following a series fault makes it difficult to be located by conventional approaches based on calculation of impedance and using fundamental component of current and voltage. Series fault is defined as a fault for which the impedances of the three phases are not equal, which is usually caused by the interruption of one or two phases. Series faults in EHV lines may occur due to broken conductor or a circuit breaker malfunction in one or more phases. The broken conductor leads to unbalance and flow of asymmetrical current arising because of the open conductor coming in series with the effected lines. As per field studies, a series fault may occur due to one of the following reasons: (i) Broken conductor(s) due to storm, falling of trees. (ii) When poles of the circuit breakers fails to open.
(iii) Opening of jumpers at tension tower (angle locations) due to accident and storms. (iv) Mechanical failure of jumpers. (v) Burning of jumper cones due to local heating at joints because of loose contacts/high contact resistance during prolonged operation. Although series fault is not dangerous to the system, the operation of the load connected is hampered. The numerical distance relays, which are widely used for protection of transmission lines, only give an alarm that particular phase(s) is/are open, but no trip command is issued to the circuit breaker. Further the distance relays are unable to locate the open conductor (series) fault. Faults in transmission lines affect the power flow and reduce the reliability of transmission system. Fault location estimation is an important task in transmission system for carrying out maintenance work to improve power flow reliability and reduce repairing expenses. Some research has been done to detect the open conductor/series fault. Open phase conductor detector system
2 is described in [1] consisting of transmitters and receiver where transmitter(s) detects the open phase conductor by monitoring the phase conductor voltage using redundant inputs. Carrier communication is used for open conductor detection in [2]. Open conductor fault calculation in four parallel transmission lines using twelve-sequence component methods is discussed in [3]. ANN based techniques are used for enhancement of distance relay performance against open conductor in HV transmission lines in [4]. However these schemes [1–4] are unable to find the location of series/open conductor fault. There are many schemes reported for shunt fault location estimation. Phasor measurements units (PMU) are used by many researchers nowadays for finding the location of shunt faults in transmission lines [5–17]. Phasor measurement fault location algorithms can be categorized as synchronized [5– 9] and unsynchronized [10–14]. Synchronized measurement can be achieved using global positioning system (GPS) and high speed broad band communication system. GPS has a remote telemetry unit which provides the synchronized data through transmission control center [5]. Fault analysis functions, such as fault detection, classification, and location, are implemented for a transmission line using synchronized samples from two ends of a line in [6]. Traveling-wave based fault location techniques for transmission grids using synchronized voltage measurements are proposed in [7]. Synchronized current measurement from both ends and voltage measurement from one end are used for fault location estimation in [8]. In [9] only half cycle of the postfault synchronized voltage and current samples from both ends of the line are taken to estimate location of fault. Fault locations are also estimated using two-end unsynchronized phasor measurement in series-compensated lines [10–12]. Shunt fault location estimation algorithms can be categorized in terms of using one-end data [13–17] and two-end data [6, 7, 9–12]. Phase coordination approach using one-end data for fault location estimation is proposed in [13, 15, 16]. Differential equation approach using one-end data is proposed in [14, 17]. Fault distance is also estimated using modal theory by taking two-terminal data [11]. It is noteworthy to mention here that these schemes [5–17] are not applicable for series/open conductor fault location estimation task. Fault location algorithms for shunt faults are reported by researchers using different soft computing techniques like artificial neural network (ANN) [18–21], fuzzy [22] and adaptive neurofuzzy inference system (ANFIS) [23], SVM [24], and so forth. Among all the soft computing techniques, fuzzy inference system is used mostly in engineering applications, for example, fault classification [25], due to its easy implementation and less computation work to get accurate results unlike other training based soft computing methods. Moreover there is a chance that simultaneous series and shunt faults may occur in the transmission line as discussed in [26, 27] which can lead to incorrect operation of relay. Digital distance relaying scheme which takes care of a simultaneous open conductor and ground fault occurring coincidently on the same phase at the same point on a series-compensated double circuit line is proposed in [28]. But the scheme treats
Computational Intelligence and Neuroscience the simultaneous open conductor and ground fault as single line to ground fault. Hence, it can be concluded that, hitherto, none of the earlier reported papers [1–28] can locate both series and shunt faults and simultaneous series-shunt faults. In this paper, a method is proposed using synchronized phasors and fuzzy logic to classify the fault and estimate fault location of series faults, shunt faults, and simultaneous series and shunt faults. The proposed fuzzy based method works in three stages. In the first stage, the current and voltage signals obtained from both ends of the line are preprocessed to calculate the fundamental components and zero-sequence component of current signals. Thereafter, two fuzzy modules for fault classification have been designed to discriminate the type of fault, that is, whether series fault or shunt fault or simultaneous series and shunt fault has occurred. Further, according to the type of fault, a particular fuzzy module for fault location of series or shunt or simultaneous series or shunt will be activated which finds the location of fault in kilometers from the relaying point.
2. Fuzzy Inference System (FIS) and Its Application Fuzzy inference system is chosen to locate the faults in transmission lines in this work because it is easy to implement and it does not require training module to produce outputs. Due to less computation work than other soft computing techniques fuzzy system is chosen. Fuzzy inference system deals with fuzzy logic which starts with the concept of a fuzzy set. A fuzzy set is a set without a crisp, clearly defined boundary. It can contain elements with only a partial degree of membership. A fuzzy set can be defined by the following expression: 𝐴 = {(𝑥, 𝜇𝐷 (𝑥)) 𝐼𝑥 ∈ 𝑋, 𝜇𝐷 (𝑥) ∈ [0, 1]} ,
(1)
where 𝑋 represents the universal set, 𝑥 is an element of 𝑋, 𝐷 is a fuzzy subset in 𝑋, and 𝜇𝐷(𝑥) is the membership function of fuzzy set 𝐷. FIS chosen to be used here is “Mamdani” type because it expects the output membership functions to be fuzzy sets. As fuzzy logic used here is to estimate the location of fault which is not a fixed value, so it is better to use Mamdani method than to use Sugeno method. Membership functions are designed with various membership functions like Gauss, triangular, trapezoidal, and sigmoid functions and so forth. In this work input and output are designed with triangular member function because it has lowest error in location. The triangular membership function is a function of a vector, 𝑥, and depends on three scalar parameters, 𝑎, 𝑏, and 𝑐, as given by (2) or (3). Consider the following: 0, { { { { 𝑥−𝑎 { { { {𝑏 − 𝑎 𝑓 (𝑥; 𝑎, 𝑏, 𝑐) = { { {𝑐 − 𝑥 { , { { { {𝑐 − 𝑏 {0,
𝑥≤𝑎 𝑎≤𝑥≤𝑏 (2) 𝑏≤𝑥≤𝑐 𝑐≤𝑥
Computational Intelligence and Neuroscience
3
or 𝑓 (𝑥; 𝑎, 𝑏, 𝑐) = max (min (
𝑥−𝑎 𝑐−𝑥 , ) , 0) . 𝑏−𝑎 𝑐−𝑏
(3)
Fuzzy sets and fuzzy operators are the subjects and verbs of fuzzy logic. If-then rule statements are used to formulate the conditional statements that comprise fuzzy logic. A single fuzzy if-then rule assumes the form as shown in IF 𝑥 is 𝐴 THEN 𝑦 is 𝐵,
(4)
where 𝐴 and 𝐵 are linguistic values defined by fuzzy sets on the ranges 𝑋 and 𝑌, respectively. From the inputs impedance values their membership values are obtained. This process is called “input fuzzification.” From the consequent of each rule (a fuzzy set) and the antecedent value obtained a fuzzy implication operator is applied to obtain a new fuzzy set. Implication method used here is “minimum” which truncates the consequent’s membership function and the product which scales it. Then it combines the outputs obtained for each rule into a single fuzzy set, using a fuzzy aggregation operator which is “maximum” in this case. The fuzzy set is then transformed into a single numerical value. Defuzzification method used here is the “centroid” method which returns the centre of the area under the fuzzy set. Center of gravity method is a grade weighted by the areas under the aggregated output functions. The centroid defuzzification method can be given as in 𝑍∗ =
∫ 𝜇𝑐 (𝑧) 𝑧 𝑑𝑧 ∫ 𝜇𝑐 (𝑧) 𝑑𝑧
,
(5)
where ∫ 𝜇𝑐 (𝑧)𝑑𝑧 ≠ 0 for all 𝜇𝑖 . By following all these steps described above fuzzy module is designed for fault classification and location estimation module. Detailed fuzzy design of the proposed fault location schemes for series faults, shunt faults, and simultaneous series and shunt faults will be described in next section.
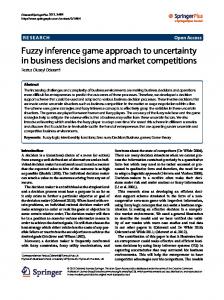
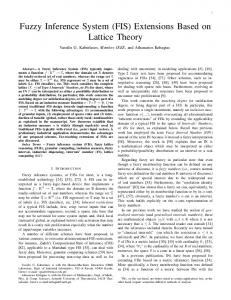
3. Proposed Fuzzy Based Series, Shunt, and Simultaneous Series and Shunt Faults Classification and Location Estimation Proposed method uses synchronized phasor measurements and fuzzy inference system to estimate the fault location. Steps followed in the proposed method are described in Figure 1 for the estimation of fault location and are described in following subsections. 3.1. Power System Network. The utility electrical power plant system selected for modelling is the existing 400 kV transmission line between Korba NTPC to Raipur PGCIL in Chhattisgarh state. Length of the transmission line is 220 km between Korba to Raipur as shown in Figure 2. Power transfer through the double circuit line is 341 MW. Synchronized phasors of currents and voltages are preprocessed using Discrete Fourier Transform (DFT) and sequence analyzer. Fundamental component of current and voltages is obtained
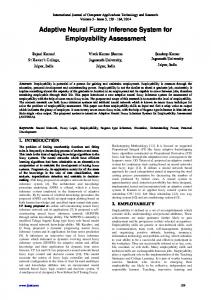
using DFT. Zero-sequence currents are obtained using the sequence analyzer in order to determine whether ground is involved in the fault loop or not. 3.2. Design of Fuzzy Module for Classification of Series Fault (FIS-CSR) and Shunt Fault (FIS-CSH). For classification of type of faults, the fundamental components and zerosequence components of currents of both ends are taken. Two different FIS modules are designed, one for classification of series fault (FIS-CSR) and the other for classification of shunt fault (FIS-CSH). In this present study Mamdani type FIS has been used because its outputs are in fuzzy sets. 3.2.1. Fuzzy Module for Classification of Series Fault (FISCSR). A single FIS module has been designed for detecting the presence of fault in a particular phase. The same FIS has been used for the other two phases. Each phase FIS module takes its fundamental phase current as input and provides single output representing the presence of fault in that phase by trip high (TH) or trip low (TL) for no fault condition. The fundamental components of three phase currents of both circuits measured at both ends of the line are used as input for fault classification. Fundamental component of current 𝐼𝑓 is set to certain range which corresponds to fault or no fault in each phase. Three ranges of 𝐼𝑓 are selected using triangular member function, that is, 𝐼𝑓 low, 𝐼𝑓 medium, and 𝐼𝑓 high. The output trip logic also contains two ranges of triangular member function, that is, trip low (TL) (0) and trip high (TH) (1). The degree of membership functions for input phase fundamental current is shown in Figure 3(a) for series faults. FIS-CSR has six outputs corresponding to the three phases of the parallel lines (double circuit lines). The rules designed for faulty phase identification and fault classification are as follows: (1) If fundamental phase current is 𝐼𝑓 low or 𝐼𝑓 medium then trip is TH. (2) If fundamental phase current is 𝐼𝑓 high then trip is TL. Fuzzy inference system for fault classification of series fault (FIS-CSR) takes the fundamental current of each phase as input and produces the state of each phase (whether faulty or not) as output. 3.2.2. Fuzzy Module for Classification of Shunt Fault (FISCSH). The shunt faults are classified into phase to ground (LG), double phase to ground (LLG), phase to phase (LL), and three-phase (LLL) faults. As discussed in Section 2, for faulty phase identification, the fundamental components of three phase currents are taken as input to FIS-CSH for classification of phases. Further, for ground identification, separate FIS module has been designed which takes the zero-sequence current signals of the two circuits 1 and 2 as input. Each input’s signals are distributed in three ranges with triangular member function, that is, low, medium, and high. There are six outputs for faulty phase identification corresponding to the three phases of circuit 1: A1, B1, and C1 and A2, B2, and C2 of circuit 2 which becomes high
4
Computational Intelligence and Neuroscience
Obtain the synchronized current and voltage signals at both ends of the line
GPS Bus 1
Bus 2
Raipur PGCIL 400 kV
Korba NTPC 400 kV Relay
Obtain the fundamental component of current and voltage signals and zerosequence currents
Relay
Design different fuzzy modules for fault classification (FIS-CSH and FIS-CSR) and fault location (FIS-LSR and FIS-LSH (LG, LLG, LL, LLL))
Take fundamental component of currents and zero-sequence component of current at both ends of the line and test the fuzzy modules for fault classification of shunt or series fault (FIS-CSH and FIS-CSR)
Take the fundamental current component of current of any fault phase
“Series fault” or “shunt fault” Shunt
Series
Find Z = V/I for each fault’s phases at sending end where V is fundamental voltage and I is fundamental current
Both Activate FIS-LSR at sending end of relay
Activate FIS-LSR and FISLSH at respective fault end of relay
Obtain the fault type and activate corresponding FISLSH at sending end
Series fault location (km) in time domain Series fault location and shunt fault location (km) in time domain
Shunt fault location (km) in time domain
Figure 1: Flow chart of proposed method.
(1) in case of fault and otherwise remains low (0). The degree of membership functions for input current is shown in Figure 3(b) for shunt fault phase identification and in Figure 3(c) for ground identification. The rules designed for faulty phase identification are as follows: (1) If fundamental phase current is 𝐼𝑓 low or 𝐼𝑓 medium then trip is TL. (2) If fundamental phase current is 𝐼𝑓 high then trip is TH. Further the rules used for ground identification are as follows: (1) If zero-sequence current is 𝐼𝑧 low or 𝐼𝑧 medium then trip is TL. (2) If zero-sequence current is 𝐼𝑧 high then trip is TH. 3.3. Design of Fuzzy Module for Fault Location. Once the fault is detected and its type is identified, then the next task of protective relaying scheme is to estimate the fault
location from the relaying point. In this study, two separate FIS modules have been designed for series fault (FIS-LSR) and shunt fault (FIS-LSH). Based on type of fault that has occurred in the monitored transmission line, that is, whether series fault or shunt fault or simultaneous series-shunt fault, the corresponding fuzzy module for fault location will be activated which estimates the location of fault. 3.3.1. Fuzzy Module for Series Fault Location (FIS-LSR). During series fault, the fundamental component of current signals is the same in all the faulted phases for fault at a particular location (either single phase open fault or multiple phase open faults). Hence only one faulty phase fundamental current is taken as input for design of fuzzy location module for series faults. The block diagram of fuzzy module designed for fault location estimation of series faults (FIS-LSR) is shown in Figure 4(a). Fundamental components of current values are divided into ranges like 𝐼1 , 𝐼2 , 𝐼3 , . . . , 𝐼112 using triangular member functions. Output represents the fault location in kilometers which is divided into 111 ranges using triangular member
Computational Intelligence and Neuroscience
5 KSTPS Gen. 2 3 ∗ 210 MW 15.75 kV
KSTPS Gen. 1 4 ∗ 500 MW 21 kV
220 km
0.0 0.0
−26.2 39.2 −26.2 −155.0 39.2 −38.3
−155.0 -38.3
196 km
393.0 −13.3
336.1 −17.1
336.1 −17.1
−388.3 −28.8
3 ∗ 315 MW 220/400 kV
0.0 0.0 0.0 0.0
−233.2 −137.3 −388.3 −13.0 −388.3 −13.0
15.72 km Towards Bhilai
Raipur PGCIL
Towards Jindal Tamnar Towards Sipat
345 km
Korba NTPC (45.63)
Lanko generation 2 ∗ 300 MW
−56.1 107.7 148 km −56.1 107.7 456.4 −23.2 254 km 456.4 −23.2
220 km
Towards Chandrapur 345 km
807.6 −14.3
1211.3 68.0 45 km −399.4 89.6 41.4 −89.7 25.9 0.2
−341.3 49.9
28.4 −341.3 −24.6 49.9
−396.1 27.6 28.4 −24.6
−28.3 −396.1 −70.4 27.6 Towards Bhilai 198 km
0.0 0.0
3 ∗ 240 MVA 21/400 kV
4 ∗ 600 MVA 21/400 kV
Towards Korba 17 km Westbank
Towards Wardha
Towards Birsinghpur
215 km
−155.0 −38.3
Towards Vindhyachal
Raipur PGCIL (37.14)
360 km
Bus reactors: 1 ∗ 50 MVAR + 1 ∗ 125 MVAR + 1 ∗ 80 MVAR
Line reactors: 3 ∗ 50 MVAR + 4 ∗ 63 MVAR + 1 ∗ 80 MVAR
225 km
Towards Raigarh
0.8 0.4 0
If medium
If low
0
200
400
If high
600 800 Input current
1000
1200
Degree of membership
Degree of membership
Figure 2: Existing 400 kV transmission line between Korba NTPC to Raipur PGCIL in Chhattisgarh.
0.8 0.4 0
If medium
If low
0
1000 2000 3000 4000 5000 6000 7000 8000 9000 10000 Input current
(a) Series fault
Degree of membership
If high
(b) Shunt fault, phase identification Iz low
0.8 0.4 0
0
Iz medium
Iz high
500
1000
1500 2000 Input current
2500
3000
(c) Shunt fault, ground identification
Figure 3: Degree of member function for (a) series fault, (b) shunt fault phase identification, and (c) shunt fault ground identification.
function like 𝐿 1 , 𝐿 2 , 𝐿 3 , . . . , 𝐿 111 . Total number of rules designed for series fault location is 112 as given below: (1) If input is 𝐼1 then location is 𝐿 1 . (2) If input is 𝐼2 then location is 𝐿 2 . .. .
(111) If input is 𝐼111 then location is 𝐿 111 . (112) If input is 𝐼112 then location is 𝐿 1 . 3.3.2. Fuzzy Module for Shunt Fault Location (FIS-LSH). For designing fault location module for shunt faults using fuzzy
6
Computational Intelligence and Neuroscience
If of one of the faulty phases
Fault location in time domain
FIS-LSR
(a)
Z of faulty phase
Z of faulty phase 1 (Zi ) Z of faulty phase 2 (Zii )
FIS-LSH (LG)
Z of faulty phase 1 (Zi )
Fault location in time domain
Z of faulty phase 2 (Zii )
FIS-LSH (LLG)
Fault location in time domain
Z of faulty phase 1 (Zi ) FIS-LSH (LL)
Fault location in time domain
Z of faulty phase 2 (Zii )
FIS-LSH (LLL)
Z of faulty phase 3 (Ziii )
Fault location in time domain
(b)
Figure 4: Fuzzy modules: (a) series FIS-LSR and (b) shunt FIS-LSH for fault location.
inference system, the phase impedance 𝑍 is calculated for faulty phase(s) from 𝑍=
𝑉𝑓 𝐼𝑓
,
(6)
where 𝑉𝑓 is fundamental component of voltage and 𝐼𝑓 is fundamental component of current. 𝑍 is taken as input to the fuzzy module for fault location estimation of shunt faults. Different fuzzy modules for different types of fault (LG, LLG, LL, and LLL) for fault location estimation are designed. Based on type of fault which has occurred in the system identified by fault classification module, the corresponding FIS-LSH will be activated and fault location will be estimated. Figure 4(b) shows the fuzzy based fault location modules (FIS-LSH) of different types of shunt fault; impedance (𝑍) of faulty phase is taken as input to fuzzy module and fault location is estimated. In Figure 4(b), it is clear that for LG faults there will be only one input 𝑍 as only one phase is faulty. Fundamental components of impedance (𝑍) are divided into a number of ranges like 𝑍1 , 𝑍2 , 𝑍3 , . . . , 𝑍56 using triangular member functions. Output fault location is also divided into ranges using triangular member function like 𝐿 1 , 𝐿 2 , 𝐿 3 , . . . , 𝐿 55 . Total number of rules made for LG shunt fault location is 56. The rules are given below: (1) If input is 𝑍1 then location is 𝐿 1 . (2) If input is 𝑍2 then location is 𝐿 2 . .. . (55) If input is 𝑍55 then location is 𝐿 55 . (56) If input is 𝑍56 then location is 𝐿 1 . For LLG and LL faults, there are two inputs to the fuzzy module as shown in Figure 4(b). Fundamental components
of impedance values for faulty phase 1 (𝑍i ) and phase 2 (𝑍ii ) are divided into ranges like 𝑍i1 , 𝑍i2 , 𝑍i3 , . . . , 𝑍i56 and 𝑍ii1 , 𝑍ii2 , 𝑍ii3 , . . . , 𝑍ii56 using triangular member functions. Output fault location is also divided into ranges using triangular member function like 𝐿 1 , 𝐿 2 , 𝐿 3 , . . . , 𝐿 55 . The rules for LLG faults are given hereunder. Similarly LLL fault location module is designed using three inputs for location estimation as shown in Figure 4(b): (1) If input 1 is 𝑍i1 and input 2 is 𝑍ii1 then location is 𝐿 1 . (2) If input 1 is 𝑍i2 and input 2 is 𝑍ii2 then location is 𝐿 2 . (3) If input 1 is 𝑍i3 and input 2 is 𝑍ii3 then location is 𝐿 3 . .. . (55) If input 1 is 𝑍i55 and input 2 is 𝑍ii55 then location is 𝐿 55 . (56) If input 1 is 𝑍i56 and input 2 is 𝑍ii56 then location is 𝐿 1. 3.3.3. Simultaneous Series and Shunt Fault Location. If both series and shunt fault classification FIS modules (FIS-CSH and FIS-CSR) detect the presence of fault, then simultaneous series and shunt fault has occurred. In case of simultaneous series and shunt faults, location of series fault will be obtained using one-end measurement and that of shunt fault will be obtained using remote end measurement. For simultaneous series and shunt faults, FIS-LSR is activated for series fault end and FIS-LSH is activated for shunt fault end, which determines the location of respective fault.
4. Results and Discussion Performance of the proposed method is evaluated by varying different fault parameters like fault type, fault location, and
Computational Intelligence and Neuroscience
X: 80.5 Y: 1 Z: 1
160 140 120 100 60 80 ms) 20 40 Time ( X: 60.63 Y: 1 Z: 0
1 0.9 0.8 0.7 0.6 0.5 0.4 0.3 0.2 0.1 0 G2 C2 Ou B2 t p shu ut o A2 n G1 ff t fau f lty ault c uzzy b C1 B1 pha lass a A1 se i ifie sed den r an d tifi er Level of output
Level of output
1 0.9 0.8 0.7 0.6 0.5 0.4 0.3 0.2 0.1 0 C2 Ou B2 ser tp fau ies f ut of A2 C1 lty aul fuz B1 ph t cl zy ase ass ba A1 ide ifier sed nti an fie d r
7
120 140 80 100 60 40 (ms) 20 Time
(a)
160
(b)
fault inception angle. Fault resistance in case of shunt faults is kept constant (𝑅𝑓 = 0.001 Ω) in proposed method. The FIS module is designed to give output fault location as 500 km during no fault/normal operating condition and during faulty condition; it will give an estimated fault location as output. The percentage of error in fault location estimation is calculated using (7). The test results for different series faults, shunt faults, and simultaneous series and shunt faults are discussed in detail in this section: % Error [Actual Fault Location − Estimated Fault Location] = Total Line Length
(7)
∗ 100.
4.1. Series Fault Classification and Location Estimation. The proposed scheme involves two stages; first is fault classification and then location estimation. In the first stage, both the FIS modules FIS-CSR and FIS-CSH are tested to detect the fault and classify the fault type, that is, whether the fault is series or shunt fault. For example, a series fault in A1 phase has occurred at 60 ms time and 64 km away from the relaying point; the test result of both the FIS is shown in Figure 5. Figure 5(a) shows the six outputs of FIS-CSR which become high (1) after 80.5 ms for phase A1 only depicting that the fault is series fault in A1 phase of circuit 1 while Figure 5(b) shows that the outputs of FIS-CSH are all low (0) confirming that there is no shunt fault in the system. Once the fault type is classified as series fault, the corresponding FIS module for series fault location estimation is activated and the output of FIS-LSR during a series fault in phase A1 at 64 km at 60 ms time is shown in Figure 6. The estimated fault location is 63 km after 88 ms time as shown in Figure 6. Further the proposed scheme is also tested for different series faults with varying fault location and inception angle and some of the results of proposed fault location scheme are given in Table 1.
Output of FIS-LSR (km)
Figure 5: Output of fuzzy based fault classification modules during A1 phase series fault at 64 km in 60 ms time. (a) FIS-CSR and (b) FIS-CSH.
600
X: 60 Y: 499.9
500 400 300 200
X: 88 Y: 63
100 0
20
40
60
100 80 Time (ms)
120
140
160
Figure 6: Output of fuzzy based fault location module FIS-LSR during A1 phase series fault at 64 km at 60 ms time.
The test result shows the high accuracy in determining the fault location with much less % of error. 4.2. Shunt Fault Classification and Location Estimation. The proposed scheme can simultaneously detect the presence of fault and also classify the fault whether it is series or shunt fault as, during no fault or normal condition, all outputs of both the fuzzy modules FIS-CSR and FIS-CSH are low (zero), and in case of any type of fault the corresponding fuzzy classification module output changes its state from low to high after some time. This can be clearly seen from the test results shown in Figure 7 during A1B1G shunt fault in circuit 1 at 50 km at 60 ms time. Figure 7(a) shows that all the outputs of FIS-CSR are low throughout the simulation time (0–160 ms) and Figure 7(b) shows the outputs of FIS-CSH fault module which become high for phases A1, B1, and G1 after 73.54 ms time verifying that it is A1B1G shunt fault in circuit 1. As the fault type classified is LLG type of shunt fault, LLG shunt fault locator estimates the fault location as 50.69 km as shown in Figure 8. Few more other types of shunt fault are tested and results are reported in Table 2.
8
Computational Intelligence and Neuroscience
1 0.9 0.8 0.7 0.6 0.5 0.4 0.3 0.2 0.1 0 G2 O C2 B2 shu utput A2 fau nt fau of fuz G1 C1 z lty l B1 pha t class y bas A1 se i ifie ed den r an d tifi er
X: 73.54 Y: 4 Z: 1
X: 65.59 Y: 2 Z: 1
Level of output
Level of output
1 0.9 0.8 0.7 0.6 0.5 0.4 0.3 0.2 0.1 0 C2 Ou B2 ser tp A2 fau ies f ut of lty aul fuz C1 B1 ph t cl zy ase ass ba A1 ide ifier sed nti an fie d r
160 140 120 100 60 80 s) 20 40 ime (m T
(a)
X: 65.59 Y: 1 Z: 1
X: 60.63 Y: 1 Z: 0
100 120 80 60 40 (ms) 20 Time
140
160
(b)
Figure 7: Output of fuzzy based fault classification modules during A1B1G1 shunt fault at 50 km in 60 ms time. (a) FIS-CSR and (b) FIS-CSH.
Estimated Fault inception Fault location (km) location (km) angle (∘ )
Fault type A1 B2 C1 A2B2 B1C1 C2A2 A1B1C1
0 45 90 135 180 225 270
6 36 66 96 126 156 186
7.000 35.000 66.000 96.000 126.000 157.000 189.000
Error (%) −0.0045 0.0045 0.0000 0.0000 0.0000 −0.0045 −0.0136
Table 2: Test results of shunt faults location estimation. Fault type A1G B2G C1G A2B2G B1C1G C2A2G A1B1 B2C2 C1A1 A2B2C2
Estimated Fault inception Fault location (km) location (km) angle (∘ ) 0 45 90 135 180 225 270 315 0 90
9 29 49 69 89 109 129 149 169 189
9.000 27.000 49.665 70.200 88.640 109.200 132.600 148.200 171.200 195.000
Error (%) 0.0000 0.0090 −0.0030 −0.0050 0.0010 −0.0009 −0.0163 0.0036 −0.0100 −0.0272
4.3. Simultaneous Series and Shunt Faults Location. The simultaneous fault may consist of two different types of fault: series and shunt at the one location or at different locations [27, 28]. For example, consider open circuit in one phase and simultaneously a single phase to ground fault occurring coincidentally on the same phase or different phase at the same location in the transmission line network. A simultaneous
Output of FIS-LSH (km)
Table 1: Test results of series faults location estimation.
X: 60 Y: 500
500 400 300 200
X: 88 Y: 50.69
100 0
20
40
60
80 100 Time (ms)
120
140
160
Figure 8: Output of fuzzy based fault location module FIS-LSH during A1B1G fault at 50 km at 60 ms time.
series and shunt fault is simulated by assuming that one end of the conductor has been broken and fallen to the ground, while the other end of the conductor is hanged on the tension tower without touching the ground. The proposed method is tested for this situation and Figures 9(a)–9(d) show the test results during A1G shunt fault at 80 km from sending end at 60 ms time and simultaneously the other end of A1 phase conductor is open, that is, A1 phase series fault at the same location from sending end but 140 km from remote end bus. The output of proposed FIS-CSR and FIS-LSR during series fault is shown in Figures 9(a) and 9(c) and Figures 9(b) and 9(d) show the outputs of FIS-CSH and FIS-LSH for shunt fault, respectively. From Figure 9 it can be seen that the proposed scheme correctly identifies the fault type and the faulty phase and its location. Proposed fuzzy based method is tested for some other simultaneous series and shunt faults and results are given in Table 3, which corroborate that the proposed scheme works equally well during simultaneous series and shunt faults situation also, as compared to existing schemes which fails.
Computational Intelligence and Neuroscience
9
Table 3: Test results of simultaneous series and shunt fault location estimation. Fault inception angle (∘ ) 0 60 120 180 240 300 0 45 90 135 180 225 270 315 0 90 180 270
Series fault type
Estimated series fault location (km)
Error (%)
Shunt fault type
Estimated shunt fault location (km)
Error (%)
A1 at 200 km from receiving end B1 at 180 km from receiving end C1 at 160 km from receiving end A2 at 140 km from receiving end B2 at 120 km from receiving end C2 at 100 km from receiving end C1 at 209 km from receiving end B2 at 22 km from sending end A1 at 177 km from receiving end A2B2 at 63 km from sending end A1 at 137 km from receiving end B2 at 103 km from sending end C1 at 97 km from receiving end A2 at 143 km from sending end C1A1 at 57 km from receiving end A2B2 at 183 km from sending end A2B2C2 at 203 km from sending end A1B1 at 213 km from sending end
196.000 182.000 161.000 140.000 119.000 98.000 216.000 21.000 182.000 63.000 140.000 105.000 98.000 147.000 56.000 182.000 203.000 215.000
1.818 0.909 0.454 0.000 0.454 0.909 −0.0318 0.0045 −0.0227 0 −0.0136 −0.0090 −0.0045 −0.0181 0.0045 0.0045 0 −0.0090
A1G at 20 km from sending end B1G at 40 km from sending end C1G at 60 km from sending end A2G at 80 km from sending end B2G at 100 km from sending end C2G at 120 km from sending end A1G at 11 km from sending end C2G at 198 km from receiving end B1G at 43 km from sending end C2G at 157 km from receiving end B1C1G at 83 km from sending end C2A2G at 117 km from receiving end A1B1 at 123 km from sending end B2C2 at 77 km from receiving end B1G at 163 km from sending end C2G at 37 km from receiving end A2G at 17 km from receiving end B1G at 7 km from receiving end
18.000 36.000 54.000 76.000 98.000 118.000 9.000 199.000 45.000 165.000 85.800 117.000 124.800 78.000 171.000 36.000 18.000 9.000
0.909 1.818 2.727 1.818 0.909 0.909 0.0090 −0.0045 −0.0090 −0.0363 −0.0127 0.0000 −0.0081 −0.0045 −0.0363 0.00454 −0.0045 −0.0090
Table 4: 𝜒2 test for fault location error for different types of fault. Fault type LG
LLG
LL
LLL
Parameters 𝑓𝑜 𝑓𝑒 2 (𝑓𝑜 − 𝑓𝑒 ) /𝑓𝑒 𝑓𝑜 𝑓𝑒 2 (𝑓𝑜 − 𝑓𝑒 ) /𝑓𝑒 𝑓𝑜 𝑓𝑒 2 (𝑓𝑜 − 𝑓𝑒 ) /𝑓𝑒 𝑓𝑜 𝑓𝑒 2 (𝑓𝑜 − 𝑓𝑒 ) /𝑓𝑒
Range of percentage of error 0% to ±2% ±2% to ±5% 420 140 437.333 122.666 0.686 2.449 440 120 437.333 122.666 0.016 0.057 520 140 515.428 144.571 0.040 0.148 260 60 249.904 70.095 0.407 1.453 2 (𝑓𝑜 − 𝑓𝑒 ) 2 𝜒 [all] = ∑ { } = 4.485 𝑓𝑒
4.4. Validation of % of Error in Fault Location Using Chi Square (𝜒2 ) Test. A large number of fault case studies had been carried out to evaluate the performance of proposed method by varying different fault parameters like types of fault, fault location, and fault inception angle and % of error in location estimation is calculated. The % of error in series faults location estimation lies within 1%; on the other hand the error lies between 0–5% in case of shunt faults; thus it is necessary to validate it using some validation test, for example, Chi square (𝜒2 ) test. Fault location error of shunt faults is divided into two ranges 0 to ±2.0% and ±2.1 to ±5%. Figure 10 shows
∑ 2
∑{
(𝑓𝑜 − 𝑓𝑒 ) } = 3.315 𝑓𝑒
∑{
(𝑓𝑜 − 𝑓𝑒 ) } = 0.073 𝑓𝑒
∑{
(𝑓𝑜 − 𝑓𝑒 ) } = 0.188 𝑓𝑒
2
2
2
∑{
(𝑓𝑜 − 𝑓𝑒 ) } = 0.9092 𝑓𝑒
the percentage of fault cases in which the shunt fault location error is within 0 to ±2.0% and ±2.1 to ±5% ranges. The computed value of 𝜒2 must equal or exceed the appropriate critical value to justify rejection of the null hypothesis at 0.05 or 0.01 level of significance. It shows whether the apparent differences or relationships are true differences/relationships or whether they merely result from sampling error [29]. Chi square test results are shown in Table 4. Fault cases for different range of error according to fault type are the calculated ones which is the observed frequency of error distribution (𝑓𝑜 ). Expected frequency of
10
Computational Intelligence and Neuroscience
Level of output
X: 78.51
X: 75.53 Y: 1 Z: 1
Level of output
1 0.8 0.6 0.4 0.2 0 Ou C2 B2 A2 ser tput C1 B1 ie fau s fau of fuz A1 lty lt c zy ph lass bas ase ifi e ide er a d nti nd fier
X: 60.63 Y: 1 Z: 0
20
100 140 60 (ms) Time
Y: 4 1 Z: 1 0.8 X: 77.52 0.6 Y: 1 Z: 1 0.4 0.2 X: 60.63 Y: 4 0 Z: 0 X: 60.63 G2 C2 Y: 1 B2 A2 Z: 0 140 160 Outp G1 80 100 120 C1 B1 60 shun ut of fu A1 20 40 zz t s) fault fault clas y based Time (m y ph s i fi ase id er and entifi er
600 500 400 300 200 100 0
(b)
X: 60 Y: 499.9 X: 80 Y: 140
20
40
60 80 100 120 140 160 Time (ms)
Output of shunt fault location (km)
Output of series fault location (km)
(a)
600 500 400 300 200 100 0
X: 60 Y: 500
X: 94 Y: 81
20
40
60
80
100
120
140
160
Time (ms)
(c)
(d)
Figure 9: Outputs of fuzzy modules during A1G1 shunt fault at 80 km from sending end at 60 ms time and A1 series fault at 140 km from receiving end. (a) FIS-CSR, (b) FIS-CSH, (c) FIS-LSR, and (d) FIS-LSH. Error analysis
Table 5: Levels of significance for different degrees of freedom.
Number of fault cases
600 500 400
520
Degree of freedom
420 440
300 200
140 120 140
100 0
1 2 3 4 5
260
60 (2–5)% error (0–2)% error Error distribution (%)
Figure 10: % of error distribution for different faults: LG fault, LLG fault, LL fault, and LLL fault.
occurrence of error for each of the cells (column or row) for all types of fault is calculated from the observed frequency of the error using (8). 𝜒2 is calculated for all types of fault for all the ranges of error and shown in Table 4 by using (9). Different levels of significance for different degrees of freedom are shown in Table 5. Degree of freedom can be calculated as per (10). Consider 𝑓𝑒 = [
{(∑ 𝑓𝑐 ) ∗ (∑ 𝑓𝑟 )} ], Total
(8)
where 𝑓𝑒 is the expected frequency of error, 𝑓𝑐 is observed frequencies in columns, 𝑓𝑟 is observed frequencies in rows, and total is the sum of all the frequencies = 2100. Consider 𝜒2 = ∑ {
(𝑓𝑜 − 𝑓𝑒 ) }, 𝑓𝑒
1%
3.84 5.59 7.82 9.49 11.07
6.64 9.21 11.34 13.28 15.09
where 𝑓𝑜 is the observed frequency of error. Consider
LL fault LLL fault
LG fault LLG fault
Level of significance 5%
(9)
𝐷 = (Rows − 1) ∗ (Columns − 1) ,
(10)
where 𝐷 is the degree of freedom. In this method there are 4 rows and 2 columns, so degree of freedom is 3. From Table 5, with degree of freedom 3, calculated 𝜒2 value is less for both 5% and 1% significant levels for all types of fault. This shows that null hypothesis is accepted and the error for fault location will not be the same for replication of experiment. Thus the proposed fuzzy based fault location scheme is accurate and can be used for series and shunt fault location estimation.
5. Conclusion This paper proposes a new approach using synchronized phasor measurement and fuzzy system to classify the series, shunt, and simultaneous series-shunt faults and predict the fault location in a double circuit transmission lines. Proposed method is effective in determining accurate fault location because it is not affected by variation in fault type, fault
Computational Intelligence and Neuroscience inception angle, fault distance, and so forth. Fuzzy inference system used for series and shunt fault location estimation is “Mamdani” type. Fault location error in case of series fault is within 1%, while in case of shunt fault it is up to 5%. So error validation of shunt faults is done using Chi square test. The major contribution of the proposed scheme is that it classifies the fault type (both series and shunt) correctly and estimates the correct value of fault location of series faults and simultaneous series-shunt faults which has not been reported to date.
Conflict of Interests The authors declare that there is no conflict of interests regarding the publication of this paper.
References [1] A. C. Westrom, A. P. S. Meliopoulos, G. J. Cokkinides, and A. H. Ayoub, “Open conductor detector system,” IEEE Transactions on Power Delivery, vol. 7, no. 3, pp. 1643–1651, 1992. [2] E. C. Senger, W. Kaiser, J. C. Santos, P. M. S. Burt, and C. V. S. Malagodi, “Broken conductors protection system using carrier communication,” IEEE Transactions on Power Delivery, vol. 15, no. 2, pp. 525–530, 2000. [3] P. Xu, G. Wang, H. Li, Y. Liang, and P. Zhang, “A new method for open conductors fault calculation of four-parallel transmission lines,” in Proceedings of the Asia-Pacific Power and Energy Engineering Conference (APPEEC ’10), pp. 1–4, IEEE, Chengdu, China, March 2010. [4] M. Gilany, A. Al-Kandari, and B. Hassan, “ANN based technique for enhancement of distance relay performance against open-conductor in HV Transmission Lines,” in Proceedings of the Computer and Automation Engineering (ICCAE ’10), vol. 5, pp. 50–54, Singapore, February 2010. [5] M. J. B. Reddy, D. V. Rajesh, P. Gopakumar, and D. K. Mohanta, “Smart fault location for smart grid operation using RTUs and computational intelligence techniques,” IEEE Systems Journal, vol. 8, no. 4, pp. 1260–1271, 2014. [6] M. Kezunovic and B. Perunicic, “Automated transmission line fault analysis using synchronized sampling at two ends,” IEEE Transactions on Power Systems, vol. 11, no. 1, pp. 441–447, 1996. [7] M. Korkali, H. Lev-Ari, and A. Abur, “Traveling-wave-based fault-location technique for transmission grids via wide-area synchronized voltage measurements,” IEEE Transactions on Power Systems, vol. 27, no. 2, pp. 1003–1011, 2012. [8] C. A. Apostolopoulos and G. N. Korres, “Accurate fault location algorithm for double-circuit series compensated lines using a limited number of two-end synchronized measurements,” International Journal of Electrical Power and Energy Systems, vol. 42, no. 1, pp. 495–507, 2012. [9] J. Sadeh, N. Hadjsaid, A. M. Ranjbar, and R. Feuillet, “Accurate fault location algorithm for series compensated transmission lines,” IEEE Transactions on Power Delivery, vol. 15, no. 3, pp. 1027–1033, 2000. [10] J. Izykowski, E. Rosolowski, P. Balcerek, M. Fulczyk, and M. M. Saha, “Fault location on double-circuit series-compensated lines using two-end unsynchronized measurements,” IEEE Transactions on Power Delivery, vol. 26, no. 4, pp. 2072–2080, 2011.
11 [11] M. Kizilcay and P. La Seta, “A new unsynchronized twoterminals fault location method on series compensated lines,” in Proceedings of the IEEE Russia Power Tech, pp. 1–7, June 2005. [12] M. Fulczyk, P. Balcerek, J. Izykowski, E. Rosolowski, and M. M. Saha, “Fault locator using two-end unsynchronized measurements for UHV series compensated parallel lines,” in Proceedings of the International Conference on High Voltage Engineering and Application (ICHVE ’08), pp. 88–91, IEEE, Chongqing, China, November 2008. [13] M. M. Saha, K. Wikstr¨om, J. Izykowski, and E. Rosolowski, “New concept for fault location in series-compensated parallel lines,” in Proceedings of the IEEE Power Engineering Society Winter Meeting, vol. 2, pp. 769–774, February 2001. [14] E. Rosolowski, J. Izykowski, and M. Saha, “Differential equation based fault location algorithm for series compensated transmission lines,” in Proceedings of the 15th Power Systems Computation Conference (PSCC ’05), Liege, Belgium, August 2005. [15] R. Dutra, L. Fabiano, M. Saha, and S. Lidstrom, “Fault location on parallel transmission lines with series compensation,” in Proceedings of the IEEE/PES Transmission & Distribution Conference & Exposition: Latin America, pp. 591–597, 2004. [16] M. M. Saha, J. Izykowski, E. Rosolowski, and B. Kasztenny, “A new accurate fault locating algorithm for series compensated lines,” IEEE Transactions on Power Delivery, vol. 14, no. 3, pp. 789–795, 1999. [17] G. Song, J. Suonan, and Y. Ge, “An accurate fault location algorithm for parallel transmission lines using one-terminal data,” International Journal of Electrical Power and Energy Systems, vol. 31, no. 2-3, pp. 124–129, 2009. [18] J. Gracia, A. J. Maz´on, and I. Zamora, “Best ANN structures for fault location in single- and double-circuit transmission lines,” IEEE Transactions on Power Delivery, vol. 20, no. 4, pp. 2389– 2395, 2005. [19] A. Yadav and A. Swetapadma, “A single ended directional fault section identifier and fault locator for double circuit transmission lines using combined wavelet and ANN approach,” International Journal of Electrical Power and Energy Systems, vol. 69, pp. 27–33, 2015. [20] A. Swetapadma and A. Yadav, “All shunt fault location including cross-country and evolving faults in transmission lines without fault type classification,” Electric Power Systems Research, vol. 123, pp. 1–12, 2015. [21] S. Ekici, S. Yildirim, and M. Poyraz, “A transmission line fault locator based on Elman recurrent networks,” Applied Soft Computing Journal, vol. 9, no. 1, pp. 341–347, 2009. [22] M. J. Reddy and D. K. Mohanta, “A wavelet-fuzzy combined approach for classification and location of transmission line faults,” International Journal of Electrical Power and Energy Systems, vol. 29, no. 9, pp. 669–678, 2007. [23] M. J. B. Reddy and D. K. Mohanta, “Performance evaluation of an adaptive-network-based fuzzy inference system approach for location of faults on transmission lines using Monte Carlo simulation,” IEEE Transactions on Fuzzy Systems, vol. 16, no. 4, pp. 909–919, 2008. [24] S. Ekici, “Support Vector Machines for classification and locating faults on transmission lines,” Applied Soft Computing Journal, vol. 12, no. 6, pp. 1650–1658, 2012. [25] S. R. Samataray, “A systematic fuzzy rule based approach for fault classification in transmission lines,” Applied Soft Computing, vol. 13, no. 2, pp. 928–938, 2013.
12 [26] V. Cook, “Distance protection performance during simultaneous faults,” Proceedings of the Institution of Electrical Engineers, vol. 124, no. 2, pp. 141–146, 1977. [27] F. M. Abouelenin, “A complete algorithm to fault calculation due to simultaneous faults—combination of short circuits and open lines,” in Proceedings of the 11th Mediterranean Electrotechnical Conference (MELECON ’02), pp. 522–526, IEEE, Cairo, Egypt, May 2002. [28] V. H. Makwana and B. R. Bhalja, “A new digital distance relaying scheme for series-compensated double-circuit line during open conductor and ground fault,” IEEE Transactions on Power Delivery, vol. 27, no. 2, pp. 910–917, 2012. [29] J. W. Best and J. V. Kahn, Research in Education, Pearson Education, 10th edition, 2006.
Computational Intelligence and Neuroscience
Journal of
Advances in
Industrial Engineering
Multimedia
Hindawi Publishing Corporation http://www.hindawi.com
The Scientific World Journal Volume 2014
Hindawi Publishing Corporation http://www.hindawi.com
Volume 2014
Applied Computational Intelligence and Soft Computing
International Journal of
Distributed Sensor Networks Hindawi Publishing Corporation http://www.hindawi.com
Volume 2014
Hindawi Publishing Corporation http://www.hindawi.com
Volume 2014
Hindawi Publishing Corporation http://www.hindawi.com
Volume 2014
Advances in
Fuzzy Systems Modelling & Simulation in Engineering Hindawi Publishing Corporation http://www.hindawi.com
Hindawi Publishing Corporation http://www.hindawi.com
Volume 2014
Volume 2014
Submit your manuscripts at http://www.hindawi.com
Journal of
Computer Networks and Communications
Advances in
Artificial Intelligence Hindawi Publishing Corporation http://www.hindawi.com
Hindawi Publishing Corporation http://www.hindawi.com
Volume 2014
International Journal of
Biomedical Imaging
Volume 2014
Advances in
Artificial Neural Systems
International Journal of
Computer Engineering
Computer Games Technology
Hindawi Publishing Corporation http://www.hindawi.com
Hindawi Publishing Corporation http://www.hindawi.com
Advances in
Volume 2014
Advances in
Software Engineering Volume 2014
Hindawi Publishing Corporation http://www.hindawi.com
Volume 2014
Hindawi Publishing Corporation http://www.hindawi.com
Volume 2014
Hindawi Publishing Corporation http://www.hindawi.com
Volume 2014
International Journal of
Reconfigurable Computing
Robotics Hindawi Publishing Corporation http://www.hindawi.com
Computational Intelligence and Neuroscience
Advances in
Human-Computer Interaction
Journal of
Volume 2014
Hindawi Publishing Corporation http://www.hindawi.com
Volume 2014
Hindawi Publishing Corporation http://www.hindawi.com
Journal of
Electrical and Computer Engineering Volume 2014
Hindawi Publishing Corporation http://www.hindawi.com
Volume 2014
Hindawi Publishing Corporation http://www.hindawi.com
Volume 2014