Hindawi Publishing Corporation Mathematical Problems in Engineering Volume 2015, Article ID 792658, 18 pages http://dx.doi.org/10.1155/2015/792658
Research Article Solving the Problem of Multiple-Criteria Building Design Decisions with respect to the Fire Safety of Occupants: An Approach Based on Probabilistic Modelling Egidijus Rytas Vaidogas and Jurgita Šak{nait{ Vilnius Gediminas Technical University, 11 Sauletekio Avenue, LT-10223 Vilnius, Lithuania Correspondence should be addressed to Egidijus Rytas Vaidogas;
[email protected] Received 9 April 2015; Accepted 13 August 2015 Academic Editor: Vladimir Turetsky ˇ enait˙e. This is an open access article distributed under the Creative Commons Copyright © 2015 E. R. Vaidogas and J. Sak˙ Attribution License, which permits unrestricted use, distribution, and reproduction in any medium, provided the original work is properly cited. The design of buildings may include a comparison of alternative architectural and structural solutions. They can be developed at different levels of design process. The alternative design solutions are compared and ranked by applying methods of multiplecriteria decision-making (MCDM). Each design is characterised by a number of criteria used in a MCDM problem. The paper discusses how to choose MCDM criteria expressing fire safety related to alternative designs. Probability of a successful evacuation of occupants from a building fire and difference between evacuation time and time to untenable conditions are suggested as the most important criteria related to fire safety. These two criteria are treated as uncertain quantities expressed by probability distributions. Monte Carlo simulation of fire and evacuation processes is natural means for an estimation of these distributions. The presence of uncertain criteria requires applying stochastic MCDM methods for ranking alternative designs. An application of the safetyrelated criteria is illustrated by an example which analyses three alternative architectural floor plans prepared for a reconstruction of a medical building. A MCDM method based on stochastic simulation is used to solve the example problem.
1. Introduction Architectural and structural design of buildings face many problems and these problems include a selection among alternative plans of houses, individual floors, alternative use of floors in one building, alternative structural solutions, and structural materials. The selection problem is highly important in the early design stage. In the literature, attempts are described to provide some theoretical base for the selection among alternative architectural and structural solutions [1– 3]. The presence of several alternative floor plans or similar alternative architectural solutions generates a problem of a multiple-criteria selection with respect to economic and architectural/structural characteristics (criteria) of each alternative. As fire prevails among hazards present in buildings, criteria related to fire safety should be included in the selection problem.
If considered from the standpoint of fire safety, alternative architectural and structural solutions mean different possibilities of fire spread, evacuation, and firefighting. A choice of a specific solution among a number of alternatives should take into account a number of economic, functional, technical, aesthetical criteria. Methods of multiple-criteria decision-making (MCDM) can be used for such a choice [4]. Until now, a building-related MCDM did not use criteria expressing fire safety [5–7]. Therefore, it makes sense to include criteria expressing fire safety into building-related MCDM problems. In the field of fire safety, MCDM was applied to ranking fire safety criteria [8, 9]. MCDM was also used for the choice among alternative buildings with respect to fire safety and selection of fire safety systems [10, 11]. The present study proposes a building-related MCDM which takes into account fire risk to occupants. The conventional application of MCDM to build property is expanded
2
Mathematical Problems in Engineering
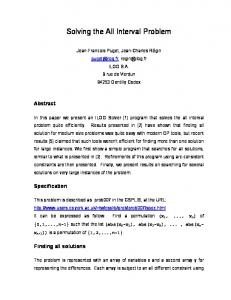
Atrium a1 : tower
a2 : mid-rise
a3 : low-rise
a1 : rectangular
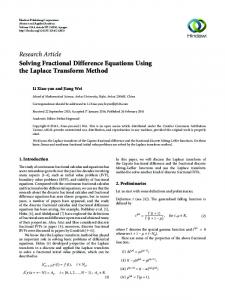
(a) Alternative building heights
a2 : with atrium
a3 : nonrectangular
(b) Alternative floor plans
Figure 1: Alternative shapes and floor plans of a building specified on the conceptual level of design process.
by applying estimates of the fire risk as MCDM criteria. They are expressed in terms of probabilities that occupants will be exposed to untenable conditions which can build up on escape routes. Criteria expressed through time to untenable conditions and rescue time are applied to ranking alternative building design solutions. The proposed procedure allows solving MCDM problems when some elements of a decisionmatrix are random. An application of the procedure is illustrated by a choice among different architectural solutions of a medical building.
2. The Problem of Choosing among Alternative Design Solutions of a Building 2.1. Development of Alternative Designs. A generation of alternative architectural and structural designs (or, briefly, alternatives) is one of the main tasks arising in the early stage of a building creation. The process of developing different alternatives is to a large margin intuitive and is not easily amenable to a mathematical formalisation. This process will be highly influenced and sometimes constrained by regulations and client wishes. However, the designer (architect or structural engineer) will always have certain freedom in specifying alternatives and choosing among them, especially, in the early stage of building design. At the same time, an improper rating of alternatives and an erroneous choice of one as seemingly the best solution can protract the entire process of design and construction and encumber exploitation. Consequently, an application of mathematical means that facilitating selection of the best alternative among a set of developed alternatives will allow reducing probability of a wrong choice. A generation of alternatives can be interpreted as a discretisation of a continuous process. In principle, small changes in the design will allow generating an almost endless set of alternatives. However, in many cases the designer will face the problem of a selection among a limited set of alternatives which represent principal or fairly different design solutions. The set of 𝑛 alternatives denoted, say, by 𝑎1 , 𝑎2 , . . . , 𝑎𝑖 , . . . , 𝑎𝑛 can be generated at different levels of development (LODs) in the process of building design. Five LODs range from “conceptual” to “as-built” and offer different possibilities for specifying, comparing and rating the alternatives 𝑎𝑖 (Table 1). On the conceptual level, 𝑎𝑖 can represent different
Table 1: Definition of levels of development (LOD) in a building design process [12, 13]. Level
Brief description
LOD 100
Conceptual design
LOD 200
Schematic design
LOD 300
Detailed design
LOD 400 Construction LOD 500
As-built (actual)
Definition Vague information consisting of nongeometric data or line work, areas, volumes, zones, and so forth Generic elements shown in three dimensions Specific elements with object geometry (dimensions, capacities, and connections) Shop drawing/fabrication The project as it has been constructed. The model and associated data is suitable for maintenance and operations of the facility
shapes or floor plans of a building under design (Figure 1). On the lower levels of schematic and detailed design, the alternatives 𝑎𝑖 can be developed within a given shape or floor plan of a building (Figure 2). Finally, the alternatives 𝑎𝑖 can be generated for a building with a specific configuration and floor plans. These alternatives can represent different structural systems and materials of the main structure and nonload bearing elements, alternative internal and external finishes, and different solutions of building utilities. A formal framework for comparison and ranking of the alternatives 𝑎𝑖 is the methodology of MCDM. It allows interalternative comparisons of 𝑎𝑖 by applying a set of criteria 𝑐1 , 𝑐2 , . . . , 𝑐𝑗 , . . . , 𝑐𝑚 . A problem statement of MCDM is 𝑛-by𝑚 decision-making matrix C. Its element 𝑐𝑖𝑗 represents a value of the criterion 𝑐𝑗 related to the alternative 𝑎𝑖 . A wide variety of MCDM methods allows ranking the alternatives 𝑎𝑖 by applying both quantitative and qualitative criteria 𝑐𝑗 . MCDM can accommodate subjective and objective, fixed, fuzzy, and random criteria 𝑐𝑗 [14]. In the context of building design organised as a successive passing of LODs, a comparison of the alternatives 𝑎𝑖 will make sense if 𝑎𝑖 will represent the same LOD. In principle, branching of the design process into the alternatives 𝑎𝑖 is possible on the conceptual level LOD 100, as long as it is possible to characterise the vague information expressed by
Mathematical Problems in Engineering
3
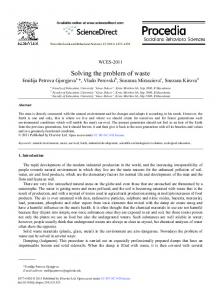
a1 : open plan
a2 : enclosed offices a2
a1
a3 : a combination of a1 and a2 (a) Alternative interior floor plan designs
Least dense Intermediate
a3 Most dense
(b) Alternative allocations of occupants in a building
Figure 2: Alternative design solutions of a building within a given geometrical configuration.
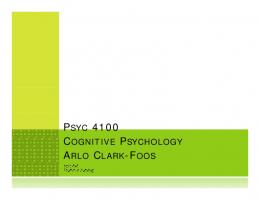
The beginning of a design process The beginning of a design process
LOD 100 LOD 200
a1
a2
···
an
LOD 100 alternatives
MCDM ranking of ai yields the top-ranked alternative a∗
a1
a2
···
an LOD 300 alternatives
Continuation of the design process based on a∗
MCDM ranking of ai yields the top-ranked alternative a∗
LOD 200
Continuation of the design process based on a∗
.. .
LOD 400 and LOD 500
(a) Comparison of conceptual designs
(b) Comparison of designs on higher level of detail
Figure 3: A generation of the alternative building designs 𝑎𝑖 at different levels of development.
conceptual designs by some qualitative or quantitative criteria 𝑐𝑗 (Figure 3(a)). Most of them will express subjective opinions of architect and client, because very little can be measured quantitatively and objectively at this stage of design. Higher levels of detail represented by LODs from 200 to 400 give better opportunity to formulate and solve a MCDM problem. Branching of the design process into the alternatives 𝑎𝑖 can be done on each of these levels (Figure 3(b)). At the same time, a development of a large number 𝑛 of the alternatives 𝑎𝑖 and characterisation of each of them by the criteria 𝑐𝑗 can encumber the design process. In essence, a solution of a MCDM problem will require preparing 𝑛 different designs of building related to the LOD reached in the design process. On the other hand, a successful choice of the best alternative design (top-ranked alternative, say, 𝑎∗ ) may allow compensating for that extra effort, due to the effect of a multiple-criteria optimisation. 2.2. Inclusion of Criteria Related to Building Fire Safety. The prevailing hazard in most of nonindustrial occupations and many industrial buildings is the fire hazard. Its converse, a fire safety, is usually decomposed into safety of occupants, safety of fire-fighting operations, and safety of structures subjected to fire effects. A certain number 𝑚𝑠 of quantitative or qualitative measures expressing the three aforementioned
aspects of safety can be included into an 𝑚-dimensional vector of MCDM criteria, c. For instance, the vector c can be composed of two subvectors: c = (c | c ) = (𝑐1 , 𝑐2 , . . . , 𝑐𝑚−𝑚𝑠 | 𝑐𝑚−𝑚𝑠 +1 , 𝑐𝑚−𝑚𝑠 +2 , . . . , 𝑐𝑚 ) ,
(1)
where c and c are vectors including criteria of general nature and safety-related criteria, respectively. To compose the decision-making matrix C, it is necessary to specify values of c and c for each alternative 𝑎𝑖 . The fire safety can be influenced by decisions made on all LODs. For instance, early decisions at LOD 100 or LOD 200 may pose the following selection problems related to the fire safety: (1) An inclusion of a large volume space like an atrium into the building will generate the need to deal with increased risk to the life of occupants. Atria allow smoke and heat to travel throughout all floors of a building (e.g., [15, 16]). The opposite alternative of a solid floor plan will not pose this problem. (2) A decision to erect a high-rise tower instead of a lowrise, longitudinal building will automatically pose
4
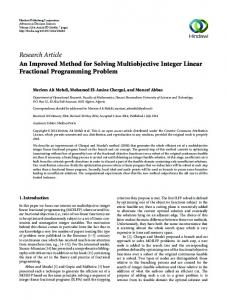
Mathematical Problems in Engineering Vague information on the alternatives ai at LOD 100 or LOD 200
Approximate, subjective assessments of fire safety
(a) Weak but identifiable mutual relations
Specific design of a building at LOD 400 or LOD 500
Graphic and nongraphic information on all ai at LOD 200 or LOD 300
Quantitative measures of passive and active fire safety
(b) Strong interconnection of architecture and fire safety
Attributes of alternative active fire safety solutions ai
(c) One-way relation between architecture and fire safety
Figure 4: Three levels of an interconnection of building design and assurance of fire safety.
the problems related to fire safety of tall buildings (e.g., [17]). (3) An allocation of people predominantly in the lower floors of an office tower will increase the chance of a successful evacuation in comparison to other occupant distributions (Figure 2(b)). Occupant loads depend on human behaviour which is sometimes difficult to control. However, alternative allocations can be assessed and compared by means of probabilistic measures [18]. Although LOD 100 and LOD 200 designs present a vague information, some criteria 𝑐𝑗 belonging to the subvector c can be specified and used for solving a MCDM problem. Let us compare a building with an atrium (design concept 𝑎1 ) and a solid plan building (design concept 𝑎2 ) (Figure 1(b)). The criterion 𝑐𝑗 can be a number of scores subjectively assigned by an expert to fire safety level of 𝑎1 and 𝑎2 (e.g., 𝑎1 earns 6 and 𝑎2 earns 8 in a 10-point scale). A component of c can also be an average cost (in C/m2 , say) of fire safety systems which can or must be installed in 𝑎1 and 𝑎2 . The concept 𝑎1 presupposes a provision of smoke and heat control equipment in the atrium. Therefore, fire safety system of 𝑎1 may cost in average more than fire safety system of 𝑎2 . Even if 𝑎1 is preferable from the architectural standpoint, higher average fire safety costs of 𝑎1 and possibly higher risk to occupants can make 𝑎1 less appealing than 𝑎2 . The cost of build-in fire protection is high (e.g., [19]). A trade-off between cost of fire safety and fire risk to occupants may be necessary in many design situations [20]. The need of such a trade-off is capable of creating a mutual relation between architectural design and fire protection at LOD 100 or LOD 200 (Figure 4(a)). The best platform for a comparison of the alternatives 𝑎𝑖 by means of formal MCDM methods is LOD 200 and LOD 300 designs (Figure 4(b)). The knowledge of at least approximate geometry and building materials specified at these development levels will allow applying a computer simulation of fire and evacuation processes. Many computer codes used for such a simulation require transferring geometry and material data between a CAD system and often coupled systems of fire and evacuation simulation (e.g., FDS and Evac codes [22, 23]). The computer simulation allows obtaining estimates of fire and evacuation processes. These estimates can be used as fire-related criteria 𝑐𝑗 belonging to the subvector c . The criteria 𝑐𝑗 will be able to reflect both passive and active fire safety measures. For instance, different
compartmentation and internal lining can be used to develop the alternatives 𝑎𝑖 . The alternatives 𝑎𝑖 can also be developed for a unique architectural and structural solution of the building at LOD 400 or LOD 500, in which passive fire protection measures are unchangeable. However, alternative technical measures can be provided as an active fire protection [11, 12]. The components 𝑐𝑗 of the subvector c will have to reflect a fire safety level achieved by a combined provision of passive and active measures. MCDM methods allow ranking the alternatives 𝑎𝑖 with deterministic, random, and fuzzy criteria 𝑐𝑗 . Despite the fact that the praxis of fire and evacuation assessment is predominantly deterministic, all key characteristics related to a building fire safety are random [24, 25]. For instance, random quantities are (1) evacuation times related to the paths that will be available during a certain time after a fire outbreak, (2) times to untenable conditions in available evacuation paths, (3) times to structural failures which can endanger fire fighting operations, (4) potential numbers of victims among occupants and fire fighters. This randomness should be taken into account in specifying the components 𝑐𝑗 of the subvector c . The criteria 𝑐𝑗 can be uncertain quantities or quantities expressing uncertainties (e.g., probabilities).
3. Mathematical Specification of Decision Criteria The criteria 𝑐𝑗 related to fire protection of a building can be very diverse and reflect economic and technical characteristics of build-in fire safety [11, 12]. It is reasonable to state that the most important criteria 𝑐𝑗 should measure the life safety of building occupants in a preflashover period of fire development. In previous decades, the fire safety of buildings was quantified by means of nonprobabilistic fire risk indices [26]. They reflect in certain way the life safety and, technically speaking, can be used as 𝑐𝑗 . However, the indices are relatively insensible to architectural and structural changes and so are not very useful for interalternative comparisons [27].
Mathematical Problems in Engineering
5
The most informative and integral criterion 𝑐𝑗 expressing the life safety is the probability of a successful evacuation from a building fire: 𝑃se = 𝑃 (𝑇𝑢 ≥ 𝑇𝑒 ) = 𝑃 (𝑇𝑢 ≥ 𝑇𝑑 + 𝑇𝑟 + 𝑇tr ) ,
(2)
where 𝑇𝑢 is the time to untenable conditions (the time gaseous combustion products take to travel from the fire room and produce untenable conditions on an escape route); 𝑇𝑒 is the total evacuation time; 𝑇𝑑 is the discovery time (the time period from ignition to discovery of a fire, known also as the perception time); 𝑇𝑟 is the reaction time (the time period from fire discovery to the start of escape action, known also as action or recognition time or gathering phase); 𝑇tr is the travel time (the time taken to move to the place of safety). Needless to say, the times in (2) are always subject to uncertainties and must be modelled as random variables. The chance of fire injuries will increase with the increasing duration of exposure to untenable conditions, expressed by the difference 𝑇𝑒 −𝑇𝑢 . The information behind the random times 𝑇𝑒 and 𝑇𝑢 can be utilised for a MCDM at least in two ways. If it is possible to obtain accurate and “cheap” estimates of the probabilities 𝑃(𝑇𝑢 ≥ 𝑇𝑒 ), they can be used as MCDM criteria 𝑐𝑖𝑗 = 𝑃 (𝑇𝑢𝑖𝑗 ≥ 𝑇𝑒𝑖𝑗 ) ,
(3)
where 𝑇𝑢𝑖𝑗 and 𝑇𝑒𝑖𝑗 are random times related to the alternative 𝑎𝑖 and available evacuation path 𝑗. The criteria defined by (3) are in essence deterministic and can be easily included into the decision-making matrix C. However, scarcity of hard data on the times 𝑇𝑢𝑖𝑗 and 𝑇𝑒𝑖𝑗 may generate uncertainty related to the “true” values of the probabilities 𝑃(𝑇𝑢𝑖𝑗 ≥ 𝑇𝑒𝑖𝑗 ). In terms of the theory known as the quantitative risk assessment such uncertainty is called epistemic (state-of-knowledge) uncertainty and quantified by applying methods of Bayesian statistical theory (e.g., [28]). A result of a Bayesian estimation of 𝑃(𝑇𝑢𝑖𝑗 ≥ 𝑇𝑒𝑖𝑗 ) will be an epistemic random variable 𝑐̃𝑖𝑗 . It can be used as an element of the decision-making matrix. However, in the latter case a MCDM problem will be ̃ some elements of formulated as a decision-making matrix C, which are uncertain in the epistemic sense. Simply stated, the ̃ decision problem will be expressed by a random matrix C. The second way of utilising information behind 𝑇𝑒 and 𝑇𝑢 is to use the random criteria 𝑐̃𝑖𝑗 = 𝑇𝑢𝑖𝑗 − 𝑇𝑒𝑖𝑗 .
(4)
They will allow carrying out interalternative comparisons without estimating the probabilities 𝑃(𝑇𝑢𝑖𝑗 ≥ 𝑇𝑒𝑖𝑗 ). At the same time, information used to assess probability distributions of 𝑇𝑢𝑖𝑗 and 𝑇𝑒𝑖𝑗 will be in the main part the same as information used to estimate 𝑃(𝑇𝑢𝑖𝑗 ≥ 𝑇𝑒𝑖𝑗 ). With the criteria 𝑐̃𝑖𝑗 defined by (4), a MCDM problem will be formulated ̃ through a random decision-making matrix C. The direct data allowing us to fit the probability distributions of 𝑇𝑢𝑖𝑗 and 𝑇𝑒𝑖𝑗 will hardly be available in most design situations. However, distributions of 𝑇𝑢𝑖𝑗 and 𝑇𝑒𝑖𝑗 and so
the probabilities 𝑃(𝑇𝑢𝑖𝑗 ≥ 𝑇𝑒𝑖𝑗 ) can be estimated by means of a stochastic (Monte Carlo) simulation of fire and evacuation processes. Such a simulation became an intensive field of fire safety investigation in recent years [29–31]. In context of MCDM, the simulation can yield generated samples of 𝑇𝑢𝑖𝑗 and 𝑇𝑒𝑖𝑗 . These samples can be used for either choosing the probability distributions of 𝑇𝑢𝑖𝑗 and 𝑇𝑒𝑖𝑗 or estimating 𝑃(𝑇𝑢𝑖𝑗 ≥ 𝑇𝑒𝑖𝑗 ). A specification of probabilistic input information for a computer-aided fire simulation can be gained from various sources. There exist large collections of data on fires in general [8]. Databases related to fires are collected and maintained in such particular areas as safety of nuclear power plants [32]. Unfortunately, the data situation in some specific areas of fire safety (e.g., sprinklers and fire alarms) is not very encouraging [33]. Consequently, specification of input information for assessing such values as 𝑇𝑢𝑖𝑗 and 𝑇𝑒𝑖𝑗 will have to rely on Bayesian analysis widely used for a probabilistic risk assessment. The distributions (estimates) of the times 𝑇𝑢𝑖𝑗 and 𝑇𝑒𝑖𝑗 can be applied to solving a MCDM problem with either ̃ deterministic or stochastic decision-making matrix, C or C. Several MCDM methods were proposed to solve the selection ̃ [34–36]. The following problem with the random matrix C ̃ by means of a MCDM case study illustrates dealing with C method based on stochastic simulation.
4. An Application to a Reconstruction of a Medical Building 4.1. Alternatives under Comparison and Safety-Related MCDM Criteria. The present case study considers an existing two-storey wing of a hospital building in Lithuania. The first floor of the wing accommodates a haemodialysis unit and the second floor is used for a catering department (Figures 5 and 6). Smoke detectors in all rooms of the building will activate an alarm system in case of fire. Fresh air supply fans installed in the building are supposed to automatically shut down when the fire alarm is activated. A hospital administration is going to reconstruct the catering department and to open a canteen in the second floor. The administration wants to create the most functional and efficient floor plan for running the canteen. At the same time, the hospital administration knows that cooking is the leading cause of fires in healthcare facilities. Three new floor plans are considered in the design (Figures 7 to 9). They differ in wall plans and the position of the potential room of fire initiation (the room with stoves and ovens). The three floor plans will constitute the alternatives of a MCDM problem: (i) 𝑎1 is a floor plan with single-room seating area (66.1 m2 ) and large service area (31.4 m2 ) (Figure 7), a relatively large number of openings allowing a convenient movement of kitchen staff and products; the kitchen area is the smallest among the alternative floor plans (Table 2).
6
Mathematical Problems in Engineering
ER12
3000
A
B
6000
Reception unit
0.000
D1,10 C D19
6000 25000
HHS
D18
ED 1 Hemodialysis unit
D
D17
D16
6000
D15
D14 D13
4000
E
D11
ER11
D12
−1.500
ER11
F 12000
HHS
Freight elevator
Dij
Hand-hose standpipe
EDi Elevator door
Cabinet and cashier
ERij Escape route
Door
Figure 5: Plan of the haemodialysis unit in the first floor of the building.
Mathematical Problems in Engineering
7
3000
A
6000
3.000
6000 25000
The area provided for the new canteen and kitchen
HHS
D27 ED 2
D25
D26 D24
D D22
D23 The kitchen area left unchanged
6000
Storeroom
Staff room 1
D21 Staff room 2 ER21
4000
E
1.500 F 12000
HHS
Freight elevator
Dij
Hand-hose standpipe
EDi Elevator door
Cabinet and cashier
ERij Escape route
Door
Figure 6: Existing wall plan of the catering department in the second floor of the building.
8
Mathematical Problems in Engineering ER22
D2,12 Kitchen room 2 (18 m2 ) D2,11
Restroom
3000
A
D2,10
6000
Seating room (66.1 m2 ) 3.000
D28
D29
Fire room (ovens, stoves) (13 m2 )
Delivery openings D27
HHS
DO1
DO2
ED2
D25
6000
Service room (31.4 m2 )
Kitchen room 1 (11.7 m2 )
D26 D24
D
HHS
Freight elevator
Dij
Hand-hose standpipe
EDi Elevator door
Cabinet and cashier
ERij Escape route
Door
Figure 7: New wall plan 𝑎1 for the canteen.
(ii) 𝑎2 is a two-room seating area (51.9 m2 and 26.3 m2 ), relatively small service area (11 m2 ) (Figure 8); among the three alternative plans, the room of potential fire initiation in the plan 𝑎2 is at the largest distance from freight elevator, stairwell, and hospital units in the first floor. (iii) 𝑎3 is a two-room seating area (50 m2 and 18 m2 ), relatively small service area (12.3 m2 ) (Figure 9); the room of potential fire initiation is relatively well isolated from other rooms by compartmentation; the kitchen area is the largest among the alternative floor plans (Table 2). In terms of fire safety, the alternatives 𝑎1 , 𝑎2 , and 𝑎3 can be characterised as follows: (i) 𝑎1 is the floor plan with the least effective compartmentation; the room of potential fire initiation is in front of the freight elevator and is relatively close to the stairwell; gaseous combustion products may
Table 2: Characteristics of the floor plans 𝑎1 , 𝑎2 , and 𝑎3 shown in respective Figures 7, 8, and 9 (the bold rows indicate characteristics of the alternatives which will be used as MCDM criteria). Floor plan characteristic Seating area, m2 Kitchen area, m
2
Service area, m2 Sum of the above three areas, m2 Floor reconstruction cost, thousands of C Estimated reconstruction time, months
Plan 𝑎1
Plan 𝑎2
Plan 𝑎3
66.1
78.2
68.0
42.7
49.1
57.2
31.4
11.0
12.3
140
138
132
458.0
298.5
315.6
3.5
2.1
2.0
flow from the fire room to the inside through two horizontal vents (door D25 and delivery opening DO1 , Figure 7); in case of fire, the combustion products will first affect kitchen staff and then visitors of
Mathematical Problems in Engineering
9 ER22
Fire room (ovens, stoves) (18 m2 ) Restroom D2,11
3000
D2,12
D2,10
Service area (11 m2 )
D29
Seating room 1 (51.9 m2 ) 3.000
6000
A
D28
Kitchen room 1 (13 m2 )
6000
HHS
Seating room 2 (26.3 m2 )
D27 ED2
D25
Kitchen room 2 (18.1 m2 )
D26 D24
D
HHS
Freight elevator
Dij
Hand-hose standpipe
EDi Elevator door
Cabinet and cashier
ERij Escape route
Door
Figure 8: New wall plan 𝑎2 for the canteen.
the canteen; the horizontal evacuation is possible through the escape routes ending with doors D21 and D2,12 (Figures 6 and 7). (ii) 𝑎2 is the floor plan with the most remote position of the fire room with respect to the freight elevator and stairwell, an average compartmentation in comparison to plans 𝑎1 and 𝑎3 ; there are two horizontal vents for the flow of gaseous combustion products to the inside (doors D2,10 and D2,11 , Figure 8); in case of fire, the staff in the fire room and visitors of the canteen will be affected first by combustion products; the horizontal evacuation is possible through the escape route ending with door D21 , whereas the evacuation through D2,12 can be problematic (Figures 6 and 8). (iii) 𝑎3 is the floor plan with a relatively effective compartmentation with respect to the position of the fire room; gaseous combustion products may flow from the fire room to the inside only through door D28 (Figure 9); the possible paths of horizontal evacuation
ending with doors D21 and D2,12 are similar to those in the plan 𝑎1 (Figures 6 and 9). The alternatives 𝑎1 to 𝑎3 will differ in the economic sense and, to a certain degree, in the necessary operations of reconstruction. For instance, the floor plan 𝑎1 requires providing a large opening in the load-bearing masonry wall for cabinet and cashier (Figure 7). This opening will be 6 m wide and must be covered by a lintel with a relatively wide span. It is clear that construction of such an opening and lintel will increase the duration and cost of reconstruction works required by the floor plan 𝑎1 with respect to the plans 𝑎2 and 𝑎3 . On the other hand, the floor plans 𝑎2 and 𝑎3 will require constructing a larger number of partitions to form new rooms than the floor plan 𝑎1 . The differences in the floor plans will lead to differences in the risk posed by a potential fire to patients, medical staff, and visitors of the canteen. A selection among the alternatives 𝑎1 to 𝑎3 must include a MCDM criterion which reflects the risk to lives of these three categories of occupants.
10
Mathematical Problems in Engineering ER22
D2,12 Seating room 2 (18 m2 )
Restroom
3000
A
D2,11
Seating room 1 (50 m2 ) 6000
3.000
Service area (12.3 m2 ) D2,10 Fire room (ovens, stoves) (13.7 m2 )
Kitchen room 1 (13 m2 )
D29
D27
6000
HHS
D28
Kitchen room 3 (18.8 m2 )
Kitchen room 2 (11.7 m2 )
D25
D26 D24
D
HHS
Freight elevator
Dij
Hand-hose standpipe
EDi Elevator door
Cabinet and cashier
ERij Escape route
Door
Figure 9: New wall plan 𝑎3 for the canteen.
The alternative floor plans 𝑎1 , 𝑎2 , and 𝑎3 can be compared in terms of the probability 𝑃se . However, this probability is relatively difficult to be estimated and the estimation will involve information common to all three alternatives: (1) The discovery time 𝑇𝑑 may be considered equal for all three alternatives (the existing part of the building is and new part will be equipped with automatic detectors and alarm which reduce 𝑇𝑑 to approximately one minute in the whole building (e.g., [8]). (2) The reaction time 𝑇𝑟 may also be assumed to be equal for all three alternatives because the types and numbers of occupants (haemodialysis patients, medical staff, and kitchen staff as well as visitors of canteen and reception unit) will not depend on the wall plans in individual alternatives. (3) The time needed for evacuation of the haemodialysis unit, 𝑇tr , may be considered equal for all three alternatives because different floor plans in the second
floor will not influence possibilities of escape from this unit. The alternative floor plans will create different possibilities for gaseous combustion products to travel horizontally through the second floor and to leak into the haemodialysis unit. This may cause differences in the time to untenable conditions on potential escape routes, 𝑇𝑢 , in both floors. The different wall plans and position of fire room will also provide different routes of evacuation and so differences in the travel times 𝑇tr related to the individual alternatives. The idea was to compare the alternative floor plans by using the times 𝑇𝑢 and 𝑇tr and not the probabilities of a successful evacuation, 𝑃se . The time to the production of untenable conditions in the haemodialysis unit (say 𝑇𝑢1 ) can be taken as a candidate MCDM criterion related to the live safety of haemodialysis patients, because the total time of evacuation from this unit, 𝑇𝑒 , may be considered the same for all three alternatives: 𝑐𝑖𝑗 = 𝑇𝑢,𝑖1
(𝑖 = 1, 2, 3) ,
(5)
Mathematical Problems in Engineering
11
where the values of the subscript 𝑖 refer to 𝑎1 , 𝑎2 , and 𝑎3 and subscript “1” denotes the first floor. The life safety of kitchen staff and visitors of the canteen will depend on times to untenable conditions (say 𝑇𝑢2 ) and travel times (say 𝑇tr2 ) related to available escape routes. A candidate MCDM criterion expressing the life safety of occupants in the second floor can be expressed by the difference of 𝑇𝑢2 and 𝑇tr2 : (𝑖 = 1, 2, 3) ,
Burning rate: m∞ = 0.039 kg/(m2 s) Combustion efficiency coefficient: 𝜒 = 0.7
Fuel-dependent model term: k𝛽 = 0.7 m−1 Diameter of equivalent pool: D = 1.13 m
(6)
Total mass of fuel: 9.23 kg (101)
where subscript “2” refers to the second floor. The times 𝑇𝑢,𝑖1 , 𝑇𝑢,𝑖2 , and 𝑇tr,𝑖2 depend on the development of fire and movement of occupants on the second floor. An estimation of probability distributions of these times will require modelling a development of fire in the building under analysis. Consequently, a specification of a MCDM decisioñ used in the present case study will include making matrix C a computer fire simulation.
𝑞𝑜̇ = 𝑞𝑜 + 𝜉𝑜 ,
(7)
where 𝑞𝑜 is the average value of 𝑞𝑜̇ estimated with the data given in Figure 10 and 𝜉𝑜 is the random variable expressing stochastic uncertainty in values of 𝑞𝑜̇ . This uncertainty results from uncertainties in the variables mentioned in Figure 10. For the purpose of fire simulation, the value of 𝑞𝑜 was estimated to be equal to 605 kW and the probability distribution of 𝜉𝑜 was assumed to be normal with the mean of 0 kW and variance of 1200 (kW)2 . The duration of the pool fire, 𝑡𝑜 , is assumed to be uncertain and modelled by the normal random variable 𝑇𝑜 with the distribution 𝑁 (433 s, 900 s2 ). Densities of the random variables 𝜉𝑜 and 𝑇𝑜 are illustrated in Figure 10. The HRR of flue fire, which will be initiated by the pool fire of oil and grease at the time 𝑡𝑓0 , will be simulated as a time history 𝑞𝑓̇ (𝑡) expressed as 𝑞𝑓̇ (𝑡) = 𝑞𝑓 (𝑡) + 𝜉𝑓 (𝑡)
with 𝑡 ∈ (𝑡𝑓0 , 𝑡𝑓 ) ,
(8)
where 𝑞𝑓 (𝑡) is the average value of 𝑞𝑓̇ (𝑡) and 𝜉𝑓 (𝑡) is the random, “fluctuating part” of 𝑞𝑓̇ (𝑡) at the time 𝑡, and 𝑡𝑓0 − 𝑡𝑓 is the duration of the flue fire. For the purpose of a computer fire simulation, the continuous process 𝑞𝑓̇ (𝑡) was replaced by the set of random variables Ξ𝑓 = {(𝑞𝑓 (𝑡𝑙 ) + 𝜉𝑓 (𝑡𝑙 )) , 𝑙 = 1, 2, . . . , 17} ,
(9)
qo = 605 kW fq𝑜 +𝜉𝑜 (q)̇ fT𝑜 (t | 433 s, 900 s2 ) to
0 t (s)
Figure 10: Mathematical model of the heat release rate (HRR) for the pool fire of oil and grease (the model of 𝑞𝑜 was adopted from Karlsson and Quintiere [21]).
900 Average qf (kW)
4.2. Probabilistic Simulation of Burning Objects. The fire is assumed to be initiated in the room used to operate stoves and ovens or, briefly, the fire room (Figures 7 to 9). The fire will be initiated by an ignition of an electrical kitchen stove and a subsequent ignition of flue above the stove. The fire will be caused by a malfunction of a thermostat in the stove and ignition of a mixture of oil and grease in a tray. The heat release rate (HRR) of the oil and grease pool fire may be assumed to be constant over the fire duration (0, 𝑡𝑜 ), where the subscript “𝑜” stands for “oil” [37, 38]. The constant HRR of this fire, 𝑞𝑜̇ , will be modelled by the expression
Area of equivalent pool: A o = 1 m2 Duration of the pool fire: 433 s
q̇ (kW)
𝑐𝑖,𝑗+1 = 𝑇𝑢,𝑖2 − 𝑇tr,𝑖2
(1 − e−k𝛽D )A o (kW) Average HRR: qo = Δhc 𝜒 m∞ 3 Density: 𝜌o = 923 kg/m Complete heat of combustion: Δhc = 40.6 MJ/kg
600
300
0
0
50
100
150
200 t (s)
250
300
350
400
Figure 11: Time history of the average heat release rate of the flue fire, 𝑞𝑓 (𝑡𝑙 ), drawn for 𝑡𝑓0 = 0 s and 𝑡𝑓 = 400 s.
where 𝑡𝑙 are time moments obtained by assuming that the flue fire will last 400 s and dividing the fire duration 𝑡𝑓 − 𝑡𝑓0 into 16 intervals, each lasting 25 seconds (Figure 11); 𝑞𝑓 (𝑡𝑙 ) is the average HRR at the moment 𝑡𝑙 ; and 𝜉𝑓 (𝑡𝑙 ) is a normally distributed random variable with the mean 0 kW and standard deviation equal to 0.07 × 𝑞𝑓 (𝑡𝑙 ). The random variables 𝜉𝑓 (𝑡𝑙 ) were assumed to be correlated and the correlation coefficients were calculated by means of the following model [39]: 𝜌𝑙𝑘 ≡ 𝜌 (𝜉𝑓 (𝑡𝑙 ) , 𝜉𝑓 (𝑡𝑘 )) = exp {−𝜅 𝑡𝑙 − 𝑡𝑘 }
(10)
with 𝜅 = 0.02. The discretisation of the fire duration (𝑡𝑓0 , 𝑡𝑓 ) follows from the measurement techniques of the so-called free burn experiments used for determining HRR values at given time moments 𝑡𝑙 (e.g., [40]). A certain number of individual time histories (signals) measured in repeated experiments allow
12
Mathematical Problems in Engineering
Table 3: Probability distributions of the random variables used for the computer fire simulation in the hospital building considered in a MCDM problem. Variable The fluctuation of the oil fire HRR(1) around the mean value 𝑞𝑜 (Figure 10) The random duration of oil fire (Figure 10) The fluctuation of the flue fire HRR(1) around the mean value 𝑞𝑓 (𝑡𝑙 ) at 𝑡𝑙 (Figure 11)
Symbol 𝜉𝑜 𝑇𝑜 (3) 𝜉𝑓 (𝑡𝑙 )
The fluctuation of the cupboard fire HRR around the mean value 𝑞𝑐 (𝑡𝑙 ) at 𝑡𝑜 (Figure 12) 𝜉𝑐 (𝑡𝑜 ) The temperature of wind glass breaking 𝜉𝑤𝑡 The fraction of the broken glass area 𝜉𝑤𝑎
(1) (2) (3)
(2)
Mean 605 kW 433 s 0 kW
Coeff. of var. 0.05 0.07 0.07
Distribution Normal Normal Lognormal
0 kW 250∘ C 0.222
0.05 0.05 0.354
Lognormal Normal Beta(3)
HRR: heat release rate. The variables 𝜉𝑓 (𝑡𝑙 ) and 𝜉𝑐 (𝑡𝑙 ) (𝑙 = 1, 2, . . . , 17) are assumed to be correlated with the correlation coefficients calculated by (10). Beta distribution with the parameters 6 and 21 and the mode of 0.2.
7000
Average qc (kW)
6000 5000 4000 3000 2000 1000 0
0
100
200
300
400 t (s)
500
600
700
800
Figure 12: A sequence of average heat release rates of the cupboard fire, 𝑞𝑐 (𝑡𝑙 ).
estimating the mean values 𝑞𝑓 (𝑡𝑙 ) at given 𝑡𝑙 and fitting probability distributions of the random variables 𝜉𝑓 (𝑡𝑙 ). The stove and flue fire will spread to a set of cupboards in the surrounding of the stove. The cupboards will ignite when the upper gas layer reaches the temperature of 200∘ C. The HRR history of the cupboards was modelled similarly to the one of the flue fire, that is, by a set of random variables Ξ𝑐 = {(𝑞𝑐 (𝑡𝑙 ) + 𝜉𝑐 (𝑡𝑙 )) , 𝑙 = 1, 2, . . . , 17} ,
(11)
where the subscript “𝑐” stands for “cupboard,” 𝑞𝑐 (𝑡𝑙 ) is mean values of HRR at the moment 𝑡𝑙 , and 𝜉𝑐 (𝑡𝑙 ) is the “fluctuating” part of HRR at 𝑡𝑙 . The sequence of the mean values 𝑞𝑐 (𝑡𝑙 ) was adopted from Babrauskas [40] and is shown in Figure 12. The duration of the cupboard fire is assumed to be equal to 800 s and thus 𝑡1 = 0 s, 𝑡17 = 800 s, and 𝑡𝑖+1 − 𝑡𝑖 = 50 s (Figure 12). The fluctuating parts 𝜉𝑐 (𝑡𝑙 ) were modelled as correlated random variables with mean values equal to 0 kW and standard deviations equal to 0.05×𝑞𝑐 (𝑡𝑙 ). The coefficients of correlation 𝜌(𝜉𝑐 (𝑡𝑙 ), 𝜉𝑐 (𝑡𝑘 )) were calculated with the model given by (10) with 𝜅 = 0.01. The window in the kitchen room is assumed to break when the temperature reaches a sufficiently high temperature. In the present study, the breaking temperature and fraction of broken glass area will be modelled by two respective random variables 𝜉𝑤𝑡 and 𝜉𝑤𝑎 . The following probability distributions
were assumed for these variables: 𝜉𝑤𝑡 ∼ 𝑁 (250∘ C, 155(∘ C)2 ) (normal distribution) and 𝜉𝑤𝑎 ∼ Be(6, 21) (a beta distribution with the mode of 0.2). The variables 𝜉𝑤𝑡 and 𝜉𝑤𝑎 are assumed to be uncorrelated because any data, which can substantiate presence or absence of a stochastic dependence between 𝜉𝑤𝑡 and 𝜉𝑤𝑎 , is not known to us. Characteristics of the random variables 𝜉𝑤𝑡 and 𝜉𝑤𝑎 , along with ones of other random variables used in the problem, are summarised in Table 3. The scenario of fire initiation is the same in all three alternatives. The position of stove and cupboards with respect to the window in the fire room is also assumed to be the same in all alternative floor plans. 4.3. Fire Development and Scenarios. Haemodialysis unit and catering department are operated only in the daytime and so lives of patients and staff cannot be threatened if the fire will break out in the night time. If the fire breaks out, the people staying in the second floor will be threatened by heat radiation, toxic gases in the smoke, and impaired visibility which can complicate the evacuation. People staying in the first floor will be endangered by toxic combustion gasses. They can penetrate from the floor of fire origin into the rooms where patients and staff stay. The most relevant criterion of reaching untenable conditions is the smoke interface height. In the present case study, this height is assumed to be equal to 2 m above the floor in all rooms of the building. The combustion gasses can spread from the second floor to the first floor by two ways: (1) through the vertical shaft of the freight elevator if the elevator doors ED1 and ED2 are left open due to negligence or when the fire outbreaks during loading and unloading operations (Figures 5 and 7 to 9); (2) through the stairwell in the case that doors to the stairwell, D21 and D13 , are open in both first and second floor (Figures 5 and 6). Leakage of combustion products between the second and first floors through other paths is considered to be negligible. The ventilations located in the first and second floors are not interconnected. In case of fire, these systems will be shut down by fire alarm.
Mathematical Problems in Engineering Occupants in haemodialysis unit, kitchen, and canteen have four escape routes: (1) Escape route ER11 (first floor, horizontal evacuation): from the haemodialysis unit to the stairwell through the door D13 and then to the outside through D11 and D12 (Figure 5). (2) Escape route ER12 (first floor, horizontal evacuation): from the haemodialysis unit to the reception unit and then to the main building of the hospital (Figure 5). (3) Escape route ER21 (second floor, horizontal, and vertical evacuation): from the kitchen and canteen to the stairwell through the door D21 and then to the outside through D11 and D12 (Figures 5 and 6). (4) Escape route ER22 (second floor, horizontal evacuation): from the kitchen and canteen to the main building of the hospital through the door D2,12 (Figures 7 to 9). Two fire scenarios leading to a maximum growth in combustion product concentration (toxicity and limitation of visibility) in the first and second floor will be considered. In the first scenario, the fire is confined to the second floor because the elevator door ED2 and the door to the stairwell, D21 , are closed (Figure 6). This fire scenario involves different event sequences for the alternative floor plans 𝑎1 , 𝑎2 , and 𝑎3 : (i) 𝑎1 : the staff rooms 1 and 2 and the storeroom are unoccupied when the fire outbreaks (Figure 6); the combustion products will block the escape route ER21 in a relatively short time and the evacuation will occur through the escape route ER22 (Figure 7); the untenable conditions on ER22 will first be reached in the service room at the time 𝑇𝑢,12 . (ii) 𝑎2 : untenable conditions on the escape route ER22 will be first reached in the room including service area and seating room at the time 𝑇𝑢,22 (Figure 8). Evacuation of staff and visitors of the canteen will be possible through the escape route ER21 (Figure 6). (iii) 𝑎3 : untenable conditions will be reached first in the fire room and kitchen room 1 (Figure 9); however, the kitchen staff will leave these rooms relatively quickly; the kitchen room 2 can be evacuated through the kitchen room 3; consequently, the escape route ER22 will be blocked for kitchen staff staying in room 2 when the untenable conditions will occur in the kitchen room 3 at the time 𝑇𝑢,32 ; the evacuation of kitchen staff in the service area and visitors in the seating areas will be possible through the escape route ER22 . In the second scenario, the combustion products will spread to the haemodialysis unit in the first floor through the shaft of the freight elevator. This scenario will take place when the elevator doors in the first and second floors, ED1 and ED2 , are left open in the course of fire (Figures 5 and 6). The travel of the combustion products from the first to the second floor through the stairwell is considered to be small because the spring doors D13 and D21 close automatically
13 Zone temp. (∘ C)
337 305 273 242 210 178 146 114 82.6 50.8 19.0
Figure 13: A visualisation of the CFAST model developed for the second fire scenario and the alternative floor plan 𝑎1 (Figure 7).
after evacuees pass them. In the second scenario, the times to untenable conditions in the second floor will not be considered because the leakage through elevator shaft will decrease the concentrations of combustion products with respect to concentrations reached in the first scenario. The differences between the position of the fire room in 𝑎1 , 𝑎2 , and 𝑎3 as well as in the wall plans of these alternatives will lead to different times to untenable conditions in the first floor, 𝑇𝑢,𝑖1 (𝑖 = 1, 2, 3). 4.4. Fitting Probability Distributions of the Criteria. The times to untenable conditions 𝑇𝑢,𝑖1 and 𝑇𝑢,𝑖2 can be estimated by means of a computer fire simulation. Input information for this simulation can be generated by means of a stochastic simulation. In the present study, the fire was simulated by means of the computer model CFAST for each of 𝑎1 , 𝑎2 , and 𝑎3 . A visualisation of the CFAST model developed for the alternative 𝑎1 is given in Figure 13. For each MCDM alternative, the fire simulation was carried out by embedding the CFAST algorithm in the loop of a stochastic simulation. The loop was repeated 100 times. The number of repetitions will be denoted by 𝑁𝑘 (i.e., 𝑁𝑘 = 100). The following four-step procedure was repeated each time (the time 𝑘): (1) The values 𝜉𝑜𝑘 to 𝜉𝑤𝑎,𝑘 of the random variables 𝜉𝑜 to 𝜉𝑤𝑎 summarised in Table 3 were generated by means of a stochastic simulation. (2) The 𝑘th value of the heat release rate of the pool fire, ̇ = 𝑞𝑜 + 𝜉𝑜𝑘 , was calculated and the pool fire with 𝑞𝑜𝑘 ̇ and duration 𝑡𝑜𝑘 was uploaded into constant HRR 𝑞𝑜𝑘 the CFAST model. (3) The 𝑘th values Ξ𝑓𝑘 and Ξ𝑐𝑘 of the HRR histories Ξ𝑓 and Ξ𝑐 defined by (9) and (11) were computed and uploaded into the CFAST model. These values were composed of the respective sums 𝑞𝑓 (𝑡𝑙 ) + 𝜉𝑓𝑘 (𝑡𝑙 ) and 𝑞𝑐 (𝑡𝑙 )+𝜉𝑐𝑘 (𝑡𝑙 ) (𝑙 = 1, 2, . . . , 17). The flue fire succeeded the pool fire after the time 𝑡𝑓0 = 50 s. (4) The computer fire simulation was carried out with the input information specified as indicated above and
14
Mathematical Problems in Engineering Table 4: Simulated samples of the times to untenable conditions.
Random time 𝑇𝑢,11 𝑇𝑢,12 𝑇𝑢,21 𝑇𝑢,22 𝑇𝑢,31 𝑇𝑢,32
∗
Simulated sample∗
Escape route blocked by smoke Alternative 𝑎1 , Figure 7 (𝑖 = 1) ∗∗ 𝜏11 = {𝑡𝑢,11𝑘 , 𝑘 = 1, 2, . . . , 𝑁𝑘 } ER12 , Figure 5 𝜏12 = {𝑡𝑢,12𝑘 , 𝑘 = 1, 2, . . . , 𝑁𝑘 } ER21 , Figure 6 Alternative 𝑎2 , Figure 8 (𝑖 = 2) 𝜏21 = {𝑡𝑢,21𝑘 , 𝑘 = 1, 2, . . . , 𝑁𝑘 } ER12 , Figure 5 𝜏22 = {𝑡𝑢,22𝑘 , 𝑘 = 1, 2, . . . , 𝑁𝑘 } ER22 , Figure 8 Alternative 𝑎3 , Figure 9 (𝑖 = 3) 𝜏31 = {𝑡𝑢,31𝑘 , 𝑘 = 1, 2, . . . , 𝑁𝑘 } ER12 , Figure 5 𝜏32 = {𝑡𝑢,32𝑘 , 𝑘 = 1, 2, . . . , 𝑁𝑘 } ER21 , Figure 6
Available escape route ER11 , Figure 5 ER22 , Figure 7 ER11 , Figure 5 ER21 , Figure 6 ER11 , Figure 5 ER22 , Figure 9
Sample elements 𝑡𝑢,𝑖2𝑘 (𝑖 = 1, 2, 3) are values of the respective random times 𝑇𝑢,𝑖2 . 𝑁𝑘 = 100 in all computer fire simulations.
∗∗
Table 5: Descriptive measures of the samples of the times to untenable 𝑇𝑢,𝑖1 related to the first fire scenario and the three alternative floor plans in the hospital building under reconstruction (𝑖 = 1, 2, 3). Sample statistic/distribution fitting results Sample size Mean, s Median, s Coeff. of variation, % Standardised skewness Standardised kurtosis Minimum, s Maximum, s KS-DN for normal distribution/𝑝 value KS-DN for lognormal distribution/𝑝 value KS-DN for Gumbel distribution/𝑝 value Fitted distribution Estimate of the 1st parameter∗ Estimate of the 2nd parameter∗ ∗
Sample of 𝑡𝑢,11𝑘 100 126.3 126.0 2.02 3.66 2.19 14.7 29.0 0.1015/0.2555 0.1039/0.2306 0.1584/0.0132 Normal 123.33 (mean) 2.56 (std. dev.)
Sample of 𝑡𝑢,21𝑘 100 236.1 236.0 1.66 1.17 0.37 223.0 245.0 0.071/0.6938 0.0738/0.6471 0.1179/0.1242 Normal 236.1 (mean) 3.91 (std. dev.)
Sample of 𝑡𝑢,31𝑘 100 57.5 57.25 4.26 2.34 1.75 51.75 65.75 0.0912/0.3805 0.0826/0.5156 0.0886/0.4175 Lognormal 4.05 (scale) 0.04 (shape)
Parameter of the fitted distribution.
the 𝑘th values of the times to untenable conditions, 𝑇𝑢,𝑖1 or 𝑇𝑢,𝑖2 , were obtained from the output information of CFAST. These times will be denoted by 𝑡𝑢,𝑖1𝑘 or 𝑡𝑢,𝑖2𝑘 . The simulation of the first fire scenario, in which the fire is initiated in the second floor and can spread to the first floor, produced three samples of the random times to untenable conditions, 𝑇𝑢,𝑖1 (𝑖 = 1, 2, 3). The samples are denoted by the symbols 𝜏11 , 𝜏21 , and 𝜏31 and explained in Table 4. These samples were used to fit the probability distributions of the respective random variables 𝑇𝑢,𝑖1 (𝑖 = 1, 2, 3) used as MCDM criteria and expressed by (5). Results of the distribution fitting are given in Table 5. The simulation of the second fire scenario, in which the fire is confined to the second floor, yielded three samples of the random times to untenable conditions, 𝑇𝑢,𝑖2 (𝑖 = 1, 2, 3). These samples are denoted by the respective symbols 𝜏12 , 𝜏22 , and 𝜏32 , (Table 4). The samples 𝜏12 , 𝜏22 , and 𝜏32 were used to fit probability distributions for the random variables 𝑇𝑢,𝑖2 (𝑖 = 1, 2, 3). The fitted distributions are described
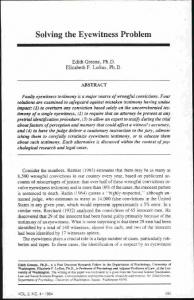
in Table 6. These variables appear in the MCDM criterion expressed by (6). The travel times 𝑇tr,𝑖2 were estimated by means of the computer model SIMULEX. The computer simulation was repeated 100 times and produced three samples of 𝑇tr,𝑖2 values {𝑡tr,𝑖2𝑘 , 𝑘 = 1, 2, . . . , 100} (𝑖 = 1, 2, 3). Elements of these samples, 𝑡tr,𝑖2𝑘 , were obtained with different simulated numbers of visitors in the canteen, 𝜉V𝑘 . In addition, locations of visitors and kitchen staff were randomly distributed for each 𝑘 and 𝑖. The random numbers of the visitors, 𝜉V𝑘 , were sampled from a binomial distribution by assuming that the maximum number of seats in the canteen is equal to 30: 𝜉V ∼ 𝐵(0.3, 30) (binomial distribution with the mean of 9). In the simulation of evacuation, the number of kitchen staff members remained constant and equal to six persons in all simulations. Figure 14 shows the distribution of nine visitors (𝜉V𝑘 = 9) in the canteen and six kitchen staff members at the commencement of evacuation. = Descriptive measures of the samples {𝑡tr,𝑖2𝑘 , 𝑘 1, 2, . . . , 100} (𝑖 = 1, 2, 3) as well as probability distributions fitted to these samples are presented in Table 7.
Mathematical Problems in Engineering
15
Table 6: Descriptive measures of the samples of the times to untenable 𝑇𝑢,𝑖2 related to the second fire scenario and the three alternative floor plans (𝑖 = 1, 2, 3). Sample statistic/distribution fitting results Sample size Mean, s Median, s Coeff. of variation, % Standardised skewness Standardised kurtosis Minimum, s Maximum, s KS-DN/𝑝 value (normal distr.) KS-DN/𝑝 value (lognormal d.) KS-DN/𝑝 value (Gumbel distr.) Fitted distribution Estimate of the 1st parameter∗ Estimate of the 2nd parameter∗ ∗
Sample of 𝑡𝑢,12𝑘 100 143.09 144 3.98 0.19 −1.05 132.0 156.0 0.0914/0.3771 0.0979/0.2944 0.1294/0.0702 Normal 143.09 (mean) 5.69 (std. dev.)
Sample of 𝑡𝑢,22𝑘 100 123.63 123 4.33 2.03 0.9 110.0 139.0 0.1125/0.1594 0.1038/0.2322 0.0868/0.4456 Gumbel 121.09 (mode) 4.89 (scale)
Sample of 𝑡𝑢,32𝑘 100 74.03 74 3.51 1.01 −0.55 68.5 80.5 0.1075/0.1981 0.1008/0.2629 0.1314/0.0632 Lognormal 4.30 (scale) 0.04 (shape)
Parameter of the fitted distribution.
Table 7: Descriptive measures of the samples of travel times 𝑇tr,𝑖2 elapsed during the evacuation from the second floor (𝑖 = 1, 2, 3). Sample statistic/distribution fitting results Sample size Mean, s Median, s Coeff. of variation, % Standardised skewness Standardised kurtosis Minimum, s Maximum, s KS-DN/𝑝 value (normal distr.) KS-DN/𝑝 value (lognormal d.) KS-DN/𝑝 value (Gumbel distr.) Fitted distribution Estimate of the 1st parameter∗ Estimate of the 2nd parameter∗ ∗
Sample of 𝑡tr,12𝑘 100 19.72 19.5 0.134 3.6553 2.189 14.7 29.0 0.1118/0.1646 0.0890/0.4118 0.0687/0.7335 Gumbel 18.51 (mode) 2.148 (scale)
Sample of 𝑡tr,22𝑘 100 18.47 18.35 0.18 1.0029 −1.721 12.6 25.7 0.0631/0.8213 0.0650/0.7925 0.0744/0.6379 Normal 18.47 (mean) 3.32 (std. dev.)
Sample of 𝑡tr,32𝑘 100 22.0 21.6 0.14 0.6941 −1.0195 15.8 28.9 0.0658/0.7790 0.0516/0.9529 0.0723/0.6728 Lognormal 3.08 (scale) 0.14 (shape)
Parameter of the fitted distribution.
4.5. The Random Decision-Making Matrix and Selection of the Best Alternative. A MCDM analysis was carried out by taking into account five criteria 𝑐1 to 𝑐5 explained in Table 8. The criteria related to the fire safety, 𝑐1 and 𝑐2 , were the respective random times 𝑇𝑢,𝑖1 and 𝑇tr,𝑖2 −𝑇𝑢,𝑖2 , selected as MCDM criteria in Section 4.1 (see (5) and (6)). Hereby, Table 8 contains random and nonrandom components of the decision-making ̃ The kitchen area 𝑐3 was included among the criteria matrix C. because the kitchen will still perform the catering function in the hospital even after the reconstruction of the second floor. The larger the kitchen area is, the better the conditions will be to perform this function. Floor reconstruction cost 𝑐4 and estimated reconstruction time 𝑐5 are natural criteria of a building-related MCDM and they do not need further explanation. The weights 𝑤𝑗 given in Table 8 mean that the greatest significance was assigned to the criteria associated
with the life safety (𝑤1 + 𝑤2 = 0.6). The floor reconstruction cost is also among the significant criteria (𝑤4 = 0.25). The alternatives 𝑎1 , 𝑎2 , and 𝑎3 were ranked by applying a simulation-based MCDM procedure proposed by Vaidogas and Zavadskas [37]. Six deterministic MCDM methods developed in the game theory and described in the book [38] (criteria 𝐾1 to 𝐾6 ) were embedded in a simulation ̂ loop. All criteria were applied to the matrix of estimates, C, obtained from the matrix of dimensionless criteria, C, with the criterion weights 𝑤𝑗 given in Table 8. The matrix C was computed with the vector-norm normalisation method (e.g., [37, 41]). A total of a million simulation steps were applied to propagate the uncertainty modelled by the times 𝑇𝑢,𝑖1 and 𝑇tr,𝑖2 − 𝑇𝑢,𝑖2 . In the 𝑙th step, the criteria 𝐾1 to 𝐾6 were applied ̃𝑙 . to find 𝑎∗ by using the sampled decision-making matrix C
16
Mathematical Problems in Engineering
̃𝑇 (bold cells) composed for the choice among the fire alternative floor plans in a Table 8: The transposed random decision-making matrix C hospital building shown in Figures 7 to 9. Criteria Random time to untenable conditions, 𝑐1 Random time to untenable conditions minus random travel time, 𝑐2 Kitchen area, 𝑐3 Floor reconstruction cost, 𝑐4 Estimated reconstruction time, 𝑐5
Unit of 𝑐𝑖
Preference
Weights, 𝑤𝑗
Plan 𝑎1
Plan 𝑎2
Plan 𝑎3
Sec.
Min
0.35
Tu,11
Tu,21
Tu,31
Sec.
Max
0.25
Tu,12 − Ttr,12
Tu,22 − Ttr,22
Tu,32 − Ttr,32
m2 Thous. of C Months
Max Min Min
0.1 0.25 0.05
42.7 458.0 3.5
49.1 298.5 2.1
52.2 315.6 2.0
0
10
Exit 5
20
20
Canteen visitors
Kitchen staff
10
10
Link 2
0
0
0
10
Figure 14: Random distribution of the kitchen staff and nine visitors of the canteen before commencement of evacuation in the floor 𝑎1 shown in Figure 7 (SIMULEX model).
Mathematical Problems in Engineering
17
Table 9: Results of the choice among the alternative floor plans 𝑎1 , 𝑎2 , and 𝑎3 designed for a hospital building and shown in Figures 7 to 9. MCDM criterion Wald’s 𝐾1 Savage’s 𝐾2 Bernoulli-Laplace 𝐾3 Hurwicz’s 𝐾4 (𝜆 = 0.5) Bayes’s criterion 𝐾5
Frequency(1) of choosing 𝑎𝑖 as 𝑎∗ fr1 fr2 fr3 0.4639 0.5361 0 0
0.1156 × 10
0.9988 0
−2
1 −3
0.331 × 10
Hodges-Lehman’s (𝛿 = 0.5) 0.1827 × 10⁻¹ (1)
0
1
0 0
0.9997
0
0.9817
0
The frequencies fr1 , fr2 , and fr3 were computed with 𝑁𝑙 = 1 × 10⁶ .
The frequencies of choosing the 𝑎1 , 𝑎2 , and 𝑎3 as the best ones, 𝑓𝑟1 , 𝑓𝑟2 , and 𝑓𝑟3 , are summarised in Table 9.
5. Conclusions The building design that takes into account alternative architectural and structural solutions has been considered. A universal methodology known as MCDM can be applied to rank available alternative designs. MCDM can be used at different levels of development of a building project. Each alternative design is characterised by a number of MCDM criteria which are juggled simultaneously. Fire is prevailing hazard in most buildings and a builtin fire protection is an important part of each building project. Methods of MCDM allow including criteria related to building fire safety. The most important criteria express life safety of occupants. The main finding of this paper is that two criteria can be used for MCDM: (1) probability of a successful evacuation of occupants from a building in fire and (2) difference between evacuation time and time to untenable conditions along available evacuation paths. These criteria are in general uncertain quantities. The probability can be uncertain in the epistemic sense and the difference in times will be uncertain in the aleatory (stochastic) sense. Probability distributions of these criteria can be estimated by a Monte Carlo simulation of fire and evacuation processes. Problem with uncertain safety-related criteria can be solved by means of stochastic MCDM methods. An application of such a method was illustrated by an example, in which alternative architectural floor plans of a hospital building were compared.
Appendix See Tables 5, 6, and 7.
Conflict of Interests The authors declare that there is no conflict of interests regarding the publication of this paper.
References [1] R. Binnekamp, Preference—Based Design in Architecture, IOS Press, Amsterdam, The Netherlands, 2010. [2] D. Kim, S. Lee, and S. A. Kim, “A visualization system for the comfort analysis of modular architecture: a case study,” in Cooperative Design, Visualization, and Engineering, vol. 7467 of Lecture Notes in Computer Science, pp. 247–254, Springer, 2012. [3] V. Granadeiro, J. P. Duarte, J. R. Correia, and V. M. S. Leal, “Building envelope shape design in early stages of the design process: integrating architectural design systems and energy simulation,” Automation in Construction, vol. 32, pp. 196–209, 2013. [4] M. Ehrgott, J. R. Figueira, and S. Greco, Trends in Multiple Criteria Decision Analysis, Springer, New York, NY, USA, 2010. [5] J. Wong, H. Li, and J. Lai, “Evaluating the system intelligence of the intelligent building systems. Part 1: development of key intelligent indicators and conceptual analytical framework,” Automation in Construction, vol. 17, no. 3, pp. 284–302, 2008. [6] R. Mora, G. Bitsuamlak, and M. Horvat, “Integrated life-cycle design of building enclosures,” Building and Environment, vol. 46, no. 7, pp. 1469–1479, 2011. [7] K. Mela, T. Tiainen, and M. Heinisuo, “Comparative study of multiple criteria decision making methods for building design,” Advanced Engineering Informatics, vol. 26, no. 4, pp. 716–726, 2012. [8] D. J. Rasbash, G. Ramachandran, B. Kandola, J. M. Watts, and M. Law, Evaluation of Fire Safety, John Wiley & Sons, Chichester, UK, 2004. [9] C. M. Zhao, S. M. Lo, J. A. Lu, and Z. Fang, “A simulation approach for ranking of fire safety attributes of existing buildings,” Fire Safety Journal, vol. 39, no. 7, pp. 557–579, 2004. ˇ enait˙e, “Multi-attribute decision[10] E. R. Vaidogas and J. Sak˙ making in economics of fire protection,” Engineering Economics, vol. 22, no. 3, pp. 262–270, 2011. ˇ [11] E. R. Vaidogas and J. Sakenaite, “Protecting built property against fire disasters: Multi-atribute decisio n making with respect to fire risk,” International Journal of Strategic Property Management, vol. 14, no. 4, pp. 391–407, 2010. [12] J. Choi, H. Kim, and I. Kim, “Open BIM-based quantity takeoff system for schematic estimation of building frame in early design stage,” Journal of Computational Design and Engineering, vol. 2, no. 1, pp. 16–25, 2015. [13] J. Wood, K. Panuwatwanich, and J.-H. Doh, “Using LOD in structural cost estimation during building design stage: pilot study,” Procedia Engineering, vol. 85, no. 5, pp. 543–552, 2014. [14] C. Kahraman, Ed., Fuzzy Multi-Criteria Decision Making. Theory and Applications with Recent Developments, vol. 16 of Springer Optimization and Its Applications, Springer, New York, NY, USA, 2008. [15] P. Ayala, A. Cantizano, C. Guti´errez-Montes, and G. Rein, “Influence of atrium roof geometries on the numerical predictions of fire tests under natural ventilation conditions,” Energy and Buildings, vol. 65, pp. 382–390, 2013. [16] R. M. Doheim, Y. G. Yohanis, A. Nadjai, and H. Elkadi, “The impact of atrium shape on natural smoke ventilation,” Fire Safety Journal, vol. 63, pp. 9–16, 2014. [17] G.-Y. Wu and H.-Ch. Huang, “Modeling the emergency evacuation of the high rise building based on the control volume model,” Safety Science, vol. 73, no. 5, pp. 62–72, 2015.
18 [18] G. de Sanctis, J. Kohler, and M. Fontana, “Probabilistic assessment of the occupant load density in retail buildings,” Fire Safety Journal, vol. 69, pp. 1–11, 2014. [19] J. R. Hall, The Total Cost of Fire in the United States, NFPA, Quincy, Mass, USA, 2014. [20] J. Xin and C. Huang, “Fire risk analysis of residential buildings based on scenario clusters and its application in fire risk management,” Fire Safety Journal, vol. 62, pp. 72–78, 2013. [21] B. Karlsson and J. G. Quintiere, Enclosure Fire Dynamics, CRC Press, Boca Raton, Fla, USA, 2000. [22] T. Korhonen and S. Hostikka, Fire Dynamics Simulator with Evacuation: FDS+Evac, VTT Technical Research Centre of Finland, Otaniemi, Finland, 2009. [23] R. Lovreglio, E. Ronchi, and D. Borri, “The validation of evacuation simulation models through the analysis of behavioural uncertainty,” Reliability Engineering and System Safety, vol. 131, no. 11, pp. 166–174, 2014. [24] A. M. Hasofer, V. R. Beck, and I. D. Bennetts, Risk Analysis in Building Fire Safety Engineering, Butterworth & Heinermann, Amsterdam, The Netherlands, 2007. [25] D. Yung, Principles of Fire Risk Assessment in Buildings, Wiley, Chichester, UK, 2008. [26] J. M. Watts, “Fire risk indexing,” in SFPE Handbook of Fire Protection Engineering, pp. 5-125–5-142, NFPA & SFPE, Quincy, Mass, USA, 3rd edition, 2002. ˇ enait˙e, Combined application of multi-attribute selection [27] J. Sak˙ and risk analysis to the assessment of building fire safety [Doctoral disertation], Technika, Vilnius, Lithuania, 2012. [28] E. K. Zavadskas and E. R. Vaidogas, “Multiattribute selection from alternative designs of infrastructure components for accidental situations,” Computer-Aided Civil and Infrastructure Engineering, vol. 24, no. 5, pp. 346–358, 2009. [29] S. Hostikka and O. Keski-Rahkonen, “Probabilistic simulation of fire scenarios,” Nuclear Engineering and Design, vol. 224, no. 3, pp. 301–311, 2003. [30] S. K. Au, Z.-H. Wang, and S.-M. Lo, “Compartment fire risk analysis by advanced Monte Carlo simulation,” Engineering Structures, vol. 29, no. 9, pp. 2381–2390, 2007. [31] X. Zhang, X. Li, and G. Hadjisophocleous, “A probabilistic occupant evacuation model for fire emergencies using Monte Carlo methods,” Fire Safety Journal, vol. 58, no. 5, pp. 15–24, 2013. [32] L. C. Cadwallader and S. A. Eide, “Component failure rate data sources for probabilistic safety and reliability,” Process Safety Progress, vol. 29, no. 3, pp. 236–241, 2010. ˇ [33] E. R. Vaidogas and J. Sakenaite, “A brief look at data on the reliability of sprinklers used in conventional buildings,” Journal of Civil Engineering and Management, vol. 17, no. 1, pp. 115–125, 2011. [34] M. Nowak, “Aspiration level approach in stochastic MCDM problems,” European Journal of Operational Research, vol. 177, no. 3, pp. 1626–1640, 2007. [35] Y. Liu, Z.-P. Fan, and Y. Zhang, “A method for stochastic multiple criteria decision making based on dominance degrees,” Information Sciences, vol. 181, no. 19, pp. 4139–4153, 2011. [36] Z.-P. Fan, Y. Liu, and B. Feng, “A method for stochastic multiple criteria decision making based on pairwise comparisons of alternatives with random evaluations,” European Journal of Operational Research, vol. 207, no. 2, pp. 906–915, 2010. [37] E. R. Vaidogas and E. K. Zavadskas, “Introducing reliability measures into multi-criteria decision-making,” International
Mathematical Problems in Engineering
[38]
[39]
[40]
[41]
Journal of Management and Decision Making, vol. 8, no. 5-6, pp. 475–496, 2007. S. French, Decision Theory: An Introduction to the Mathematics of Rationality, Ellis Harwood, Chichester, UK; Wiley, New York, NY, USA, 1988. H. Bottenbruch, H. J. Pradlwarter, and G. I. Schu¨eller, “The influence of spatial correlation of concrete strength on the failure probabilities of reinforced concrete chinneys,” Materials and Structures, vol. 22, no. 4, pp. 255–263, 1989. V. Babrauskas, “Heat release rates,” in SFPE Handbook of Fire Protection Engineering, pp. 3-1–3-37, NFPA & SFPE, Quincy, Mass, USA, 3rd edition, 2002. E. R. Vaidogas and L. Linkute, “Sitting the barrier aimed at protecting roadside property from accidental fires and explosions on road: a pre-optimisation stage,” The Baltic Journal of Road and Bridge Engineering, vol. 7, no. 4, pp. 277–287, 2012.
Advances in
Operations Research Hindawi Publishing Corporation http://www.hindawi.com
Volume 2014
Advances in
Decision Sciences Hindawi Publishing Corporation http://www.hindawi.com
Volume 2014
Journal of
Applied Mathematics
Algebra
Hindawi Publishing Corporation http://www.hindawi.com
Hindawi Publishing Corporation http://www.hindawi.com
Volume 2014
Journal of
Probability and Statistics Volume 2014
The Scientific World Journal Hindawi Publishing Corporation http://www.hindawi.com
Hindawi Publishing Corporation http://www.hindawi.com
Volume 2014
International Journal of
Differential Equations Hindawi Publishing Corporation http://www.hindawi.com
Volume 2014
Volume 2014
Submit your manuscripts at http://www.hindawi.com International Journal of
Advances in
Combinatorics Hindawi Publishing Corporation http://www.hindawi.com
Mathematical Physics Hindawi Publishing Corporation http://www.hindawi.com
Volume 2014
Journal of
Complex Analysis Hindawi Publishing Corporation http://www.hindawi.com
Volume 2014
International Journal of Mathematics and Mathematical Sciences
Mathematical Problems in Engineering
Journal of
Mathematics Hindawi Publishing Corporation http://www.hindawi.com
Volume 2014
Hindawi Publishing Corporation http://www.hindawi.com
Volume 2014
Volume 2014
Hindawi Publishing Corporation http://www.hindawi.com
Volume 2014
Discrete Mathematics
Journal of
Volume 2014
Hindawi Publishing Corporation http://www.hindawi.com
Discrete Dynamics in Nature and Society
Journal of
Function Spaces Hindawi Publishing Corporation http://www.hindawi.com
Abstract and Applied Analysis
Volume 2014
Hindawi Publishing Corporation http://www.hindawi.com
Volume 2014
Hindawi Publishing Corporation http://www.hindawi.com
Volume 2014
International Journal of
Journal of
Stochastic Analysis
Optimization
Hindawi Publishing Corporation http://www.hindawi.com
Hindawi Publishing Corporation http://www.hindawi.com
Volume 2014
Volume 2014