as that the 99th percentile of response times is less than 300 ms. Power management technology built in to current microprocessors includes techniques such as ...
Response-Time Modeling for Resource Allocation and Energy-Informed SLAs Peter Bod´ık, Charles Sutton, Armando Fox, David Patterson, Michael Jordan University of California, Berkeley, CA 94720 {bodikp,casutton,fox,pattrsn,jordan}@eecs.berkeley.edu The growth of Internet datacenters is increasingly limited by their power consumption. Powering and cooling a datacenter now rivals the cost of the hardware: each $1 spent on servers in 2005 required an additional $0.48 to power and cool it, expected to rise to $0.71 by 2010 [4]. Techniques to scale down power consumption during periods of low workload are therefore desirable. However, datacenter operators also typically require a strong guarantee on the tail of the response-time distribution called a service-level agreement (SLA), such as that the 99th percentile of response times is less than 300 ms. Power management technology built in to current microprocessors includes techniques such as dynamic voltage and frequency scaling (DVFS), which dynamically reduces the CPU frequency during periods of low utilization. In actual datacenters, however, the built-in DVFS is almost never used, because conventional wisdom holds that its use leads to unpredictable service times. Indeed, this concern is justified, because built-in power management strategies are oblivious to the desired SLA, so they cannot increase resources when the desired performance objective is not met. In this work, we present a power management strategy that explicitly predicts the expected application performance, and so can manage power subject to the desired SLA. To do this, we estimate the response time of the application as a function of workload, resource allocation, and various power management settings. We fit the tail of the conditional distribution using nonlinear quantile regression [2]. This allows a control loop that sets the power management settings to minimize power consumption, as long as the predicted response time meets the SLA. Indeed, we show that for a particular single-tier web application, the built-in DVFS violates the SLA for long periods, while our power-management method does not. This allows operators to achieve the monetary and environmental benefits of power management without an unacceptable cost to performance. This framework can be extended in two interesting directions. First, the model can be used offline as an additional source of information in choosing the SLA, because it allows exploring how sensitive the power consumption is to changes in the SLA. Second, the modeling and control framework can be extended to include other resource allocation decisions as well, such as horizontal replication and dynamic updates of various datacenter configuration options.
1
Response-time modeling
Since datacenter operators usually require guarantees on the tail of the response time distribution, such as the 99th or 99.9th percentile [1], we use quantile regression to estimate the performance models. To illustrate our approach, we consider a simple Ruby on Rails web application deployed on a single server with DVFS capabilities. In order to use as little power as possible, we would like to choose the lowest clock rate of the four supported CPU frequencies (1.0, 1.8, 2.0, or 2.2GHz), as long as given the current workload, the predicted 99th quantile of response time still meets the desired objective (400 ms in the experiments here).
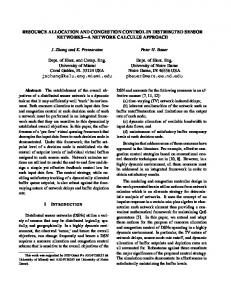
We obtain the performance model of this application by subjecting it to varying workload levels, from 0 requests per second (rps) to about 50 rps, once for each frequency of the CPU. Next, we use quantile regression to fit a model of the 99th percentile of the response time for each CPU frequency; we use parametric model of this form: rt99th (w) = a1 + a2 ∗ w + exp(a3 + a4 ∗ w), where w is the workload request rate. In Figure 1a, we show the observed data and fitted models. On held-out data, the absolute difference between the predicted and observed quantiles, averaged over the 20 bins shown in the figure, is 33 ms. The exponential shape of the curve models the fact that response times tend to become arbitrarily long once the workload exceeds capacity. Note that this modeling framework avoids the unrealistic assumption that the response time depends linearly on CPU frequency. We are currently working on performance models that handle multi-tier applications and more realistic workloads and resource allocation.
2
On-line power management and resource allocation
The performance model allows us to use a power management policy that uses the lowest frequency of the CPU such that the resulting performance meets the SLA. This has two important advantages to a policy based solely on CPU utilization. First, we can provide predictions to an operator of the expected performance of the web application under the new configuration. Second, using only CPU utilization ignores the desired performance objective: Even when the CPU is not fully loaded, if the observed response time does not meet the objective, we may still wish to increase the frequency. We compare this policy to the “on-demand” policy [3] built-in to the standard Linux kernel. We use a 25 minute, linearly increasing workload with exponential interarrival times that peaks at about 33 rps. Figure 1b shows the response times for both policies, where our model-based policy uses an SLA of 400 ms, shown by the horizontal line. Up to 25 minutes, the on-demand policy violates the SLA in two out of five of the five-minute intervals, while our policy violates the SLA in none of the five-minute intervals. Of the seventy-five 20-second intervals, the on-demand policy violates the SLA in 39% of the intervals, while our policy violates the SLA in only 16% of the intervals. Because of fluctuation in workload, it is more difficult to maintain performance at finer time granularities. The model-based policy monitors the workload at 20-second intervals, so we do not report the performance at finer time granularity. The model-based policy spends 30% of its time at 1.0GHz, 54% at 1.8GHz, and 16% at 2.0GHz.1 Since performance models for 2.0 and 2.2GHz make almost identical predictions at 33rps, the model-based policy uses at most 2.0GHz without sacrificing performance. After 25 minutes, the workload exceeds the server’s capacity, so neither control scheme meets the SLA.
3
Setting SLAs
An interesting potential application for these performance models is to understand the tradeoffs involved in setting the SLAs in the first place. For each level of power consumption, we can find the resource allocation that maximizes performance over a historical workload, and thus help the owners of a datacenter understand whether a large reduction in power can be achieved by a slight (e.g., 50 ms) increase in the desired response time, or how much power would be required to decrease the response time significantly.
References [1] Giuseppe DeCandia, Deniz Hastorun, Madan Jampani, Gunavardhan Kakulapati, Avinash Lakshman, Alex Pilchin, Swaminathan Sivasubramanian, Peter Vosshall, and Werner Vogels. Dynamo: Amazon’s highly available key-value store. In Symposium on Operating Systems Principles (SOSP), 2007. 1 We do not currently measure the CPU clock rates selected by the on-demand policy and the actual power consumption of both policies, but we will collect this data before the MLSys workshop.
2
●
●●
0
10
20 30 workload [rps]
40
50
60 40
●●●
PowerNow! policy performance model policy workload 0
(a) Performance models
2.0GHz
20
●●
●●●●●●●●●
|
5
10 15 time [minutes]
20
(b) On-demand vs. model-based policy
Figure 1: At left, a boxplot of the actual response times of individual requests at CPU frequency of 2.2GHz; whiskers extend to data extremes, circles are 99th percentiles of observed data. The solid line represents the model of 99th percentile of response time. The dashed lines represent models for the remaining frequencies of CPU. At right, a comparison of the built-in on-demand and model-based power management policies. Each point is the observed 99th percentile of response time over a 20-second interval. In particular, between 15 min and 25 min, the on-demand policy consistently violates the SLA, while the model-based policy seldom does. The three intervals above the graph represent the frequencies selected by the model-based policy. [2] Roger Koenker and Gilbert Bassett. Regression quantiles. Econometrica, 1978. [3] Venkatesh Pallipadi and Alexey Starikovskiy. The ondemand governor. In Linux Symposium, 2006. [4] Jed Scaramella. Worldwide server power and cooling expense 2006 – 2010 forecast. IDC, 2006.
3
25
workload rate [rps]
●
1.8GHz
0
●
|
80
99th percentile of response time [ms] 0 100 300 500
●
0
response time [ms] 200 400 600 800
99th percentile @2.2GHz 99th percentile @2.0, 1.8, and 1.0GHz
1.0GHz