Doctoral Thesis
Robust Control of Systems with Parametric Uncertainty: An Algebraic Approach Ing. Radek Matušů
Supervisor: prof. Ing. Roman Prokop, CSc. Study programme: P2807 Chemical and Process Engineering Study course: 2612V045 Technical Cybernetics Zlín, Czech Republic, 2007
Published by Tomas Bata University in Zlín in 2007
Title: Robust Control of Systems with Parametric Uncertainty: An Algebraic Approach Název: Robustní řízení systémů s parametrickou neurčitostí: algebraický přístup
Key words: Control Theory, Robust Control, Parametric Uncertainty, Algebraic Methods, Control Design, Robust Stability Analysis, Time-Delay Systems, Time-Varying Systems, Matlab, Simulink, Polynomial Toolbox, Hot-Air Tunnel. Klíčová slova: Teorie řízení, robustní řízení, parametrická neurčitost, algebraické metody, návrh řízení, analýza robustní stability, systémy s dopravním zpožděním, časově proměnné systémy, Matlab, Simulink, Polynomial Toolbox, teplovzdušný tunel.
The full version of the Doctoral Thesis may be found at the Central Library TBU in Zlín. The electronic version of the Doctoral Thesis Summary may be found at www.utb.cz.
Copyright © Radek Matušů
PREFACE Automation is an inseparable part of our contemporary society. It helps to make human’s lives more comfortable and safer by replacing of many stereotype, dangerous or just, for human itself, unmanageable activities. Moreover, the utilization of automation usually significantly reduces the production and operational costs. Thanks to this, many areas of automation have been very attractive and deeply studied disciplines for decades, in the broad sense of the word, even for millennia. This doctoral thesis intends to append a tiny piece into the mosaic of knowledge in the field of automatic control theory and its application.
Herein, I would like to make use of the opportunity and acknowledge the assistance and encouragement of several persons. First of all, I must express gratefulness to my supervisor, prof. Roman Prokop, for his not only professional, but also helpful and kind approach to me throughout my Ph.D. studies. Next, my thanks go to many Ph.D. colleagues and other co-workers from Tomas Bata University in Zlín for creating friendly working atmosphere. And finally, I offer the warmest thanks to all my family for their love and support.
The work was supported by the Ministry of Education, Youth and Sports of the Czech Republic under grant No. MSM 7088352102. This assistance is also very gratefully acknowledged.
RESUMÉ Předkládaná disertační práce se zabývá problematikou robustního řízení jednorozměrných systémů obsahujících parametrickou neurčitost. Návrh studovaných a vylepšených spojitých řídicích algoritmů je založen na obecných řešeních Diofantických rovnic v okruhu ryzích a stabilních racionálních lomených funkcí. Množina stabilizujících regulátorů je dána Youla-Kučerovou parametrizací, přičemž volba vhodného regulátoru vzhledem k požadavkům uživatele spoléhá na využití podmínek dělitelnosti v daném okruhu. Jedna z výhod této algebraické syntézy spočívá v existenci jediného kladného ladicího parametru, který slouží k dodatečnému ovlivnění výsledného regulačního chování. Robustní stabilitu systémů řízení, které obsahují navržený regulátor a řízený systém s parametrickou neurčitostí lze ověřit prostřednictvím některého ze specifických nástrojů, jehož volba závisí především na struktuře neurčitosti. Mezi možné techniky patří např. Charitonovův teorém, věta o hranách, věta o 32 hranách či princip množiny hodnot v kombinaci s větou o vyloučení nuly. Popis nejen těchto ale i dalších metod je rovněž součástí práce. Vybrané algoritmy jsou implementovány do programového produktu, který je vytvořen v prostředí MATLAB + SIMULINK s podporou Polynomial Toolboxu. Možnosti programu jsou ukázány na sadě ilustrativních příkladů pro řízený systém s intervalovou neurčitostí. Mimo to, další provedené simulační experimenty naznačují využitelnost navržených zákonů řízení také pro zcela odlišný typ neurčitosti, v tomto konkrétním případě pro systémy s periodicky variantními parametry, obecně též s dopravním zpožděním. V neposlední řadě disertace prezentuje reálné identifikační a řídicí experimenty na laboratorním modelu teplovzdušného tunelu. Řada výsledků, získaných při řízení teploty žárovky a rychlosti proudění vzduchu, zcela jasně potvrzuje praktickou aplikovatelnost použitého přístupu.
ABSTRACT The doctoral thesis is focused on robust control of single-input single-output systems affected by parametric uncertainty. The proposed and improved continuous-time control design is based on general solutions of Diophantine equations in the ring of proper and Hurwitz-stable rational functions. The set of stabilizing controllers is given by known Youla-Kučera parameterization and the choice of the appropriate controller according to user requirements consists in utilization of divisibility conditions in the specified ring. One of advantages of this algebraic synthesis lies in the existence of single positive tuning parameter which serves for additional influencing of final closed-loop control behaviour. The robust stability of control systems containing designed regulator and controlled plant with parametric uncertainty can be verified via some specific tool. Its selection depends primarily on the uncertainty structure. For example the Kharitonov theorem, the edge theorem, the thirty-two edge theorem or the value set concept in combination with the zero exclusion condition belong among the potential techniques. However, not only these ones are described in this work. Moreover, the chosen algorithms are implemented into program created in MATLAB + SIMULINK environment with the support of the Polynomial Toolbox. The capabilities of the program are demonstrated on the set of illustrative examples for controlled system with interval uncertainty. Furthermore, additionally performed simulation experiments indicate utilizability of obtained control laws also for fundamentally different type of uncertainty, here specifically for systems with periodically time-varying parameters, generally with time delay. Last but not least, the thesis presents identification and control experiments on real laboratory model of hot-air tunnel. An array of results gained during control of bulb temperature and airflow speed clearly affirms the practical applicability of the approach.
CONTENT LIST OF FIGURES ....................................................................................................15 LIST OF TABLES ......................................................................................................19 GLOSSARY OF SYMBOLS AND ABBREVIATIONS..........................................21 1.
INTRODUCTION ..............................................................................................27 1.1.
MOTIVATION AND BACKGROUND ................................................................27
1.2.
OVERVIEW OF THE THESIS............................................................................28
1.3.
ADOPTED NOTATION AND NUMERATION .....................................................29
2.
STATE OF THE ART........................................................................................31
3.
GOALS OF THE THESIS.................................................................................37
4.
SYSTEMS WITH PARAMETRIC UNCERTAINTY ....................................39 4.1.
BASIC TERMS AND CLASSIFICATION ............................................................39
4.2.
SINGLE PARAMETER UNCERTAINTY .............................................................43
4.2.1.
Maximal stability interval and Bialas eigenvalue criterion ................46
4.2.2.
Convex combinations, directions and extreme point results ...............48
4.3.
INTERVAL UNCERTAINTY .............................................................................50
4.3.1.
The Kharitonov theorem......................................................................52
4.3.2.
The Kharitonov rectangle....................................................................54
4.3.3.
Graphical test of robust stability.........................................................57
4.3.4.
The value set concept and the zero exclusion condition......................60
4.3.5.
The overbounding method...................................................................61
4.4.
AFFINE LINEAR UNCERTAINTY .....................................................................64
4.4.1.
Convex set and convex hull .................................................................66
4.4.2.
Polytopes, extreme points and edges...................................................67
4.4.3.
Polytopes of polynomials and its value set..........................................70
4.4.4.
The edge theorem ................................................................................73
4.4.5.
The thirty-two edge theorem ...............................................................74
- 11 -
4.4.6.
5.
The sixteen plant theorem................................................................... 76
4.5.
MULTILINEAR AND MORE COMPLICATED UNCERTAINTIES ......................... 78
4.6.
UNCERTAIN TIME DELAY ............................................................................. 82
ALGEBRAIC CONTROL DESIGN IN RPS.................................................... 85 5.1.
THEORETICAL BACKGROUND ...................................................................... 85
5.1.1.
Rings and fields .................................................................................. 85
5.1.2.
Transfer functions in RPS .................................................................... 86
5.1.3.
Divisibility in RPS ................................................................................ 87
5.1.4.
Diophantine equations........................................................................ 87
5.2.
CONTROLLER DESIGN .................................................................................. 88
5.3.
DERIVATION OF CONTROLLER FOR FIRST ORDER SYSTEM .......................... 91
5.4.
DERIVATION OF CONTROLLER FOR SECOND ORDER SYSTEM ...................... 93
5.5.
TUNING OF CONTROLLERS........................................................................... 96
5.5.1.
Robust stability conditions.................................................................. 97
5.5.2.
Sensitivity function.............................................................................. 98
5.5.3.
Nominal performance ......................................................................... 99
6.
SOFTWARE IMPLEMENTATION AND SIMULATION EXAMPLES.. 107
7.
CONTROL OF PERIODICALLY TIME-VARYING SYSTEMS ............. 117
8.
7.1.
SYSTEM DESCRIPTION ............................................................................... 117
7.2.
SIMULATION EXPERIMENTS ....................................................................... 120
7.2.1.
First order integrator ....................................................................... 120
7.2.2.
Second order plant ........................................................................... 121
7.2.3.
First order plant with time-varying delay ........................................ 123
REAL EXPERIMENTS .................................................................................. 125 8.1.
DESCRIPTION OF HOT-AIR TUNNEL AND USED EQUIPMENT ....................... 125
8.2.
BULB TEMPERATURE ................................................................................. 128
8.2.1.
System indentification....................................................................... 128
8.2.2.
Control experiments ......................................................................... 132
8.3.
AIRFLOW SPEED......................................................................................... 137
- 12 -
8.3.1.
System indentification .......................................................................137
8.3.2.
Control experiments ..........................................................................141
8.4. 9.
RESULTS AND DISCUSSION .........................................................................144
CONTRIBUTION TO SCIENCE AND PRACTICE....................................147
10. CONCLUSION .................................................................................................149 BIBLIOGRAPHY .....................................................................................................151 LIST OF AUTHOR’S RELATED PUBLICATIONS............................................161 AUTHOR’S CURRICULUM VITAE .....................................................................167
- 13 -
LIST OF FIGURES FIG. 4.1 – A PROBLEM TREE FOR ROBUST SYSTEMS ......................................................40 FIG. 4.2 – THE FEEDBACK SYSTEM FOR EXAMPLE 4.2 ...................................................45 FIG. 4.3 – ROOT LOCATIONS FOR EXAMPLE 4.2 .............................................................45 FIG. 4.4 – CONJUGATE COMPLEX ROOTS OF (4.34)........................................................50 FIG. 4.5 – KHARITONOV RECTANGLE OF INTERVAL POLYNOMIAL (4.48) FOR ω0 = 0.2 ..............................................................................................................................56
FIG. 4.6 – KHARITONOV RECTANGLES OF INTERVAL POLYNOMIAL (4.48) FOR ω ∈ 0;1 ..............................................................................................................................57 FIG. 4.7 – KHARITONOV RECTANGLES OF INTERVAL POLYNOMIAL (4.59) FOR ω ∈ 0; 3 ..............................................................................................................................58 FIG. 4.8 – KHARITONOV RECTANGLES OF INTERVAL POLYNOMIAL (4.59) – DETAILED VIEW......................................................................................................................59 FIG. 4.9 – THE VALUE SETS OF (4.34) ............................................................................60 FIG. 4.10 – GRAPHICAL REPRESENTATION OF THE OVERBOUNDING METHOD (SUCCESSFUL CASE) ..............................................................................................63 FIG. 4.11 – GRAPHICAL REPRESENTATION OF THE OVERBOUNDING METHOD (UNSUCCESSFUL CASE) .........................................................................................64 FIG. 4.12 – CLOSED-LOOP CONNECTION PRESERVING UNCERTAINTY STRUCTURE .......65 FIG. 4.13 – EXAMPLES OF CONVEX AND NONCONVEX SETS ..........................................66 FIG. 4.14 – A NONCONVEX SET AND ITS CONVEX HULL ................................................67 FIG. 4.15 – AN EXAMPLE OF A POLYTOPE IN R 2 ...........................................................68 FIG. 4.16 – MAPPING AN EDGE OF Q INTO THE INTERIOR OF p ( z , Q) ...........................71 FIG. 4.17 – POLYGONAL VALUE SETS FOR THE POLYNOMIAL (4.87) .............................72 FIG. 4.18 – CLOSED CONTROL LOOP WITH AN INTERVAL PLANT ...................................75 FIG. 4.19 – THE VALUE SETS OF FAMILY (4.108) (FULL VIEW AND DETAIL)..................80 FIG. 4.20 – THE VALUE SETS OF FAMILY (4.109) (FULL VIEW AND DETAIL)..................81 FIG. 4.21 – THE VALUE SETS OF FAMILY (4.110) (FULL VIEW AND DETAIL)..................81 FIG. 4.22 – THE VALUE SETS OF FAMILY (4.113) ...........................................................83 FIG. 5.1 – GENERAL CONTROL LOOP .............................................................................88
- 15 -
FIG. 5.2 – RELATION BETWEEN m AND UNDERSHOOT FOR: (5.54) – BLUE, (5.55) – GREEN, (5.56) – RED ........................................................................................... 100 FIG. 5.3 – RELATION BETWEEN m AND OVERSHOOT FOR: (5.54) – BLUE, (5.55) – GREEN, (5.56) – RED ........................................................................................... 100 FIG. 5.4 – TYPICAL CONTROL RESPONSES WITH FIRST UNDERSHOOT OR OVERSHOOT 101 FIG. 5.5 – CONTROL BEHAVIOUR OF 1DOF SYSTEM WITH PLANT (5.69) AND CONTROLLER (5.71) – CONTROL RESPONSE (BLACK), MANIPULATED VARIABLE (BLUE) ................................................................................................................ 104 FIG. 5.6 – THE CLOSED-LOOP CONTROL: PI REGULATOR (5.76) FOR HIGHER ORDER SYSTEM (5.72) (SOLID) AND NOMINAL ONE (5.74) (DOTTED) ............................ 106 FIG. 5.7 – THE CLOSED-LOOP CONTROL: PI REGULATOR (5.77) FOR HIGHER ORDER SYSTEM (5.73) (SOLID) AND NOMINAL ONE (5.75) (DOTTED) ............................ 106 FIG. 6.1 – THE WINDOW OF MAIN MENU ..................................................................... 107 FIG. 6.2 – STEP RESPONSES OF 2402 SYSTEMS FROM INTERVAL FAMILY (6.1) – (THE RED CURVE REPRESENTS THE NOMINAL PLANT) ................................................ 109 FIG. 6.3 – RESULTS OF ROBUST STABILITY INVESTIGATION FROM THE PROGRAM ..... 110 FIG. 6.4 – THE KHARITONOV RECTANGLES OF OVERBOUNDING INTERVAL POLYNOMIAL (FULL VIEW AND DETAIL)................................................................................... 111 FIG. 6.5 – THE VALUE SETS OF POLYTOPE OF POLYNOMIALS (6.4) (FULL VIEW AND DETAIL) .............................................................................................................. 111 FIG. 6.6 – SIMULINK SCHEME OF 1DOF CONTROL SYSTEM ..................................... 112 FIG. 6.7 – CONTROL OF RSS OF INTERVAL FAMILY (6.1) AND NOMINAL SYSTEM (RED CURVE) BY CONTROLLER (6.2)........................................................................... 112 FIG. 6.8 – THE KHARITONOV RECTANGLES OF OVERBOUNDING INTERVAL POLYNOMIAL (FULL VIEW AND DETAIL)................................................................................... 113 FIG. 6.9 – THE VALUE SETS OF POLYTOPE OF POLYNOMIALS (6.6) (FULL VIEW AND DETAIL) .............................................................................................................. 113 FIG. 6.10 – CONTROL OF RSS OF INTERVAL FAMILY (6.1) AND NOMINAL SYSTEM (RED CURVE) BY CONTROLLER (6.5)........................................................................... 114 FIG. 6.11 – CONTROL OF RSS OF INTERVAL FAMILY (6.1) AND NOMINAL SYSTEM (RED CURVE) BY CONTROLLER (6.7) – 1DOF ............................................................. 115 FIG. 6.12 – CONTROL OF RSS OF INTERVAL FAMILY (6.1) AND NOMINAL SYSTEM (RED CURVE) BY CONTROLLER (6.7), (6.8) – 2DOF.................................................... 115 FIG. 7.1 – COMPARISON OF STEP RESPONSES OF FIRST ORDER SYSTEMS (7.6) AND (7.7) ........................................................................................................................... 119
- 16 -
FIG. 7.2 – COMPARISON OF STEP RESPONSES OF SECOND ORDER SYSTEMS (7.8) AND (7.9) ....................................................................................................................119 FIG. 7.3 – CONTROL OF PLANT (7.6) ............................................................................121 FIG. 7.4 – CONTROL OF PLANT (7.8) ............................................................................122 FIG. 7.5 – CONTROL OF PLANT (7.10) ..........................................................................123 FIG. 8.1 – MODEL OF HOT-AIR TUNNEL CONNECTED TO PC VIA CTRL 51 UNIT .........125 FIG. 8.2 – SCHEME OF HOT-AIR TUNNEL AND WHOLE CONTROL SYSTEM ...................126 FIG. 8.3 – STATIC CHARACTERISTICS OF THE SYSTEM (U1 – Y3) .................................128 FIG. 8.4 – STEP RESPONSES OF THE SYSTEM (U1 – Y3) FOR STARTING VALUE u1 = 0 V ............................................................................................................................129 FIG. 8.5 – STEP RESPONSES OF THE SYSTEM (U1 – Y3) FOR STARTING VALUE u1 = 5V ............................................................................................................................129 FIG. 8.6 – EXAMPLE OF APPROXIMATION BY FIRST AND SECOND ORDER SYSTEM ......131 FIG. 8.7 – CONTROL OF BULB TEMPERATURE BY REGULATOR (8.10) .........................133 FIG. 8.8 – CONTROL OF BULB TEMPERATURE BY REGULATOR (8.13) .........................134 FIG. 8.9 – CONTROL OF BULB TEMPERATURE BY REGULATOR (8.15) .........................135 FIG. 8.10 – CONTROL OF BULB TEMPERATURE BY REGULATOR (8.18) .......................136 FIG. 8.11 – CONTROL OF BULB TEMPERATURE BY REGULATOR (8.19) .......................137 FIG. 8.12 – STATIC CHARACTERISTICS OF THE SYSTEM (U2 – Y7) ...............................138 FIG. 8.13 – STEP RESPONSES OF THE SYSTEM (U2 – Y7) FOR STARTING VALUE u 2 = 1V ............................................................................................................................138 FIG. 8.14 – STEP RESPONSES OF THE SYSTEM (U2 – Y7) FOR STARTING VALUE u 2 = 5V ............................................................................................................................139 FIG. 8.15 – EXAMPLE OF APPROXIMATION BY SECOND ORDER SYSTEM WITH DOUBLE TIME CONSTANT ..................................................................................................140 FIG. 8.16 – CONTROL OF AIRFLOW SPEED BY REGULATOR (8.26) ...............................142 FIG. 8.17 – CONTROL OF AIRFLOW SPEED BY REGULATOR (8.28) ...............................142 FIG. 8.18 – CONTROL OF AIRFLOW SPEED BY REGULATOR (8.30) ...............................143
- 17 -
LIST OF TABLES TAB. 5.1 – RELATION BETWEEN κ AND OVERSHOOT .................................................102 TAB. 7.1 – VARIOUS PARAMETERS OF CONTROLLER (5.23) ........................................121 TAB. 7.2 – VARIOUS PARAMETERS OF CONTROLLER (5.35) ........................................122 TAB. 8.1 – CONNECTION OF INPUT AND OUTPUT SIGNALS OF CTRL 51 UNIT .............127 TAB. 8.2 – RESULTS OF IDENTIFICATION FOR FIRST ORDER TRANSFER FUNCTION .....131 TAB. 8.3 – RESULTS OF IDENTIFICATION FOR SECOND ORDER TRANSFER FUNCTION .132 TAB. 8.4 – RESULTS OF IDENTIFICATION FOR SECOND ORDER TRANSFER FUNCTION WITH DOUBLE TIME CONSTANT...........................................................................140 TAB. 8.5 – OUTCOMES OF ISE CALCULATIONS FOR BULB TEMPERATURE ..................144 TAB. 8.6 – OUTCOMES OF ISE CALCULATIONS FOR AIRFLOW SPEED ..........................145
- 19 -
GLOSSARY OF SYMBOLS AND ABBREVIATIONS Symbols
H2 , H∞
norms for rational functions
m
single positive scalar tuning parameter
q
vector of real uncertain parameters (uncertainty for short)
Rl
l-dimensional space of real numbers
s
complex variable
G ( s, q )
transfer function of uncertain system
b( s, q )
uncertain polynomial in numerator of plant transfer function
a ( s, q )
uncertain polynomial in denominator of plant transfer function
t
time
x(t )
state vector
A(q)
uncertain matrix in state space description of a system
ρi ( q)
(i-th) coefficient function
p ( s, q )
uncertain polynomial
Q
uncertainty bounding set
qi− , qi+
minimal and maximal values of i-th component of q
P
family of polynomials
L∞ , L2
norms
p(s)
a polynomial
p0 ( s )
stable nominal polynomial
p1 ( s)
an arbitrary polynomial
C ( s)
transfer function of controller (both in ring of polynomials and RPS)
j
imaginary unit
ω
angular frequency
Qmax
maximal stability interval
- 21 -
− + qmin , qmax
minimum and maximum of Qmax
H ( p)
Hurwitz matrix of a fixed polynomial p
+ λmax
maximal positive real eigenvalue
− λmin
minimal negative real eigenvalue
λ
parameter λ ∈ 0;1
K1 ( s ), …, K 4 ( s)
Kharitonov polynomials
Re
real part
Im
imaginary part
ωc
cutoff frequency
p( jω , Q )
value set
qC ( s )
polynomial in numerator of controller transfer function
pC ( s )
polynomial in denominator of controller transfer function
GW Y ( s, q )
uncertain transfer function of closed-loop system
conv C
convex hull of a set C
P
a polytope
z
a complex number
C
set of all complex numbers
ωc
cutoff frequency
D
an open subset of the complex plane
ΦD
boundary sweeping function
I
a real interval
N edge
number of edges
r
alternative vector of real uncertain parameters
R
alternative uncertainty bounding set
pCL ( s, q, r )
uncertain closed-loop characteristic polynomial
B1 ( s ), … , B4 ( s )
Kharitonov polynomials of controlled plant numerator
A1 ( s), … , A4 ( s)
Kharitonov polynomials of controlled plant denominator
e( s , λ )
edge polynomial
- 22 -
k , z, p
gain, zero and pole of first order controller
K
gain of system
T
time constant of system
Td
time delay (dead time)
Cb ( s ), C f ( s )
feedback and feedforward part of the controller
pCL ( s, Td )
uncertain closed-loop characteristic quasipolynomial
Ω
a set (ring or field)
0
zero element
1
unit element
G(s)
transfer function of controlled plant
b( s ), a ( s )
numerator and denominator of G ( s ) (in ring of polynomials)
B ( s ), A( s )
numerator and denominator of G ( s ) (in RPS)
w( s )
reference value (in RPS)
n( s )
load disturbance in the input of the controlled system (in RPS)
v( s )
disturbance in the output of the controlled system (in RPS)
u (s)
control signal (in RPS)
y(s)
output signal from controlled system (in RPS)
e( s )
tracking error (in RPS)
QC ( s )
numerator of Cb ( s ) (in RPS)
PC ( s )
denominator of Cb ( s ) or C f ( s ) (in RPS)
RC ( s )
numerator of C f ( s ) (in RPS)
Gw ( s ), Fw ( s )
numerator and denominator of w( s ) (in RPS)
Gn ( s ), Fn ( s )
numerator and denominator of n( s ) (in RPS)
Gv ( s), Fv ( s)
numerator and denominator of v ( s ) (in RPS)
F
free member (in RPS)
S
sensitivity function
w(t )
reference value
y (t )
output signal from controlled system
- 23 -
u (t )
control signal
GW Y ( s ), GW E ( s )
transfer functions between respective signals
κ
a constant used in controller tuning
Tw
time constant of closed loop
h(t )
step response
y ( n ) (t ), … , y′(t )
derivations of output (controlled) signal
u ( m ) (t ), … , u ′(t )
derivations of control signal
G ( s, t )
“transfer function” of time-varying system
bm (t ), an (t )
time-varying (periodic) parameters
Td (t )
time-varying (periodic) delay
βm , α n , τ d
real constants (in periodic parameters)
λbm , λa n , λτ d
amplitudes (in periodic parameters)
ωbm , ωa n , ωτ d
angular frequencies (in periodic parameters)
y1, … , y 7
input channels of CTRL 51 unit
u1, … , u 3
output channels of CTRL 51 unit
τ
time constant in numerator of second order system
T1 , T2
time constants of second order system
GN ( s )
nominal system
Abbreviations
SISO
Single-Input Single-Output
MIMO
Multi-Input Multi-Output
RPS
Ring of Proper and (Hurwitz-)Stable rational functions
LQR
Linear Quadratic Regulation
LQG
Linear Quadratic Gaussian
LTI
Linear Time-Invariant
PID
Proportional Integral Derivative
LMI
Linear Matrix Inequality
- 24 -
GCF
the Greatest Common Factor
1DOF
one Degree Of Freedom
2DOF
two Degrees Of Freedom
FB
FeedBack
FBFW
FeedBack FeedforWard
GUI
Graphical User Interface
RSS
Representative Set of Systems
PC
Personal Computer
CPU
Central Processing Unit
EPROM
Erasable Programmable Read-Only Memory
RAM
Random Access Memory
A/D, D/A
Analog/Digital, Digital/Analog
ISE
Integrated Squared Error
TBU
Tomas Bata University
Besides aforementioned more or less general symbols and abbreviations, there are also other ones used “locally”, i.e. for the only purpose, in the thesis. Their meaning should be always clear from the context.
- 25 -
1. INTRODUCTION This preliminary chapter is supposed to give an explanation of the work motivation and background of the problem. Moreover, it clarifies the structure of the thesis and elucidates adopted conception of notation and numeration.
1.1. Motivation and background The principle of the closed loop has been the fundamental tool used for control of processes and objects in many fields of human activity in relatively unchanged form since antiquity. In the second half of the last century, the one of thorny problems emerged in theory of automatic control. New analytical methods of synthesis, which work on an assumption of exact mathematical model, have insufficiently taken note of uncertainty caused by imperfections in modelling or changeable physical properties. On that account, uncertain systems have become very attractive from the point of view of scientific research and also applications during previous almost three decades. It is fully natural, that an array of approaches to solve the related problems has been developed and improved during this long-term interest. The classical and probably also the most frequent task is to ensure appropriate control of the system which is affected by some changes, variations, perturbations or disturbances. In a very simplified way it can be said, that nowadays two basic principles, how to solve given problem, predominate. The first possibility is to assure unremitting adjusting of the controller according to changing conditions, i.e. its adaptivity. Adaptive controllers are elegant and attractive from the perspective of some “intelligent” behaviour, unfortunately they are comparatively complex and not always reliable. The second eventuality is to design the one fixed controller which guarantees suitable behaviour not only for nominal system, but also for some neighbourhood. In this case, it is spoken about robustness of the controller. Robust controllers are favoured in practice, simple and easily utilizable. On the contrary, the abilities of these compensators are limited at great or fast changes in controlled system or operating conditions and, furthermore, robust control responses need not to be always “nice”. Obviously, many problem formulations associated with uncertainty do
- 27 -
not fit neatly into only these two categories, e.g. stochastic problems, fuzzy control problems or singular perturbation problems. Moreover, there is no strict demarcation among mentioned problem areas in real world, but they are often interconnected. Contemporary practice quite clearly prefers usage of one, fixed, robust controller. This work is focused on theory, simulation and practical application problems related to control of single-input single-output (SISO) linear dynamical systems with parametric uncertainty via continuous-time regulators designed through the general solutions of Diophantine equations in the ring of proper and Hurwitz-stable rational functions (RPS).
1.2. Overview of the thesis The content of this work is divided into 10 main chapters. In an attempt to facilitate the orientation in the text for reader, a simple guideline throughout the thesis is provided. This first, introductory, part is intended for explaining the motivation for writing the thesis and background of the issue and, furthermore, it includes thesis overview and ends with clarification of adopted notation and numeration. The second chapter describes the current state of the art, inclusive of references to momentous literature. Then, the main goals of the thesis are defined in the third section. Next, fourth chapter starts with basic terms and theoretical aspects of robustness and continues with classification of systems with parametric uncertainty and description of typical tools of robust stability analysis for each individual uncertainty structure. Moreover, it includes many examples to illustrate given problems. The fifth part focuses on proposed algebraic approach to control design. Excluding the theoretical basis, it contains specific derivation of controller for first and second order plants for the sake of better demonstration of the synthesis process. Furthermore it is also concentrated on possible tuning of controllers via single positive parameter. The following, sixth, chapter is aimed to describe created MATLAB program for control and (closed-loop) robust stability analysis of interval systems. The capabilities of the product are shown on illustrative examples.
- 28 -
In an effort to test the utilizability of control algorithms also for other kind of perturbations and not only for parametrically uncertain systems, the seventh chapter deals with control of systems with periodically time-varying parameters, including time delay. The subsequent, eight, section presents results of identification and robust control experiments realized on two selected loops in real laboratory model of hot-air tunnel. The aim of the ninth chapter is to sum up main contribution of the thesis both for science community and practical applications. The final, tenth, chapter concludes the whole work.
1.3. Adopted notation and numeration The numeration of subsections is done within each main chapter. The numbers of figures, tables, equations and examples are always compound of number of main section, the dot and number of the item itself within the bounds of the section – e.g. fig. 8.2, tab. 5.1, equation (5.10) or example 4.15. Used literature is referred to by numbers enclosed by square brackets – e.g. [75]. The new terms or important information are highlighted using italics.
- 29 -
2. STATE OF THE ART In all classical control theory, the synthesis begins with a model of the controlled process. However, the behaviour of the real system is almost always different from the behaviour of the model. In a nutshell, the reason can be seen in inaccurate, simplified modelling and changes in physical parameters (the beginning of subhead 4.1 describes the origin of uncertainty in more detail). This incongruity begs the fundamental question, which is nicely formulated in [14]: “If we use an inexact mathematical model to derive the controller, will the system perform satisfactorily?” The introduction chapter has already outlined that two main approaches to overcome uncertainty predominate at present – adaptive control [7], based on continuous (on-line) identification of the process and on adjusting of the controller to current conditions, and robust control [1], [24], [51], [64], [82], ensuring preservation of certain properties of the control loop for the whole family of controlled plants. And just robust control has achieved great progress in last decades as a consequence of insufficient practical application of classical optimal control theories (LQR/LQG control, H2 optimal control, etc.). Robust control has been developed both in frequency (based on input-output model) and time (based on description in state space) domain. Moreover, the most of control problems has been solved, in compliance with the natural human behaviour, first for simpler systems described as SISO and only afterward for general MIMO systems. In brief, trio of principal tasks related to robustness can be seen in robust stability analysis, robustness margin problem and robust synthesis. Tools of robust stability investigation check (with necessary and sufficient or „only“ with sufficient condition) stability of closed control loop with uncertain plant and a priori designed controller. The aim of robustness margin question is to find the maximal uncertainty bounds under which the performance specification is satisfied. And finally, robust synthesis means setting of controller parameters to ensure robustness of closed loop. The determination of a low-order linear time-invariant (LTI) model from a physical system represents a separate problem. It can be distinguished between two different approaches. The first way obtains a simplified version of a very complex
- 31 -
mathematical description, usually based on complicated physical laws, such as a set of partial differential equations or a time delayed or a high order set of ordinary differential equations. This purely mathematical procedure of model simplification is called approximation [31], [33], [34]. The second technique, general identification, consists in computing a mathematical model from experimentally measured output of the system when a particular input signal is injected. Here, the classical parameter identification [43], [69] or more recent robust identification methods exist [2], [44]. Anyway, the outcome of these procedures should be some family of models. In other words, the idea of robust control assumes the physical plant as LTI model plus uncertainty. There are two principal uncertainty types and consequently two sorts of uncertain models. The first class, called parametric (or structured) uncertainty model, is often used when precise values of the actual parameters are not known and second one, nonparametric (or unstructured) model of uncertainty, is more suitable at disregarding of fast dynamics, nonlinearities, etc. [42]. Here, the additive and multiplicative form of uncertainty models can be distinguished. From the practical point of view, uncertainty is present in the plant in both the dynamics and the parameters. Their combination leads to the mixed uncertainty problem [17], [64], [72]. Furthermore, uncertainty bounding set is a ball in some appropriate norm. The most important are boundaries of a box or sphere shape. Many authors have aimed their attention to robust stability analysis of systems under parametric uncertainty and sequentially to synthesis of appropriate control systems [1], [14], [17]. The Kharitonov theorem [37] became the true milestone in this field. This instrument for testing of robust stability of interval polynomials uses four specially constructed ordinary polynomials, whose stability is equipollent to stability of the interval one. It is a curiosity, that the theorem got known, among others thanks to very complicated original proof, to scientific community not until its “rediscovery” in [13] and [19] all four years after the first publication. Afterward, many researchers picked up the threads of Kharitonov’s work by an array of new tools for more complicated uncertainty structures – for example the edge theorem [15], the thirty-two edge theorem alias the generalized Kharitonov theorem [22] which serve for systems
- 32 -
with affine linear uncertainty structure, the sixteen plant theorem [11] representing the specific tool for the same, but somehow restricted structure or the mapping theorem [14], [17], [78] for multilinear uncertainty. Furthermore, the universal graphical test of robust stability based on the value set concept and the zero exclusion condition [14] can be utilized not only for even more complicated uncertainty structures, but actually for all. In the matter of systems with nonparametric uncertainty, remind that the closed loop is indispensable for control “only” because of uncertainty and unknown disturbances or initial behaviour. In conventional feedback system, sensitivity reflects the measure of output disturbance rejection and tracking, and sensitivity to small additive parameter variations, i.e. it should be as small as possible to have good tracking of the reference signal and disturbance rejection, while complementary sensitivity reflects the capacity to suppress sensor noise and is also used as a measure of stability margin, thus, in order to prevent propagation measurement noise to the error and output signals, the complementary sensitivity must be low. The fact that the sum of these two functions is identical to one represents the serious restriction for design of controller, which should simultaneously guarantee stability, performance and robustness [16], [77]. The frequency separation and the choice of precedency in synthesis is known as loop shaping [25], [64]. The main principle of robust stability investigation for systems with nonparametric uncertainty can be seen in nowadays already classical small gain theorem defining the stability of closed loop in dependence on a norm (advantageously, utilizing the norm H∞) of transfer function of stable open loop [25], [80], [79]. Another model of nonparametric uncertainty used in control theory is in the absolute stability problem [17] where a fixed system is perturbed by a family of nonlinear feedback gains that are known to lie in a prescribed sector. By replacing the fixed system with a parameter dependent one, the more realistic mixed uncertainty problem is obtained. The control system synthesis has been very attractive and deeply studied discipline since approximately early 40s of the last century. The development of control design has gone from “classical” through “modern” up to “postmodern” approaches and the
- 33 -
outcome is a countless number techniques. The rudimentary tuning of PID controller by Ziegler and Nichols is believed to be basic, in common practice so far often sufficient, methodology. Among many others, the well known conventional tuning are Cohen-Coon, Chien-Hrones-Reswick and Naslin method, item standard forms of Whiteley or Butterworth, etc. Examples of relatively newer methods can be dynamics inversion [76] or balanced tuning of PI controllers [39]. Furthermore, there are methods using measuring of step responses or relay experiment. Åström and Hägglund in [5] purvey the overview of tuning of PI and PID-like controllers, as still the most used control devices. A period of late 1970s has brought polynomial techniques with controller design via solutions of Diophantine equations. The foundation stone of method proposed and improved in this thesis is an algebraic approach developed by Vidyasagar [75] and Kučera [41] and elaborated e.g. in [56], [59]. The control design is based on general solutions of Diophantine equations not in the common ring of polynomials but in the ring of proper and Hurwitz-stable rational functions. This method utilizes (Bongiorno)-Youla-Kučera parameterization of all stabilizing controllers and the choice of appropriate one according to user requirements is based on conditions of divisibility in the mentioned ring. The synthesis introduces the single positive scalar parameter which can be used for tuning of final controllers and for influencing control performance, robust stability, etc. Moreover, the methodology is utilizable also for unstable plants [57] or for time-delay systems [58], [62]. And finally, the researchers of “postmodern” era have been focused e.g. on theory of the structured singular value µ. It represents an important method both for analysis and synthesis of SISO and MIMO uncertain systems. The key idea consists in minimalization of µ with the assistance of so-called D-K iterations via repeated solution of H∞ problem [8], [53]. Other attractive techniques of last years are these ones based on LMIs (Linear Matrix Inequalities) [21]. It allows solving a wide spectrum of problems, including various restrictions. Once the problem is formulated in the LMI sense, it can be effectively resolved through algorithms of convex optimization. Furthermore, also the modern methods counting for example upon adaptive algorithms, predictive methods, fuzzy control systems, neural networks or
- 34 -
other achievement of artificial intelligence [81] can be utilized. However, this is a different story. From the practical, computational and programmer point of view, many tasks of analysis and synthesis are conveniently solvable via suitable software products. Generally, the packages such as MATLAB, Mathematica and Maple belong to the most known and used. The MATLAB + SIMULINK [73] environment combines efficient computation, visualization and programming. From an array of extensions, e.g. the Control System Toolbox, Robust Control Toolbox, LMI Control Toolbox, MuAnalysis and Synthesis Toolbox, and Polynomial Toolbox [55] are exploitable for robust control problems. Especially the Polynomial Toolbox contains many useful functions for solving of Diophantine equations, robust stability of systems with parametric uncertainty, etc. For illustration, some other programs are described in [71] (analysis of interval systems), [70], [54] (LMI solver and interface), [36] (control design and simulation for time-delay systems), [61] (for systems with periodic parameters) or [47] (for plants with interval uncertainty).
- 35 -
3. GOALS OF THE THESIS The principal goal of this doctoral thesis is to utilize proposed and improved robust control laws achieved through the general solutions of Diophantine equations in RPS for systems affected by parametric uncertainty. The work deals not only with theoretical aspects of robustness, uncertain systems, algebraic control design and tuning of controllers but also with implementation of selected algorithms into user-friendly MATLAB program, applicability of control laws for periodically time-varying systems and last but not least with problems of practical application, represented by utilization of designed robust regulators for control of bulb temperature and airflow speed in laboratory model of hot-air tunnel. Ergo, the main aims of the thesis can be summarized into the following points: 1. Classification of mathematical models affected by various uncertainties with emphasis on systems with parametric uncertainty. Overview of typical tools for robust stability analysis. 2. Formulation of algebraic approach to design of SISO continuous-time controllers in RPS. 3. Analysis of effect of tuning parameter m > 0 on closed-loop control behaviour from the viewpoint of nominal and robust stability and performance. 4. Implementation of appropriate analysis and synthesis methods into the program created in MATLAB + SIMULINK environment with utilization of the Polynomial Toolbox. Demonstration on suitable simulation examples. 5. Simulative verification of proposed design technique in control of systems with periodically time-varying parameters 6. Application of robust control algorithms on real laboratory model of hot-air tunnel.
- 37 -
4. SYSTEMS WITH PARAMETRIC UNCERTAINTY 4.1. Basic terms and classification Most of the industrial processes can be modelled as LTI systems, in spite of the fact, that their real behaviour is oftentimes different, much more complicated. The motivation is evident – owing to this, the transfer functions can be used for description of such systems and subsequently also the control theory of linear systems, which is very well-developed, can be applied. However, an effort to create the simple enough model almost always leads to the origin of uncertainty. Their emergence often consists in neglect of “less important properties”, especially from the realms of fast dynamic effects, nonlinearities or time-variant behaviours of the plant. Nevertheless, the presence of uncertainty can not be excluded even if the processes are in essence linear, because, strictly speaking, the physical parameters are never exactly known, possibly they can vary according to operating conditions. Ergo, the principal problem is, if the controller designed for nominal system will keep some properties of the feedback control loop also for really controlled system, which falls into certain neighbourhood – in other words, if the controller will keep these properties not only for one nominal system, but for the whole family of systems [42]. The uncertainty in constructed mathematical model and thus the size of neigbourhood which should the controller cope with can be taken into consideration and described in the two main ways – as parametric or nonparametric uncertainty. The former, nonparametric description of uncertainty lies in restriction of area of possible appearance of frequency characteristic. It is associated with unmodelled dynamics, truncation of high frequency modes, nonlinearities, randomness in the systems, etc. For instance, it is often embodied into model by replacing the transfer function of the controlled plant G ( s ) by the perturbed version G ( s ) + ∆G ( s ) (additive nonparametric uncertainty) and letting ∆G ( s ) range over a ball of H∞ functions of prescribed radius [17].
- 39 -
The latter, parametric approach then represents known structure but uncertain knowledge of actual physical parameters of the controlled system. Their possible values are usually bounded by intervals. In literature, also the classification into structured and unstructured uncertainty often appears – it can be understood as equipollent to the parametric and nonparametric cases. For adequate notion about possible structure of robustness problems, “a problem tree for robust systems” from [14], shown in fig. 4.1 can help.
Robustness problems
All other systems (nonlinear, time-varying, distributed, etc.)
Linear time-invariant systems Analysis
Synthesis
Structured real and complex uncertainty problems
Structured real and complex uncertainty problems
Unstructured complex uncertainty problems
Unstructured complex uncertainty problems
Fig. 4.1 – A problem tree for robust systems
This thesis deals primarily with systems with parametric uncertainty, i.e. the systems which have the known structure of their model, but the values of one or more parameters are uncertain (not known precisely). The issues consist in robustness analysis, robustness margin and robust synthesis problems. First, if the system is called robust, it means the following: Suppose that every member of family F (e.g. family of polynomials) has a property P (e.g. stability) – the family F is then designated as robust (or e.g. robustly stable). Next, the goal of robustness margin problem is to find the maximal uncertainty bounds under which preservation of property P (robustness) is satisfied. And finally, a characteristic of the robust synthesis problem is the presence of adjustable design parameters which need to be selected. More specific, the family of systems description is expanded to include design parameters which are chosen so as to guarantee that the subsequent robustness analysis
- 40 -
succeeds. It is obvious that from the control theory point of view, the adjustable design parameters above are related to a controller in a feedback control system. The systems with parametric uncertainty are often described via a vector of real uncertain parameters q. In a simplified way, vector q is frequently called the uncertainty. If the uncertainty is l-dimensional, it can be written either as: q = ( q1 , q2 ,… , ql )
(4.1)
or in other cases, it may be convenient to take q to be a column vector – it depends on a context. However, simple notation q ∈ R l is used in either event. The overwhelming majority of literature works with transfer functions and polynomials in Laplace transform with the only complex variable s in the argument. The possible and often used general description of uncertain systems is in the form of transfer function: G ( s, q ) =
b( s , q ) a ( s, q )
(4.2)
where b( s, q ) and a( s, q) are polynomials in s with coefficients depending on q: m
b( s, q ) = ∑ β i ( q ) s i
(4.3)
i =0 n
a ( s, q ) = ∑ α i ( q ) s i
(4.4)
i =0
or otherwise, assuming conventional state space representation x (t ) = Ax(t ) , the systems can be described as: x(t ) = A(q) x(t )
(4.5)
where A( q) is an uncertain matrix. Occasionally, it is useful to introduce a second vector of uncertain parameters, e.g. for distinguishing of uncertain parameters entering to the numerator or denominator of the plant transfer function. The very frequent subject of investigation is the uncertain characteristic polynomial of the closed-loop control system. Assume, that this polynomial is described by: n
p ( s, q ) = ∑ ρi ( q ) s i
(4.6)
i =0
- 41 -
In robustness problems, the vector of uncertain parameters q is often supposed to be confined by the uncertainty bounding set Q, which is usually given a priory, e.g. directly by user requirements. Generally, the set Q is taken to be a ball in some appropriate norm. The two most important cases are represented by L∞ and L2 norms. For the norm L∞ of the vector (4.1) it holds true: q
∞
= max qi
(4.7)
i
which implies that a ball in this norm is a box. For example, the description of a box with center q ∗ and unit radius can be accomplished via the relation q − q∗
∞
≤ 1 . The
box is mostly set by components, thus: Q = {q ∈ R l : qi− ≤ qi ≤ qi+ pro i = 1, 2,… , l}
(4.8)
For the L2 event, the standard Euclidean norm: 1
⎛ l ⎞2 q 2 = ⎜ ∑ qi2 ⎟ ⎝ i =1 ⎠
(4.9)
is considered and a ball in this norm is refered to as a sphere, e.g. q − q∗
2
≤ 1 . This
work deals with the case when the set Q is a box in shape. Actually, the uncertain system is described by (4.2) as G ( s, q ) . Combination of this transfer function with its uncertainty bounding set Q – eg. (4.8) – constitutes a family of systems. Naturally, the thought can be analogously applied to a family of
polynomials, etc. It is demonstrable that the controllers designed as robust hardly assure the optimal control response from the viewpoint of selected criterion for the whole family of systems. It is rather concerned with guarantee of such properties of the control circuit as stability, asymptotic tracking or at most with the preservation of values of some criterion in given margins. The most important problem consists in ensuring of stability and hence the control engineers are very often interested in a robust stability. It is familiarly known, that the polynomial p ( s ) is stable if all its roots lie in the left half of the complex plane or, in other words, if all its roots have negative real part. The family
- 42 -
of polynomials P = { p (⋅, q) : q ∈ Q} is robustly stable, if p (⋅, q ) is stable for all q ∈ Q , i.e. all roots of p ( s, q ) must be located in the left complex half plane for all q ∈ Q . The uncertainty enters into the polynomial (4.6) through the coefficient functions
ρi (q) . Nevertheless, the way how the uncertain parameters enter into the coefficients of this polynomial is very significant. In accordance with this, several basic structures of uncertainty with increasing generality are distinguished: •
independent (interval) uncertainty structure
•
affine linear uncertainty structure
•
multilinear uncertainty structure
•
nonlinear uncertainty structure (polynomial, general)
Moreover, the single parameter uncertainty is considered as a special case.
4.2. Single parameter uncertainty The robust stability analysis of systems with single parameter uncertainty is a specific case which is, however, definitely worth to deal with. Apart from its clearness, the main reason is that a wide range of more complex robust stability questions can be reduced to the task of single parameter uncertainty – e.g. the edge theorem [15] enables to convert the more-parameter problem to the finite numbers of one-parameter problems. The common description of the polynomial with one uncertain parameter is: p ( s, q) = p0 ( s ) + qp1 ( s )
(4.10)
where p0 ( s ) = p ( s,0) is a stable polynomial (its stability determines so-called nominal stability), p1 ( s ) is an arbitrary polynomial and q is a real uncertain parameter which can vary within the interval q ∈ q − ; q + .
Example 4.1: The family of first order controlled systems:
- 43 -
G ( s, q ) =
2 ; s−q
q ≤3
(4.11)
is connected with the unit proportional compensator: C (s) = 1
(4.12)
in the feedback control system. The family of uncertain characteristic closed-loop polynomials is then given by: p ( s, q ) = s + 2 − q
(4.13)
For the nominal system from the set (4.11) with the transfer function: G ( s,0) =
1 s
(4.14)
is polynomial (4.13) and consequently the whole closed-loop system stable – i.e. it is nominal stable. However, it is not robustly stable, because the root of (4.13) does not lie in the left half of the complex plane for q ≥ 2 .
Example 4.2: Consider the uncertain polynomial borrowed from [14]: p ( s, q ) = s 2 + ( 2 − q ) s + ( 3 − q )
(4.15)
The task is to find an interval of parameter q (uncertainty bounding set) which guarantees the stability. Consideration of the necessary condition of stability, which is grounded in the positivity of all polynomial coefficients, leads to the outcome q ∈ ( −∞;2 ) . Because the polynomial (4.15) is of second order, the condition modifies to necessary and sufficient one. For illustration, the roots of the polynomial (4.15) can be computed and plotted to the complex plane for various q – see fig. 4.2 where roots are depicted for q ∈ 0;4 . Furthermore, the robust stability can be analyzed also with the assistance of classical root locus (and on the top of that sometimes with the help of Nyquist methods [14]). The key idea involves creation of a fictitious plant in feedback control loop with gain q. Polynomial (4.15) can be simply rewritten to the form (4.10) as:
- 44 -
p ( s, q ) = ( s 2 + 2s + 3) − q ( s + 1)
(4.16)
Fictitious plant is given by transfer function: G(s) = −
s +1 s + 2s + 3
(4.17)
2
and whole closed-loop system is shown in fig. 4.2.
− ( s + 1)
q
s + 2s + 3 2
-
Fig. 4.2 – The feedback system for example 4.2
It is evident from root locations demonstrated in fig. 4.3 that crossing of stability boundary really arises at q = 2 .
1.5
Imaginary Axis
1
q=0
q=2
0.5
q=4
0
q=4
-0.5 -1 -1.5 -1
q=2
q=0 -0.5
0
0.5 1 Real Axis
1.5
2
2.5
Fig. 4.3 – Root locations for example 4.2
Nevertheless, it can also happen that the branches of the root locus “leapfrog” from the strict left half plane into the strict right half plane without crossing the imaginary
- 45 -
axis. Videlicet, stability loss can also occur at infinity by degree dropping, as shown in the following example. Example 4.3: Assume the family of polynomials: p ( s, q) = qs 2 − s − 2; q ∈ 0;1
(4.18)
For boundary values of q it holds true:
p( s,0) = − s − 2 ⇒ a stable root s1 = −2
(4.19)
p ( s,1) = s 2 − s − 2 ⇒ one unstable root s1 = 2, s2 = −1
(4.20)
but concurrently there is no root on stability border: p( jω , q) = − qω 2 − jω − 2 ≠ 0, ∀ω ∈ R , q ∈ 0;1
(4.21)
Unfortunately, many analysis methods work on the principle of watching over the boundary of stability, which means that they start from some stable member and during consecutive changes in uncertain parameter watch the stability boundary crossing. On that account, almost all described tools for testing of robust stability suppose investigated polynomials with invariant degree for all q ∈ Q .
4.2.1. Maximal stability interval and Bialas eigenvalue criterion Suppose the polynomial affected by single parameter uncertainty: p ( s, q) = p0 ( s ) + qp1 ( s )
(4.22)
with a stable polynomial p0 ( s ) and deg p0 ( s) > deg p1 ( s ) . The object is to find the − + ; qmax maximal stability interval Qmax = qmin
for the polynomial (4.22), i.e. the largest
interval for which p ( s, q ) is stable for all q ∈ Qmax . The solution of this problem is provided by Bialas eigenvalue criterion [20]. The main idea is based on the watchkeeping of singularity of the Hurwitz matrix:
- 46 -
H ( p ) = H ( p0 ( s ) + qp1 ( s )) = H ( p0 ( s )) + qH ( p1 ( s )) = = H ( p0 ) + qH ( p1 )
(4.23)
Remind that the matrix H ( p ) for a fixed polynomial: p ( s ) = pn s n + pn −1s n −1 +
+ p1s + p0
(4.24)
with pn > 0 is the n × n array (constructed the same way as in well-known Hurwitz stability criterion):
⎡ pn −1 ⎢p ⎢ n ⎢0 H ( p) = ⎢ ⎢0 ⎢ ⎢ ⎣⎢0
pn −3 pn − 2 pn −1 pn
pn −5 pn − 4 pn −3 pn − 2
0
⎤ ⎥ ⎥ ⎥ ⎥ ⎥ ⎥ ⎥ p0 ⎦⎥
0 0 0 0 p2
(4.25)
Bialas eigenvalue criterion says that maximal interval for stability of (4.22) is determined by: + qmax =
− min
q
λ
+ max
1 ( − H ( p0 ) H ( p1 ) ) −1
1 = − −1 λmin ( − H ( p0 ) H ( p1 ) )
(4.26)
+ − where λmax is the maximal positive real eigenvalue and λmin is minimal negative real
eigenvalue. If some of these real eigenvalues do not exist, then relevant limits are + − qmax = +∞ and/or qmin = −∞ .
The proof of the criterion grounded in Orlando’s formula and more detailed analysis of related problems can be found e.g. in [14], [20], [66]. Example 4.4: Find the maximal stability interval for the uncertain polynomial: p ( s, q) = s 4 + ( 6 + q ) s 3 + 12s 2 + (10 + q ) s + 3 =
= s 4 + 6s 3 + 12 s 2 + 10s + 3 + q ( s 3 + s )
which has been defined in [35], [66].
- 47 -
(4.27)
The matrixes H ( p0 ) and H ( p1 ) from (4.23) equal to: ⎡6 ⎢1 H ( p0 ) = ⎢ ⎢0 ⎢ ⎢⎣0
10 12 6 1
0 3 10 12
0⎤ ⎡1 ⎥ ⎢0 0⎥ ; H ( p1 ) = ⎢ ⎢0 0⎥ ⎥ ⎢ 3⎥⎦ ⎢⎣0
1 0 1 0
0 0 1 0
0⎤ 0 ⎥⎥ 0⎥ ⎥ 0 ⎥⎦
(4.28)
Eigenvalues of the matrix − H −1 ( p0 ) H ( p1 ) are {0; 0; -0.0879; -0.1777}. Application − = −5.6277 and because there is no positive real of (4.26) leads to conclusion that qmin + = +∞ . eigenvalue, it follows the upper bound qmax
For practical investigation of the maximal stability interval, the command “stabint” from the Polynomial Toolbox can be used.
4.2.2. Convex combinations, directions and extreme point results The derivations of many analytical methods suppose the polynomial with single uncertain parameter (4.22) expressed in the expedient form of convex combination. Appending of Q = q − , q +
to the polynomial (4.22), the family of polynomials with
two extreme points p( s, q − ) and p( s, q + ) is obtained. Moreover, putting the given q ∈ Q into this polynomial, the respective member of family can be viewed as a point of a line segment joining p ( s, q − ) and p ( s, q + ) in the space of polynomials. Consequently, polynomial (4.22) can be formularized as a convex combination (unit simplex) of p ( s, q − ) and p ( s, q + ) by introduction of:
λ=
q+ − q ∈ 0;1 q+ − q−
(4.29)
in the notation: p ( s, q) = λ p ( s, q − ) + (1 − λ ) p( s, q + ) On the contrary, for every λ ∈ 0;1 , there corresponds some q ∈ q − ; q +
(4.30) such that
p( s, λ ) = p ( s, q) . Ergo, it is only a matter of appropriateness and applicability if the
- 48 -
object of the interest is the original family of polynomials P or the equivalent family P = { p(⋅, λ ) : λ ∈ 0;1 } defined by: p ( s, λ ) = λ p0 ( s ) + (1 − λ ) p1 ( s )
(4.31)
where p0 ( s ) a p1 ( s ) are fixed polynomials. Thus, it follows P = P . Of course, the fixed polynomials associated with P and P are not identical. Furthermore, the same family of polynomials can be written also with the assistance of: f ( s ) = p0 ( s ) + q − p1 ( s )
g ( s ) = ( q + − q − ) p1 ( s )
µ=
(4.32)
q − q− q+ − q−
as a direction: p ( s, µ ) = f ( s ) + µ g ( s ); µ ∈ 0;1
(4.33)
The natural question which emerges is if the stability of extreme points p ( s, q − ) and p ( s, q + ) implies the stability of whole line segment. Unfortunately, the answer is no. The stability of extreme points does not suffice, as it demonstrates the following example. Example 4.5: Assume the family of polynomials from [18]: p ( s, q) = 10s 3 + (1 + q ) s 2 + ( 6 + 2q ) s + 0.57 + q = = 10s 3 + s 2 + 6s + 0.57 + q ( s 2 + 2s + 1) ;
q ∈ 0;1
(4.34)
Either extreme points: p ( s,0) = 10s 3 + s 2 + 6s + 0.57 p ( s,1) = 10s 3 + 2s 2 + 8s + 1.57
(4.35)
are stable, but the intermediate polynomial: p ( s;0.5) = 10s 3 + 1.5s 2 + 7 s + 1.07
- 49 -
(4.36)
is unstable. This fact can be also illustrated by fig. 4.4 where two conjugate complex roots of (4.34) for q ∈ 0;1 with step 0.01 are plotted (the third root is always in the strict left complex half plane). As can be clearly seen, depicted roots really twice cross the imaginary axis. 1.5
Imaginary Axis
1 0.5 0 -0.5 -1 -1.5 -3
-2
-1
0 Real Axis
1
2
3 -3
x 10
Fig. 4.4 – Conjugate complex roots of (4.34)
The stability of entire line segment follows from the stability of its extreme points if their difference polynomial is so called convex direction (Rantzer’s growth condition [63]) – this condition is not necessary, but “only” sufficient (and very strong). Further, for robust stability solution the segment or vertex lemma [17] can be applied. The overview of problems related to the discrete systems, other, more general stability regions than left half plane or MIMO systems is purveyed in e.g. [1], [14], [17], [66].
4.3. Interval uncertainty The basic, the simplest and the highly specialized case of an uncertainty structure is the interval uncertainty. However, many techniques for more general uncertainty structures draw on the theoretical results from this chapter and, besides, more complex
- 50 -
structure can be sometimes advantageously overbound by an independent one. The essential condition for existence of systems with interval uncertainty is the independence of its uncertainty structure. An uncertain polynomial: n
p ( s, q ) = ∑ ρi ( q ) s i
(4.37)
i =0
is said to have an independent uncertainty structure if each component qi of q enters into only one coefficient. A family of polynomials: P = { p (⋅, q) : q ∈ Q}
(4.38)
is called an interval polynomial family (or an interval polynomial for short) if it has an independent uncertainty structure, each coefficient depends continuously on q and Q is a box. The examples are: p1 ( s, q ) = ( 3 + q3 ) s 3 + ( 9 + q2 ) s 2 + ( 5 + q1 ) s + ( 2 + q0 ) ; qi ∈ −1;1 p2 ( s, q ) = 2s 3 + ( 4 + q3 + 2q2 ) s 2 + ( 3 + q1 ) s + 6;
(4.39)
q1 ∈ 0.5;2 , q2 ∈ −1;3 , q3 ∈ 1;2 Such a representation of the interval uncertainty relatively often involves a redundancy (see the coefficient at s 2 in the second polynomial). Therefore, simplified notation in which each uncertain coefficient is expressed only as an interval is used instead. The new family is sometimes called a lumped version of the original one. Example 4.6: Consider the family of polynomials:
p ( s, q) = s 3 + ( 4 + 2q2 + q3 ) s 2 + ( 8 + 3q1 + 2q4 ) s + ( 5 + q0 ) qi ≤ 1
(4.40)
The incorporated uncertainty can be easily “lumped” by defining of new uncertain parameters:
- 51 -
q2 = 4 + 2q2 + q3 q1 = 8 + 3q1 + 2q4
(4.41)
q0 = 5 + q0 with respective new uncertainty bounding set: q2 ∈ 1; 7 ; q1 ∈ 3;13 ; q0 ∈ 4; 6
(4.42)
and the new uncertain polynomial: p( s, q ) = s 3 + q2 s 2 + q1s + q0
(4.43)
Naturally, the resulting polynomial is shortly written as: p( s, q) = s 3 + [1; 7 ] s 2 + [3;13] s + [ 4; 6]
(4.44)
Generally speaking, the ordinarily used shorthand notation of an interval polynomial looks like: n
p ( s, q) = ∑ ⎡⎣ qi− ; qi+ ⎤⎦ s i
(4.45)
i =0
4.3.1. The Kharitonov theorem The veritable milestone in robust stability analysis of systems under parametric uncertainty has become the Kharitonov theorem [37] (or in some literature Kharitonov’s theorem, etc.). Even though it was published in a Russian differential equations journal as early as in 1978, it has been “discovered” for the control community by Barmish [13], [14] and also Bialas [19] entire four years later. This fundamental theorem says that an interval polynomial family with invariant degree is stable if and only if its four Kharitonov polynomials are stable. Thus, it is not necessary to check the stability of all possible extreme variations (which is 2l if q ∈ R l ), but always only of four polynomials without regard to the number of uncertain parameters. It is obvious that this reduction is of immense significance. The construction of Kharitonov polynomials is very simple and based on special fixed sequence of upper and lower bounds of coefficients in interval polynomial (4.45) according to the scheme:
- 52 -
K1 ( s ) = q0− + q1− s + q2+ s 2 + q3+ s 3 + q4− s 4 + q5− s 5 + q6+ s 6 + K 2 ( s ) = q0+ + q1+ s + q2− s 2 + q3− s 3 + q4+ s 4 + q5+ s 5 + q6− s 6 + K 3 ( s ) = q0+ + q1− s + q2− s 2 + q3+ s 3 + q4+ s 4 + q5− s 5 + q6− s 6 +
(4.46)
K 4 ( s ) = q0− + q1+ s + q2+ s 2 + q3− s 3 + q4− s 4 + q5+ s 5 + q6+ s 6 + To make the theorem easy-to-remember, a simple rule called „Kharitonov melody“ [1] can be utilized – …two high, two low, two high,… (the polynomials are arranged in different order here): +−−++−−+ ++−−++−−
(4.47)
−++−−++− −−++−−++ Example 4.7: Decide on the stability of the interval polynomial: p ( s, q ) = [ 0.5;1.5] s 3 + [3; 4] s 2 + [1; 2] s + [ 0.5;1]
(4.48)
All four Kharitonov polynomials: K1 ( s ) = 0.5 + 1s + 4s 2 + 1.5s 3 K 2 ( s ) = 1 + 2s + 3s 2 + 0.5s 3
(4.49)
K 3 ( s ) = 1 + 1s + 3s 2 + 1.5s 3 K 4 ( s ) = 0.5 + 2 s + 4s 2 + 0.5s 3 are stable and hence the original interval polynomial (4.48) is also stable.
The Kharitonov polynomials can be constructed in the Polynomial Toolbox via the command „kharit“. The original Kharitonov’s proof of his theorem is complicated and relatively hard to understand. Substantially simpler geometric proofs, grounded also in ideas from next subhead, can be found e.g. in [3], [23], [50]. Besides, an array of improvements of the Kharitonov theorem can be found in literature. Among the most frequent ones the following are counted: the simplification for low-degree polynomials (e.g. for the polynomial degree n = 3 and q0− > 0 to check
K 3 is enough) [4]; extensions with degree dropping [52]; an alternative technique of
- 53 -
robust stability investigation in a form of positivity condition of the frequency sweeping function [12]; or Kharitonov’s generalization of his theorem for an interval polynomials with complex coefficients [38].
4.3.2. The Kharitonov rectangle The Kharitonov rectangles are special kind of the value set, which will be generally defined later and which plays the essential role in solving robust stability problems. Suppose an interval polynomial (4.45) and substitute the complex variable s for jω with a fixed real frequency ω0 . The value set of interval polynomial is then a two-dimensional set of all possible complex values which arise in complex plane letting q range over the Q, i.e. letting all coefficients range over their intervals. Such a value set is always of a rectangular shape (rarely line segment as a special degraded case) and its sides are parallel to the axis. As mentioned above, this value set is called Kharitonov rectangle for the frequency ω0 . The proof of this fact is nowise complicated. Consider an interval polynomial family: n
p ( s, q) = ∑ qi s i , qi ∈ ⎡⎣ qi− ; qi+ ⎤⎦
(4.50)
i =0
where s = jω0 and divide it into the real and imaginary part: Re p ( jω0 , q) =
∑ q ( jω ) i
0
i
=
(4.51)
i even
= q0 − q2ω02 + q4ω04 − q6ω06 + q8ω08 −
Im p( jω0 , q ) =
1 i qi ( jω0 ) = ∑ j i odd
(4.52)
= q1ω0 − q3ω + q5ω − q7ω + q9ω − 3 0
5 0
7 0
9 0
Notice that each qi enters to the one and only coefficient which allows investigating of either equation separately and moreover minimizing or maximizing of each term individually. The real part is always between: min Re p ( jω0 , q) = q0− − q2+ω02 + q4−ω04 − q6+ω06 + q8−ω08 − q∈Q
= Re K1 ( jω0 )
- 54 -
=
(4.53)
and max Re p( jω0 , q) = q0+ − q2−ω02 + q4+ω04 − q6−ω06 + q8+ω08 − q∈Q
=
= Re K 2 ( jω0 )
(4.54)
Hitherto, the sign of ω0 does not matter, because all powers are even. However, as far as imaginary part is concerned, one must pay attention to it. For ω0 ≥ 0 it follows:
min Im p( jω0 , q) = q1−ω0 − q3+ω03 + q5−ω05 − q7+ω07 + q∈Q
= Im K 3 ( jω0 )
(4.55)
= Im K 4 ( jω0 )
(4.56)
and for ω0 < 0 : min Im p( jω0 , q) = q1+ω0 − q3−ω03 + q5+ω05 − q7−ω07 + q∈Q
In the maximization problem, the same type of reasoning can be used. Therefore, for imaginary part it results in: ⎧ Im K 3 ( jω0 ) pro ω0 ≥ 0 min Im p ( jω0 , q ) = ⎨ q∈Q ⎩ Im K 4 ( jω0 ) pro ω0 < 0
(4.57)
⎧Im K 4 ( jω0 ) pro ω0 ≥ 0 max Im p ( jω0 , q) = ⎨ q∈Q ⎩ Im K 3 ( jω0 ) pro ω0 < 0
(4.58)
Using obtained minimal and maximal values, four relevant points can be plotted into the complex plane for selected frozen frequency. As a result, the rectangular figure
p( jω0 , Q) is gained indeed. The key point to note is that each vertex corresponds to unique Kharitonov polynomial. Provided that ω0 ≥ 0 , it holds for vertexes: lower left vertex:
Re K1 ( jω0 ) + j Im K 3 ( jω0 ) = = Re K1 ( jω0 ) + j Im K1 ( jω0 ) = = K1 ( jω0 )
upper right vertex:
Re K 2 ( jω0 ) + j Im K 4 ( jω0 ) = = Re K 2 ( jω0 ) + j Im K 2 ( jω0 ) = = K 2 ( jω0 )
lower right vertex:
Re K 2 ( jω0 ) + j Im K 3 ( jω0 ) = = Re K 3 ( jω0 ) + j Im K 3 ( jω0 ) = = K 3 ( jω0 )
- 55 -
Re K1 ( jω0 ) + j Im K 4 ( jω0 ) =
upper left vertex:
= Re K 4 ( jω0 ) + j Im K 4 ( jω0 ) = = K 4 ( jω0 ) The said situation is illustrated by the Kharitonov rectangle of interval polynomial (4.48) for frequency ω0 = 0.2 with highlighted vertexes which is shown in fig. 4.5.
0.45
K (jω )
K (jω ) 4
0.4
2
0
0
Imag Axis
0.35 0.3
p(jω 0,Q)
0.25 0.2
K (jω )
0.15 0.1
1
0.2
K (jω )
0
3
0.4
0.6 Real Axis
0.8
0
1
Fig. 4.5 – Kharitonov rectangle of interval polynomial (4.48) for ω0 = 0.2
So far, the discussion of the Kharitonov rectangle has been in the context of a fixed frequency ω = ω0 . However, the notion of sweeping the frequency is needful to entertain. Increasing of ω results in motion of the Kharitonov rectangle, i.e. a rectangle moves around the complex plane – see fig. 4.6, where Kharitonov rectangles for interval polynomial (4.48) are depicted (with the assistance of the Polynomial Toolbox command „khplot“) for frequencies ω ∈ 0;1 in the range of 50 samples.
- 56 -
1.5
Imag Axis
1
0.5
0 -0.5 -3
-2
-1 Real Axis
0
1
Fig. 4.6 – Kharitonov rectangles of interval polynomial (4.48) for ω ∈ 0;1
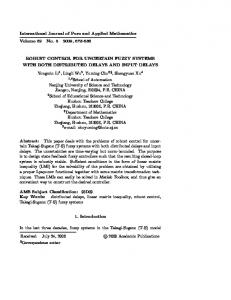
4.3.3. Graphical test of robust stability An interval polynomial family P = { p (⋅, q) : q ∈ Q} with invariant degree and at least one stable member p ( s, q 0 ) is robustly stable if and only if the Kharitonov rectangles are excluded from the origin of the complex plane at all nonnegative frequencies, that is 0 ∉ p( jω , Q ) ∀ω ≥ 0 . This rule, known as the zero exclusion condition, is very important, because in conjunction with the value set concept it represents powerful and sometimes practically the one and only conceivable method of robust stability analysis for much more complicated uncertainty structures. The usage of this test is essentially superfluous in the case of interval uncertainty, because the Kharitonov Theorem is simpler, nevertheless the main ideas can be easily graphically verified and demonstrated – see e.g. fig. 4.6, where the interval polynomial family (4.48) contains a stable member and the zero point is excluded from the Kharitonov rectangles and hence the family is robustly stable. If the rectangles encompass the origin, it is apparent that the family will harbour the polynomial with root on imaginary axis (the stability border) – remember also the stability testing of polynomials via the
- 57 -
Mikhailov(-Leonhard) criterion [49]. The example of robustly unstable interval polynomial can be: p ( s, q) = s 5 + [3; 5] s 4 + [5.5;10] s 3 + [ 6.5;10] s 2 + [3; 5] s + [ 0.5;1]
(4.59)
The Kharitonov rectangles, plotted again in the Polynomial Toolbox (for frequencies
ω ∈ 0; 3 with the step 0.015), for this once cross the zero as shown in fig. 4.7 and fig. 4.8, while the second graph is zoomed to see better what is happening in the neighbourhood of the point [0; 0j]. Therefore, the interval polynomial (4.59) is not robustly stable. In addition, it can be readily confirmed by the stability of only three of four Kharitonov polynomials – the unstable one is K 2 ( s ) : K1 ( s ) = 0.5 + 3s + 10s 2 + 10s 3 + 3s 4 + s 5 K 2 ( s ) = 1 + 5s + 6.5s 2 + 5.5s 3 + 5s 4 + s 5
(4.60)
K 3 ( s ) = 1 + 3s + 6.5s 2 + 10s 3 + 5s 4 + s 5 K 4 ( s ) = 0.5 + 5s + 10s 2 + 5.5s 3 + 3s 4 + s 5
100 80
Imag Axis
60 40 20 0 -20 -40 -60 0
50
100
150 200 Real Axis
250
300
350
Fig. 4.7 – Kharitonov rectangles of interval polynomial (4.59) for ω ∈ 0; 3
- 58 -
0.6
Imag Axis
0.4 0.2 0 -0.2 -0.5
0 Real Axis
0.5
1
Fig. 4.8 – Kharitonov rectangles of interval polynomial (4.59) – detailed view
Furthermore, suggested simple graphical procedure for checking robust stability can be improved by finding of some finite precomputable frequency (so called cutoff frequency) at which the frequency sweep can be terminated, i.e. the graphical test concluded. Suppose the interval polynomial (4.45) with qi− > 0 for i = 0, 1, …, n . According to [14], the cutoff frequency ωc can be taken as the largest real root of the polynomial: n −1
f (ω ) = qn−ω n − ∑ qi+ω i
(4.61)
i =1
Possibly, assuming qn− > 0 , the usually less conservatively estimation:
ωc = 1 +
max {q0+ , q1+ , …, qn+−1} qn−
follows from the results based on [45].
- 59 -
(4.62)
4.3.4. The value set concept and the zero exclusion condition The main idea and the application of the value set concept and the zero exclusion condition have been already adumbrated in the previous chapters. Now, these terms will be defined more generally, because the attention of next parts will be no longer restricted to interval polynomials. For rather complex uncertainty structures, the value set is seen to be a generalization of the Kharitonov rectangle. Assume a family of polynomials P = { p (⋅, q) : q ∈ Q} . The value set at frequency
ω ∈ R is given by: p( jω , Q) = { p( jω , q ) : q ∈ Q}
(4.63)
In other words, p( jω , Q) is the image of Q under p ( jω , ⋅) . For example, substitute s for jω in a family P = { p ( s, q) : q ∈ Q} , fix ω and let the vector of uncertain parameters q range over the set Q. For the case of family with single parameter uncertainty, the value set is a straight line segment. For example, the value sets of the polynomial family (4.34) are depicted in fig. 4.9 with frequency step 0.02. Incidentally, it confirms robust instability of (4.34), which has been tested by different method in example 4.5. However, in this passage, the figure serves more or less for illustration of the mentioned segmental shape.
2
Imag Axis
0 -2 -4 -6 -8
-1
-0.5
0
0.5 Real Axis
1
Fig. 4.9 – The value sets of (4.34)
- 60 -
1.5
The zero exclusion condition for Hurwitz stability of family of continuous-time polynomials P = { p (⋅, q) : q ∈ Q} says: Suppose invariant degree of polynomials in the family, pathwise connected uncertainty bounding set Q, continuous coefficient functions ρi ( q) for i = 0,1, 2, …, n and at least one stable member p ( s, q 0 ) . Then the family P is robustly stable if and only if the complex plane origin is excluded from the value set p( jω , Q) at all frequencies ω ≥ 0 , that is P is robustly stable if and only if: 0 ∉ p( jω , Q) ∀ω ≥ 0
(4.64)
Roughly speaking, the requirement of pathwise connectedness of the set Q means that any two points from Q can be connected by continuous curve, which entire lie within Q. It is obvious that all convex sets (such as a box or a sphere) are pathwise connected. The term of convexity is defined in subhead 4.4.1. The validity of the zero exclusion condition is very universal – it can be applied to wide range (also more complex) problems (complicated uncertainty structures, timedelay systems, more general regions of stability, etc.). The generalization for another stability region (problems of robust D-stability) can be found e.g. in [1], [14], [17], [66]. In that event, only the frequency ω , serving actually for parameterization of the imaginary axis, is used no more during plotting of the value sets. Instead of ω the function ∂D denoting the boundary of an open subset of the complex plane D is introduced and parameterized via a boundary sweeping function by so called generalized frequency.
4.3.5. The overbounding method However, it remains true that the interval uncertainty structure is considerably idealized and restrictive state because uncertain parameters typically enter into more than the only one coefficient (e.g. as it will be shown later, even an interval system in closed control loop leads, except for some specific cases, to the closed-loop characteristic polynomial with affine linear structure of uncertainty). In spite of that, the tools for robust stability analysis of interval systems can be utilized also for these more general events as an alternative to “their own” more general results. That is, complicated uncertainty structure can be “overbounded” by the interval one and this
- 61 -
new family is sequentially tested. Unfortunately, this method brings into the analysis certain degree of conservatism due to ignoring of mutual dependencies among coefficients in the original family. As a result, robust stability is investigated only with sufficient (i.e. stronger) and not necessary and sufficient condition. The preceding consideration is demonstrated on following two examples. Example 4.8: The family of polynomials (with multilinear uncertainty structure), which has appeared in [14], is described by: p ( s, q ) = s 4 + ( 5 + 0.2q1q2 + 0.1q1 − 0.1q2 ) s 3 + ( 6 + 3q1q2 − 4q2 ) s 2 + + ( 6 + 6q1 − 8q2 ) s + ( 0.5 − 3q1q2 )
(4.65)
and uncertainty bound qi ≤ 0.25 for i = 1, 2 . The objective is to determine whether (4.65) is robustly stable. New bounds can be computed as: −
q 0 = min a0 (q ) = q∈Q
+
q 0 = max a0 (q ) = q∈Q
−
q1 = min a1 (q) = q∈Q
+
q1 = max a1 (q ) = q∈Q
min
( 0.5 − 3q1q2 ) = 0.3125
max
( 0.5 − 3q1q2 ) = 0.6875
−0.25≤ qi ≤ 0.25
−0.25≤ qi ≤ 0.25
min
( 6 + 6q1 − 8q2 ) = 2.5
max
( 6 + 6q1 − 8q2 ) = 9.5
−0.25≤ qi ≤ 0.25
−0.25≤ qi ≤ 0.25
Analogical computations yield to the coefficients −
−
q 2 = 4.8125 ,
(4.66)
+
q 2 = 7.1875 ,
+
q 3 = 4.9475 , q 3 = 5.0375 . The overbounding interval family of polynomials is given
by: p ( s, q ) = s 4 + [ 4.9475, 5.0375] s 3 + [ 4.8125, 7.1275] s 2 + + [ 2.5, 9.5] s + [ 0.3125, 0.6875]
(4.67)
By applying the Kharitonov theorem or graphical test, it is straightforward to verify that the family (4.67) is robustly stable. Therefore, it can be concluded that the original family (4.65) must also be robustly stable. Thus, the overbounding method has been successful in this case. Several original value sets of the family (4.65) and its
- 62 -
overbounding Kharitonov rectangles for (4.67) are depicted in fig. 4.10 for elucidation of the idea (step of frequency is 0.07).
5 4 3 Imag Axis
2 1 0 -1 -2 -3 -3
-2
-1 Real Axis
0
Fig. 4.10 – Graphical representation of the overbounding method (successful case)
However, be careful. As it was adumbrated hereinbefore, if the new overbounding family was not robustly stable, it could not to be decided about the authentic family, i.e. although the Kharitonov rectangles would cover the origin of the complex plane, the value sets of the original family would not necessarily have to include it. This is illustrated in next example. Example 4.9: The polynomial family (with affine linear uncertainty structure), adopted from [66], is given by: p ( s, q ) = s 4 + ( 2q2 + 1) s 3 + ( 2q1 − q2 + 4 ) s 2 + + ( q2 + 1) s + ( q1 − 2q2 + 2 )
(4.68)
and uncertainty bounds q1 ∈ −0.5, 2 , q2 ∈ −0.3, 0.3 . The overbounding interval polynomial is then: p ( s, q) = s 4 + [ 0.4,1.6] s 3 + [ 2.7, 8.3] s 2 + [ 0.7,1.3] s + [ 0.9, 4.6]
- 63 -
(4.69)
As can be easily verified by the Kharitonov theorem, the overbounding family (4.69) is not robustly stable so it can not be said anything about robust stability of (4.68) and it has to be tested with the assistance of a more advanced method (several of them are described in next chapters), i.e. the overbounding method is unsuccessful here. Apropos, the family (4.68) is robustly stable in fact. For illustration, the value sets of both (4.68) and (4.69) are plotted in fig. 4.11 (step 0.1).
1 0.5
Imag Axis
0 -0.5 -1 -1.5 -2 -6
-4
-2
0 Real Axis
2
4
6
Fig. 4.11 – Graphical representation of the overbounding method (unsuccessful case)
4.4. Affine linear uncertainty Another, more general level in description of parametrically uncertain processes is represented by systems with affine linear uncertainty. An uncertain polynomial: n
p ( s, q ) = ∑ ρi ( q ) s i
(4.70)
i =0
has an affine linear uncertainty structure, if each coefficient ρi ( q) is an affine linear function of q, that is, there exists a column vector α i and a scalar β i such that it holds:
ρi ( q) = α iT q + βi
(4.71)
- 64 -
where α iT is transposed α i . Analogically, assuming an uncertain transfer function: G ( s, q ) =
b( s , q ) a ( s, q )
(4.72)
where both numerator and denominator have affine linear uncertainty structures, the whole function (4.72) is said to have the same structure. The frequent notation, equivalent to (4.70), is: l
p ( s, q ) = p0 ( s ) + ∑ qi pi ( s )
(4.73)
i =1
For robust stability investigation purposes, the relatively important property of the affine linear uncertainty structure is its preservation in the closed-loop connection, i.e. in the simple feedback system as shown in fig. 4.12.
w
-
G(s,q)
C(s)
y
Fig. 4.12 – Closed-loop connection preserving uncertainty structure A controller is supposed to be given by transfer function: C ( s) =
qC ( s ) pC ( s )
(4.74)
and a controlled plant: l
G ( s, q ) =
b( s , q ) = a ( s, q )
b0 ( s ) + ∑ qi bi ( s ) i =1 l
a0 ( s ) + ∑ qi ai ( s )
(4.75)
i =1
contains affine linear uncertainty structure (or the interval one as the special case). Under these preconditions, the transfer function of whole closed loop has also the affine linear structure of uncertainty:
- 65 -
GW Y ( s, q ) =
b( s, q)qC ( s ) G ( s, q)C ( s ) = = 1 + G ( s, q)C ( s ) a( s, q) pC ( s ) + b( s, q )qC ( s ) l
=
b0 ( s )qC ( s ) + ∑ qi bi ( s )qC ( s )
(4.76)
i =1 l
a0 ( s ) pC ( s ) + b0 ( s )qC ( s ) + ∑ qi [ ai ( s ) pC ( s ) + bi ( s )qC ( s ) ] i =1
Finally, the same structure has, quite naturally, the closed-loop characteristic polynomial, that is the denominator of the fraction (4.76).
4.4.1. Convex set and convex hull Prior to the robustness analysis itself, short review of some basics from the theory of convex analysis will be given in the next two subheads. The set C ⊆ R k is said to be a convex, if the line joining any two points c1 and c2 in C remains entirely within C. To put it differently, it must hold true:
λ c1 + (1 − λ ) c2 ∈ C ∀c1 , c2 ∈ C λ ∈ 0;1
(4.77)
The expression λ c1 + (1 − λ ) c2 is then called a convex combination of c1 a c2. The main thought is illustrated in simple fig. 4.13.
c1
c2 Convex set
Nonconvex set
Fig. 4.13 – Examples of convex and nonconvex sets The convex hull of a set C ⊂ R k (both convex and nonconvex) can be defined as the “smallest” convex set containing C. More precisely, if the convex set which contains C is termed as C + and the array of all C + as C + , then the convex hull is given by:
- 66 -
conv C =
∩C
+
(4.78)
C + ∈C +
Apparently, the convex hull includes the assumed set and if the set is convex, its convex hull is identical to this set itself. The example of the convex hull is shown in fig. 4.14.
The boundary of original nonconvex set
The boundary of convex hull
Fig. 4.14 – A nonconvex set and its convex hull
4.4.2. Polytopes, extreme points and edges A polytope P in R k is the convex hull of a finite set of points { p1 , p 2 ,… p m } ∈ R k . Thus, it is described as:
P = conv { p i } The group of points
(4.79)
{ p , p ,… p } 1
2
m
is said to be the set of generators of the polytope
P. For illustration, the polytopes in R 2 are the convex polygons, but not nonconvex polygons (e.g. stars). Note that the set of generators is nonunique, for example the points p 3 , p 5 and p 7 in fig. 4.15 are optional for subsumption in a generating set of depicted polytope.
- 67 -
p1
p3
p8 p7
p2
p5 p6
p4
Fig. 4.15 – An example of a polytope in R 2 The unambiguous set of generators is given by the set of extreme points (vertices) of a polytope. Suppose P = conv { p i } is a polytope in R k . Then a point p ∈ P is called an extreme point of P if it can not be expressed as a convex combination of any two different points in P – the polytope from fig. 4.15 has extremes
{ p , p , p , p , p } . Actually, the set of extreme points is a minimal generation set. 1
2
4
6
8
Every point p ∈ P in a polytope P = conv { p1 , p 2 ,… p m } can be written as a convex combination of the p i , i.e. there exist real scalar numbers λ1 , λ2 ,… λm ≥ 0 such that it holds good: m
p = ∑ λi p i
(4.80)
i =1
and m
∑λ i =1
i
=1
(4.81)
The sum (4.81) represents so called unit simplex.
- 68 -
Example 4.10: Consider the polygon in fig. 4.15, which can be, according to [14], divided into three triangles. One of them is described by P1 = conv { p1 , p 6 , p8 } . Any point p ∈ P1 can be expressed as a convex combination λ1 p1 + λ6 p 6 + λ8 p 8 . For example, the point p 7 might be obtained with λ1 ≅ λ6 ≅ λ8 ≅ 1 3 ; the point p 3 for λ1 ≠ 0, λ8 ≠ 0, λ6 = 0 and extreme point p 6 if λ6 = 1, λ1 = λ8 = 0 . To conclude, the description of points p ∈ P via convex combinations of extreme points is nonunique – e.g. the point p 7 can be expressed not only with the assistance of p1 , p 6 , p8 , but also possibly p 2 , p 6 , p 8 .
The special and important shape, straight line segment ⎡⎣ x a , x b ⎤⎦ with boundary points x a , x b ∈ R k can be written as: x ∈ ⎡⎣ x a , x b ⎤⎦ : x = λ x a + (1 − λ ) x b
(4.82)
where λ ∈ 0;1 . The edge of polytope is, roughly speaking, a line segment which does not intersect another line segment of polytope with boundary points out of the line itself. Ergo, mathematically formulated, the line segment: ⎡⎣ p i1 , p i2 ⎤⎦ ⊆ P
(4.83)
is an edge of P if for whatever: ⎡⎣ p a , p b ⎤⎦ ∈ P;
p a , p b ∉ ⎡⎣ p i1 , p i2 ⎤⎦
(4.84)
it holds true: i1 i2 a b ⎣⎡ p , p ⎦⎤ ∩ ⎣⎡ p , p ⎦⎤ = ∅
(4.85)
For example, the polytope from fig. 4.15 has, needles to say, edges ⎡⎣ p1 , p 2 ⎤⎦ , ⎡⎣ p 2 , p 4 ⎤⎦ , ⎡⎣ p 4 , p 6 ⎤⎦ , ⎡⎣ p 6 , p8 ⎤⎦ and ⎡⎣ p8 , p1 ⎤⎦ . Moreover, basic operations such as summation, multiplication by scalar, intersection, unification or linear transformation can be defined for polytopes.
- 69 -
Additional information can be found e.g. in [14], [17] and nice illustrative examples in [66].
4.4.3. Polytopes of polynomials and its value set Now, the theory of polytopes will be utilized in the polynomial context. A family of polynomials P = { p (⋅, q) : q ∈ Q} is said to be a polytope of polynomials, if p ( s, q ) has an affine linear uncertainty structure and Q is a polytope. If Q = conv {q i } , then p ( s, q i ) is called the i-th generator for P.
Example 4.11: Suppose a polytope of polynomials p ( s, q) = s 2 + ( 6q1 + 2q2 + 3) s + ( 3q1 − q2 + 5 ) , where
q1 ≤ 1 ,
q2 ≤ 1 . The uncertainty bounding set Q has four extremes –
q1 = ( −1, −1) , q 2 = ( −1,1) , q 3 = (1, −1) , q 4 = (1,1) . The four associated generators are determined by p ( s, q1 ) = s 2 − 5s + 3 , p ( s, q 2 ) = s 2 − s + 1 , p ( s, q 3 ) = s 2 + 7 s + 9 and p( s, q 4 ) = s 2 + 11s + 7 .
There is absolute analogy among the polytope of polynomials, the polytope of polynomial coefficients and the polytope of uncertain parameters, that is these polytopes are isomorphic, i.e. equipollent. As mentioned above, advantageous graphical test of the robust stability can be performed via the visualization of the value set. Since an interval polynomial is a special case of a polytope of polynomials, the relevant value set is a generalization of a Kharitonov rectangle (see e.g. fig. 4.5). Let P = { p (⋅, q) : q ∈ Q} be a polytope of polynomials with uncertainty bounding set Q = conv {q i } . Then, for fixed z ∈ C , the value set p ( z , Q) is a polygon with generating set { p( z , q i )} , id est: p ( z , Q) = conv { p ( z , q i )}
(4.86)
- 70 -
Moreover, all edges of the polygon p ( z , Q) are obtained from the edges of Q in the following meaning: If z0 is a point on an edge of p ( z , Q) , then z0 = p( z , q 0 ) for some q 0 on an edge of Q. Nevertheless it does not hold true to the contrary. If q0 is on an edge of Q, then z0 = p( z , q 0 ) does not need to be on an edge of p ( z , Q) , because the edge can be mapped to the interior of p ( z , Q ) – see. fig. 4.16.
q2
This edge maps to the inside
Im qi3
qi1
p ( z , ⋅)
p ( z , q i1 )
p ( z , Q) p ( z , q i3 )
Q
q1
p ( z , q i2 )
q3
Re
q i2 This edge maps to an edge
Fig. 4.16 – Mapping an edge of Q into the interior of p ( z , Q)
Example 4.12: Assume the uncertain polynomial from [14]: p ( s, q) = ( 2q1 − q2 + q3 + 1) s 3 + ( 3q1 − 3q2 + q3 + 3) s 2 + + ( 3q1 + q2 + q3 + 3) s + ( q1 − q2 + 2q3 + 3)
(4.87)
and uncertainty bounding set Q described by qi ≤ 0.245 for i = 1, 2,3 . Three uncertain parameters indicate that the value set p ( z , Q) is a polygon with 23 = 8 generators. For its calculation, routine „ptopex“ from the Polynomial Toolbox can be used. For example, corresponding to the particular generator q 5 = ( 0.245; −0.245;0.245 ) the polynomial p ( s, q 5 ) = 1.98s 3 + 4.715s 2 + 3.735s + 3.98 is obtained. In spite of 8
- 71 -
generators, the value set p ( z , Q) has only 6 extremes (it is a hexagon) thanks to the fact that 2 extremes are mapped to the inside (the cube has 8 vertices, but its projection to the plane has always 6 vertices at most). The hexagonal shape of the value set is confirmed by fig. 4.17, where p ( jω , Q) are depicted for frequencies ω ∈ 0;1.5 in the range of 30 samples. Visual representation has been created again in the Polynomial Toolbox (command „ptopplot“).
4
Imag Axis
3 2 1 0 -1 -2 -6
-4
-2 0 Real Axis
2
4
Fig. 4.17 – Polygonal value sets for the polynomial (4.87)
The family of polynomials contains a stable member. According to [14], [45] it can be verified that ωc = 1.5 tallies with the cutoff frequency and thus the graphical test can be concluded here. As a result of 0 ∉ p ( jω , Q ) for ω > ωc , it follows from the zero exclusion condition robust stability of considered family. If a family is given by a polynomial with affine linear uncertainty structure and the uncertainty bounding set is a box, than it can be considered as a special type of polytope of polynomials – so called parallelotop of polynomials (the opposite edges of polygonal value set are always parallel). Nevertheless, this term is not used commonly.
- 72 -
If P = { p (⋅, q) : q ∈ Q} is a parallelotop with l parameters, i.e. polytope of polynomials with Q as a box in R l , then for an arbitrary complex z is a value set p ( z , Q) in the shape of parallel polygon (parapolygon) with no more than 2l edges. As will be shown in the subsequent parts, the closed control loop with interval plant and fixed feedback controlled has the characteristic polynomial in the form of special polytope, which value set is always (at most) octagonal without regard to number of uncertain parameters in the interval plant.
4.4.4. The edge theorem The investigation of robust stability for systems with affine linear uncertainty structure can be performed also with the assistance of other, analytical tools. The one of them is the edge theorem [15]. Preceding chapters suggest that the interior of the value sets is practically unimportant from the robust stability point of view, because before the origin of the complex plane gets into the inside of the value set it must appear on an edge. Consequently, it is advantageous to limit the investigation only to the edges. As it was mentioned above, the edges of p ( z , Q) are associated with the edges of Q (but not in reverse) and therefore the robust stability of the family results from the stability on the edges (and also vice versa). The strength of this approach is that the edge has the one and only parameter and it can be expressed as a line segment (in the space of polynomials): pi1 ,i2 ( s, λ ) = λ pi1 ( s ) + (1 − λ ) pi2 ( s )
(4.88)
where pi1 ( s ) = p( s, q i1 ) , pi2 ( s ) = p( s, q i2 ) are extremes of polytope of polynomials and thus they are images of vertices q i1 and q i2 , which represents extreme points of an edge of Q. The investigation of robust stability for families with single uncertain parameter is relatively easy task, but pay attention to the example 4.5, where it has been demonstrated that the stability of both extremes does not automatically imply the stability of entire line segment. The edge theorem [15] says: Assume that D is an open subset of the complex plane C with boundary sweeping function Φ D : I → C , where I ⊆ R is a real interval and let
- 73 -
P = { p (⋅, q) : q ∈ Q} be a polytope of polynomials with invariant degree. Then P is robustly D-stable if and only if for each pair of extreme points q i1 and q i2 corresponding to an edge of the set Q, the polynomial (4.88) is D-stable for all
λ ∈ 0;1 . In related literature there can be found many modifications and embellishments of the classical edge theorem. For example, the stronger version of this principle suppose checking of only those edges q i1 ,i2 (λ ) ⊂ Q which correspond to the edges of polytope of coefficients ρ ( q i1 ,i2 (λ ) ) , i.e. to the edges of polytope of polynomials. Although the number of edges which have to be analysed is smaller, it is not trivial to determine them at all and for that reason the stronger version is practically not frequently used. Another variant of the edge theorem is based on the spectral set (root set) of P. Furthermore, subsequent information about refinements of the edge theorem for more general classes of D regions are provided e.g. in [28] and for time delay systems e.g. in [29]. The robust stability investigation through the edge theorem can be accomplished in the Polynomial Toolbox via the function „edgetest“.
4.4.5. The thirty-two edge theorem In spite of enormous computational capacity of current computer equipment, the edge theorem has a weighty demerit from the application viewpoint. The drawback lies in combinatoric explosion in the number of edges of Q which emerges during increasing quantity of uncertain parameters. If Q is given as an l-dimensional box, it follows for the number of its edges:
N edge = l 2l −1
(4.89)
which means that e.g. 10 uncertain parameters generate 5120 edges to investigate. Hence, it is a question if some smaller amount of significant edges sufficient for robust stability testing could not be selected. The polytope of polynomials defined at the end of the subhead 4.4.3, has Q with (4.89) edges, but the value set p ( z , Q) only with 2l edges at most. Unfortunately, the edges of p ( z , Q) vary by changes in z and so
- 74 -
generally it is not possible to determine which edges of Q belong to these significant ones. In a sense of automatic control theory the very frequent case of system with affine linear uncertainty structure is the control loop from fig. 4.18, where controlled plant is an interval system: m
b( s, q ) G ( s, q, r ) = = a ( s, r )
∑ ⎡⎣ q i =0 n
− i
, qi+ ⎤⎦ s i
−
, ri ⎤⎦ s
∑ ⎡⎣r i =0
i
+
(4.90)
i
and controller is given by transfer function: C ( s) =
qC ( s ) pC ( s )
w
(4.91)
C(s)
G(s,q,r)
y
Fig. 4.18 – Closed control loop with an interval plant Resulting closed-loop characteristic polynomial:
pCL ( s, q, r ) = a( s, r ) pC ( s) + b( s, q)qC ( s ); q ∈ Q, r ∈ R
(4.92)
is a polytope of special kind with m + n parameters: PCL = { pCL (⋅, q, r ) : q ∈ Q, r ∈ R}
(4.93)
Since the set of its uncertain parameters is ( m + n ) -dimensional box with the number of edges:
N edge = ( n + m + 2 ) × 2n + m +1
(4.94)
it could appear that computing demandingness will dramatically increase again owing to increase of m and n. Nevertheless, that is not that case, because in this instance the value set pCL ( jω , Q, R ) has for one fixed ω ∈ R no more than eight edges and for
- 75 -
varying ω four possible groups of eight edges, i.e. in total 32 edges can arise. This leads to 32 distinguished edges which are instrumental to robust stability analysis. This idea is formulated in the thirty-two edge theorem [22]: Consider a closed-loop connection as indicated in fig. 4.18, where controlled interval plant is described by transfer function (4.90) having Kharitonov polynomials B1 ( s ) , B2 ( s ) , B3 ( s ) , B4 ( s ) and A1 ( s ) , A2 ( s) , A3 ( s ) , A4 ( s ) for the numerator and denominator, respectively, and controller is given by relation (4.91). Supposing the resulting family of closed-loop characteristic polynomials (4.92) has invariant degree, its robust stability is guaranteed if and only if all edge polynomials of the form: e( s, λ ) = Bi1 ( s )qC ( s ) + Ai2 ,i3 ( s, λ ) pC ( s )
(4.95)
with i1 ∈ {1, 2,3, 4} and ( i2 , i3 ) ∈ {(1,3) , (1, 4 ) , ( 2,3) , ( 2, 4 )} and: e( s, λ ) = Bi1 ,i2 ( s, λ ) qC ( s ) + Ai3 ( s ) pC ( s )
(4.96)
with ( i1 , i2 ) ∈ {(1,3) , (1, 4 ) , ( 2,3) , ( 2, 4 )} and i3 ∈ {1, 2,3, 4} are stable for all λ ∈ 0;1 . Remind that Ai2 ,i3 ( s, λ ) and Bi1 ,i2 ( s, λ ) are line segments (sometimes also called Kharitonov segments), which can be in the form, e.g.:
Bi1 ,i2 ( s, λ ) = λ Bi1 ( s) + (1 − λ ) Bi2 ( s)
(4.97)
This theorem features in literature burden with certain nonuniformity in term and related nomenclature. The theorem has been published in [22], where it is called the box theorem. The commonly used name is the generalized Kharitonov theorem, which is employed in [17] and later on e.g. in [71], [74]. The term the thirty-two edge theorem has appeared in [14] and thereof subsequently in [35], [66], etc. – furthermore, these works are more detailed in analysis and proofs of the fact, that the value set is always no more than octagonal.
4.4.6. The sixteen plant theorem As can be anticipated from previous parts, the various known restrictions allow to reduce the complexity of problems connected with robust stability of systems with
- 76 -
affine linear uncertainty structure. Another step in this simplification is represented by typical and frequent case of closed-loop connection containing an interval plant: m
b( s, q ) G ( s , q, r ) = = a ( s, r )
∑ ⎡⎣ q
− i
i =0
, qi+ ⎤⎦ s i
n −1
s + ∑ ⎡⎣ ri − , ri + ⎤⎦ s i n
; m 0 is a free parameter and n = max {deg a ( s ),deg b( s )} . Generally, it is not necessary to use the polynomial with multiple real root, but arbitrary stable polynomial with adequate order. However, the choice of multiple root m > 0 brings into the synthesis the single real scalar tuning parameter which will be subsequently used as a tool influencing the properties of closed-loop control responses.
- 86 -
5.1.3. Divisibility in RPS The divisibility in RPS is defined somewhat abstractly: only if all zeros of
x( s ) x( s ) divides if and y ( s) y ( s)
x( s ) (roots of x( s ) ) located in right complex half plane (including y ( s)
imaginary axis and infinity) are also zeros of
x( s ) (roots of x( s ) ). For instance: y ( s)
s ( s − 1) s divides 2 s +1 ( s + 2)
1
( s + 2)
divides
2
does not divide
1
s 1 does not divide s +1 s+3
( s + 2)
s
2
( s + 3)
3
1 s+2
The common factor of two members of the ring a, b is the member d, which divides both of these members a, b. The greatest common factor GCF ( a, b ) is such member d , which divides both a and b and which is moreover divisible by all common factors. The greatest common factor can be generally found by the Euclidean algorithm – for more details see [75].
5.1.4. Diophantine equations The Diophantine equations play essential role in algebraic structures called ring. It is a case of equation with two unknowns and their solution has no sense in fields. The Diophantine equation is formulated as follows: A, B, C are considered to be members of a ring and the aim is to find all possible pairs X, Y (again from the supposed ring) which fulfill the relation:
AX + BY = C
(5.3)
The solution consists in two steps. The former, it is necessary to decide if the assumed equation has solution anyway, the latter how to find it. The first question can be answered after verifying the condition: The solution exists if and only if D divides C, where D = GCF ( A, B ) . If this term holds good, the equation (5.3) can be divided by this D resulting in the form:
- 87 -
A0 X + B0Y = C0
(5.4)
where A0 , B0 are coprime. Then, the equation (5.4) has infinitely many solutions which are given by: X = X 0 + B0 F
(5.5)
Y = Y0 − A0 F
where F is an arbitrary member of the ring and X 0 , Y0 constitute particular solution of (5.4). From the control theory point of view the equation (5.3) represents the condition for stability of the closed control loop, the notation (5.4) can be formulated as coprimeness condition for transfer function which influence e.g. reachability and controllability of continuous-time linear system and finally, relations (5.5) determine all stabilizing controllers and they are known as (Bongiorno-)Youla-Kučera parameterization.
5.2. Controller design The utilization of supra described algebraic tools allows to introduce fractional approach to synthesis based on works of Vidyasagar [75] and Kučera [41]. This method suppose description of linear systems in RPS bounded with classical transfer function by relation (5.2). The parameter m > 0 , which enters into the synthesis process, can be used as a “tuning knob” for influencing of final control response. The general closed control loop with presence of disturbance signals can be realized according to fig. 5.1. It should be emphasized that all functions and signals depicted in fig. 5.1 are considered to belong to RPS.
G v= v Fv
G n= n Fn
G w= w Fw
C(s)
u
G(s) =
B A
Fig. 5.1 – General control loop
- 88 -
y
This circuit can have separated feedback Cb ( s ) = C f (s) =
QC ( s ) PC ( s )
and feedforward
RC ( s ) part (control system with two degrees of freedom – 2DOF, FBFW). In PC ( s )
that event, assuming zero disturbances ( n = v = 0 ) , control signal u is generated by: u = (C f
⎛w⎞ Cb ) ⎜ ⎟ = C f w − Cb y ⎝−y⎠
If C ( s ) = Cb ( s ) = C f ( s ) =
(5.6)
QC ( s ) then fig. 5.1 constitutes conventional feedback PC ( s )
loop (control system with one degree of freedom – 1DOF, FB) working with tracking error e in compliance with: u = Cb ( w − y ) = Cb e
(5.7)
Signals w, n, v represent reference value, load disturbance in the input and disturbance in the output of the controlled plant, respectively. Usually, w and n are considered as step signals and disturbance v is modelled to have a harmonic shape. Hence, the denominators of these signals in RPS are: Fw = Fn =
s s2 + ω 2 ; Fv = 2 s+m ( s + m)
(5.8)
where ω is angular frequency and m > 0 . The first and definitely the most important requirement is to ensure the stability of control loop from fig. 5.1. Stabilizing controllers are given by ratio: QC QC 0 − AF = PC PC 0 + BF
(5.9)
where F is free in RPS, PC 0 + BF ≠ 0 and PC 0 , QC 0 is some particular solution of Diophantine equation:
APC + BQC = 1
(5.10)
- 89 -
The formula (5.9) says that there exists either infinite amount of stabilizing regulators or none and it is called (Bongiorno-)Youla-Kučera parameterization of controllers. Another important property is the convergency of tracking error e to zero. Working on an assumption that no disturbances affect the control system in fig. 5.1 ( n = v = 0 ) it follows for circuits given by (5.7) and (5.6), respectively: e=
APC Gw APC + BQC Fw
(5.11)
⎛ ⎞ Gw BRC e = ⎜1 − ⎟ APC + BQC ⎠ Fw ⎝
(5.12)
Algebraic analysis of (5.11), (5.12) and substitution of (5.10) to (5.11), (5.12) results in fact that for zero tracking error: lim e(t ) = lim [ s ⋅ e( s )] = 0 t →∞
(5.13)
s →0
the expression Fw must disappear from denominators of (5.11), (5.12). Therefore it follows: a)
Fw must divide product APC for structure 1DOF (5.7)
b) Fw must divide (1 − BRC ) for structure 2DOF (5.6) which implies the second Diophantine equation: Fw Z + BRC = 1
(5.14)
Utilizing this technique, the controller can be designed also for rejection of disturbances n and v. The situation during synthesis is similar, only a little bit more complicated [58], [60]. Suppose coprime ratios: B A A0 B , = = 0 Fv Fv 0 Fn Fn 0
(5.15)
then the equation of stability (5.10) takes the form: AFv 0 Fn 0 PC + BQC = 1
(5.16)
and the transfer function of feedback part of the controller is:
- 90 -
Cb =
QC PC Fv 0 Fn 0
(5.17)
The feedforward part is given again by (5.14). More details about ideas and tools which is the proposed control design method based on can be found in [75], [41] and concrete controller design and tuning e.g. in [56], [59]. The utilization of the methodology for stable or unstable time delay systems is described for example in [62], [57] and for extension in the sense of simultaneous tracking and disturbance rejection see [58] or [60]. Furthermore, comparison of solutions of Diophantine equations in the ring of polynomials and in RPS and some useful remarks and analyses for time delay systems are provided in [36].
5.3. Derivation of controller for first order system The whole process of controller design, described in previous part, can be illustrated by representative simple synthesis for first order controlled plant: G(s) =
b0 s + a0
(5.18)
After transposition of all transfer functions in RPS the basic “stabilizing” Diophantine equation (5.10) can be written in the form: s + a0 b p0 + 0 q0 = 1 s+m s+m
(5.19)
Its particular solution is given by: p0 = 1; q0 =
m − a0 b0
(5.20)
Consequently, all stabilizing controllers can be obtained with the assistance of YoulaKučera parameterization: PC = p0 +
b0 s + a0 F ; QC = q0 − F s+m s+m
(5.21)
where F is an arbitrary member of RPS. Supposing the step changes in reference signal (and thus Fw =
s ), it is now necessary to choose such controller from the set (5.21) s+m
- 91 -
in order to Fw divides APC (or in this case PC is enough) – see section 5.1.3 to remind divisibility in RPS. Hence, it has to be found appropriate F = f 0 . After simple adjustment it follows that complying f 0 is the one and only, scilicet f 0 = −
m . By its b0
substitution into (5.21) the numerator and denominator of the controller, which will not only stabilize the controlled plant in closed-loop system but it will also guarantee the asymptotic tracking of the reference signal, are obtained: 2m − a0 m2 s+ m − a0 s + a0 m b0 b0 s PC = ; QC = + = s+m b0 s + m b0 s+m
(5.22)
As can be clearly seen, the final controller of PI type is described by transfer function: 2m − a0 m2 s+ Q b0 b0 q s + q0 Cb = C = = 1 PC s s And hence it is obvious that both controller coefficients q1 =
(5.23) 2m − a0 m2 and q0 = are b0 b0
generally nonlinear functions of real scalar parameter m > 0 . If 2DOF control structure described by (5.6) is considered, it is necessary to solve one more Diophantine equation (5.14), this time in the concrete form: b s z0 + 0 r0 = 1 s+m s+m with particular solution r0 =
(5.24)
m s ; z0 = 1 and with general solution RC = r0 + F, b0 s+m
where F is again free in RPS (e.g. F = 0 ). The control law (5.6) is in RPS: r s + r0 m q s + q0 s u= 0 w− 1 y s+m s+m s+m Due to equality r0 m = q0 =
m2 the last equation (5.25) can be easily rewritten to: b0
- 92 -
(5.25)
⎡r ⎤ u (t ) = q1 ⎢ 0 w(t ) − y (t ) ⎥ + q0 ∫ [ w(t ) − y (t ) ] dt ⎣ q1 ⎦
(5.26)
The relation (5.26) is exactly generalized PI controller according to [5], [6], which, in compliance with empirically established results, in many cases reduces overshoots and produces smoother control responses.
5.4. Derivation of controller for second order system In this case, let the controlled plant to be given by a second order transfer function: G(s) =
b1s + b0 s + a1 s + a0
(5.27)
2
The basic Diophantine equation (5.10) can be expressed as: s 2 + a1s + a0 p1s + p0 b1s + b0 q1 s + q0 + =1 2 2 s+m ( s + m) ( s + m) s + m
(5.28)
Its particular solution is: p1 = 1 p0 =
3m 2 b0b1 − a0b0b1 − 3mb0 2 + a1b0 2 − b12 m3 a1b0 b1 − b0 2 − a0b12
q1 =
3m − a1 − p0 b1
q0 =
m3 − a0 p0 b0
(5.29)
Youla-Kučera parameterization purveys all solutions of the equation (5.28): PC = PC 0 + BF =
s + p0 b1s + b0 + F s + m ( s + m )2
QC = QC 0 − AF =
q1s + q0 s 2 + a1 s + a0 F − 2 s+m ( s + m)
(5.30)
(5.31)
This set represents all stabilizing controllers. However, similarly as in previous case of first order plant, there is a need to find the controller with desired properties, i.e. one which fulfill the appropriate condition of divisibility (Fw has to divide APC – ensuring
- 93 -
of asymptotic tracking). It can be done with the assistance of suitable choice of free parameter F. Again, from the consideration analogical to the previous event, it follows that F is given by expression: F = f0 = −
p0 m b0
(5.32)
Hence, the final solution can be written: ⎛ b ⎞ s 2 + s ⎜ p0 + m − p0 m 1 ⎟ b0 ⎠ s 2 + p1 s ⎝ PC = = 2 2 ( s + m) ( s + m)
⎛ p m⎞ ⎛ p m⎞ pm s 2 ⎜ q1 + 0 ⎟ + s ⎜ q0 + q1m + a1 0 ⎟ + a0 0 + q0 m b0 ⎠ ⎝ b0 ⎠ b0 = QC = ⎝ 2 ( s + m) =
(5.33)
(5.34)
q2 s + q1s + q0 2
( s + m)
2
and thus the transfer function of feedback controller is obtained in the form: Cb =
QC q2 s 2 + q1s + q0 = PC s ( s + p1 )
(5.35)
with parameters:
p1 = p0 + m − p0 m q2 = q1 +
b1 b0
p0 m b0
(5.36)
pm q1 = q0 + q1m + a1 0 b0 q0 = q0 m + a0
p0 m b0
For 2DOF control structure, the Diophantine equation (5.14) takes the form:
s z1s + z0 b1s + b0 + r0 = 1 s + m s + m ( s + m )2
- 94 -
(5.37)
The useful term of particular solution is r0 =
m2 s . For RC = r0 + F with F = 0 it b0 s+m
follows:
RC r0 r0 s 2 + 2r0 ms + r0 m 2 r2 s 2 + r1s + r0 Cf = = 2 = = s + p1s PC s 2 + p1s s 2 + p1s
( s + m)
(5.38)
2
Provided that the second order system has the relative order 2, that is
G(s) =
b0 s + a1 s + a0
(5.39)
2
the equation (5.28) changes into:
s 2 + a1s + a0 p1s + p0 b0 q1 s + q0 + =1 2 2 s+m ( s + m) ( s + m) s + m
(5.40)
with particular solution: p1 = 1 p0 = 3m − a1 q1 =
3m 2 − a0 p1 − a1 p0 b0
q0 =
m3 − a0 p0 b0
(5.41)
After the application of Youla-Kučera parameterization and choice of right solution for asymptotic tracking, the final controller has again the form of transfer function (5.35). This time, its parameters are given by: p1 = p0 + p1m q2 = q1 +
p0 m b0
q1 = q0 + q1m + a1 q0 = q0 m + a0
(5.42)
p0 m b0
p0 m b0
Furthermore, 2DOF configuration of control loop brings Diophantine equation:
- 95 -
b0 s z1s + z0 + r0 = 1 s + m s + m ( s + m )2 which again leads to r0 =
(5.43)
m2 and lastly to regulator (5.38). b0
5.5. Tuning of controllers As it has been already shown, the methodology based on RPS representation implies the fact that controller parameters and closed-loop control response can be further simply tuned with the help of single real scalar tuning parameter m > 0 . However, the very topical question is how to choose appropriate m to gain the controller which would fulfill additional user requirements. The simplest nevertheless practically often sufficient solution is to select this parameter more or less “randomly” or on the basis of “engineering feeling” and subsequently test the regulation by simulation. Even an inexperienced user is usually able to find a suitable m after several steps. Another two possibilities, discussed e.g. in [36], [56], [59] allow to tune the controller to be robust enough. The former way is to utilize the robust stability conditions [41], [75]. As far as both nominal and perturbed systems are known, the parameter m which guarantee robust stability of the closed control loop can be obtained. The latter method consists in minimization of sensitivity function [25], [41], [75] in the sense of the norm H ∞ . In this instance, such m which tunes the “most robust” controller towards changes in controlled system (or in closed loop transfer function) is found. On the other hand, resultant control responses do not need to be practically acceptable at all. Moreover, this work includes investigation of technique for selection of m based on user-defined nominal control behaviour, while the parameters of nominal transfer function are known. The proposed preliminary analysis deals with the simplest case of stable first order system and PI regulator.
- 96 -
5.5.1. Robust stability conditions Before the description of robust stability conditions itself, it would be useful to remind the notion of the H ∞ norm which is defined as: G = sup G ( s ) = sup G ( jω )
(5.44)
ω∈Re
Re s ≥ 0
for SISO systems or possibly: G1 G2 =
G1 G2
{
= sup G1 ( s ) + G2 ( s ) Re s ≥ 0
2
2
}
1 2
(5.45)
for two-dimensional systems. In other words, the norm (5.44) represents the radius of the smallest circle with the centre in the origin of the complex plane which includes the Nyquist plot of given system. Apropos, here comes out one of the advantages of the transcription to RPS. The conception of norm or distance can be defined in the ring of polynomials quite difficultly but in RPS all functions are stable and thus they have finite values of the norm H ∞ . Let the nominal plant to be denoted by transfer function G ( s ) = B ( s ) A( s ) and the perturbed one by G ( s ) = B ( s ) A( s ) . Their mutual distance can be quantified by simple inequalities: A − A ≤ ε1 ,
B − B ≤ ε2
(5.46)
A− A B − B ≤ε
(5.47)
Now, the conditions for robust stability of closed loop with controller designed e.g. in accordance with (5.9), (5.10) and perturbed plant complying (5.46), (5.47) can be formulated. Their proof is not trivial and it is related to Nyquist criterion. The stronger, sufficient condition is published in [41] in the form: A − A ⋅ PC + B − B ⋅ QC < 1
(5.48)
to write it differently:
ε1 PC 0 + BF + ε 2 QC 0 − AF < 1 The necessary and sufficient condition is proven in [75]:
- 97 -
(5.49)
A− A B − B ⋅
PC
0 . Minimum of this norm therefore determines “the most robust” controller for nominal plant from the viewpoint of sensitivity. If it does not exist the only minimum and sensitivity function is a non-increasing one from certain value of m, the control law can be called as highly robust. It is needful to remark that robust regulators designed and tuned by this approach (and robust controller generally, of
- 98 -
course) usually do not provide optimal control responses. The control time is often long and its behaviour contains overshoots. On the contrary, non-robust controllers have nice, fast and smooth control responses but, unlike robust ones, they are tuned only for nominal systems. If the 2DOF control system (5.6) is used, then the feedforward part of the controller does not have impact on the robust stability of the closed loop.
5.5.3. Nominal performance Both preceding techniques have solved the question how to select or reject the parameter m from the available set when the aim is to tune a robust controller. However, there is a lack of rules for nominal systems. This chapter proposes a possible approach developed by author in [46], [48]. First of all, it is necessary to choose the criterion for evaluation of nominal performance. For this outline and from the point of view of control engineers, a reasonable criterion can be seen in the overshooting and undershooting of control responses. The analysis is visualized for three couples of {b0 , a0 } : b0 = 1; a0 = 0.5
(5.54)
b0 = 1; a0 = 1
(5.55)
b0 = 1; a0 = 2
(5.56)
in first order transfer function: G(s) =
b0 s + a0
(5.57)
where a0 > 0 , i.e. stable system is assumed. Supposing the 1DOF configuration, PI controllers (5.23) were designed and tuned by m ∈ 0.05;15
for these three systems. Fig. 5.2 shows relations between the
parameter m and the percentage of the first undershoot while fig. 5.3 represents a similar dependence for the overshoots. Graph in fig. 5.2 is zoomed for better view. Typical shapes of the control responses with first undershoot or overshoot can be seen in fig. 5.4.
- 99 -
200
a0 = 0.5 undershoot [%]
150
a0 = 1 a0 = 2
100
50
0 0
0.2
0.4
0.6 m
0.8
1
1.2
Fig. 5.2 – Relation between m and undershoot for: (5.54) – blue, (5.55) – green, (5.56) – red
14 12
overshoot [%]
10 8
a0 = 0.5
6
a0 = 1
4
a0 = 2
2 0 0
5
10 m
Fig. 5.3 – Relation between m and overshoot for: (5.54) – blue, (5.55) – green, (5.56) – red
- 100 -
15
1.2 1
w(t), y(t)
0.8 0.6 0.4 0.2 0 -0.2 0
5
10
15
20
25
t [s]
Fig. 5.4 – Typical control responses with first undershoot or overshoot The deeper insight into these simulations gives an important result. If the ratio of m and a0 is a constant, then the control loop produces response with the same size of undershoot or overshoot. In other words, the control results of “same quality”, from the viewpoint of selected criterion, can be obtained if: m =κ a0
(5.58)
where κ is a constant. The closed-loop system generates the control responses with first undershoot if:
κ < 0.5
(5.59)
However, the bulk of industrial processes requires the regulation with shorter settling time (and without undershoots). This requirement can fulfill a higher value of κ . The corresponding constant κ for several values of first overshoot in percentage can be found in tab. 5.1.
- 101 -
Tab. 5.1 – Relation between κ and overshoot
Overshoot [%] 0 1 2 3 4 5 6 7 8 9 10
κ 1.00 1.62 1.87 2.14 2.44 2.80 3.25 3.81 4.58 5.67 7.38
Probably the most significant consequence from this analysis is that there exists some interval of m which does not produce any overshoot or undershoot. The “optimal” choice of m seems to be if the response is as fast as possible but still without overshoot. For this case, constant κ from (5.58) equals to 1 (see also tab. 5.1). As a result of this: m = a0
(5.60)
By further simulations it was found out that the value of parameter b0 does not influence the choice of m > 0 . The curves in fig. 5.2 and fig. 5.3 would be the same for every b0. Putting (5.60) into (5.23) gives the “optimal” parameters of PI controller: q1 =
a0 a2 ; q0 = 0 b0 b0
(5.61)
If the controlled system is assumed in the form: G(s) =
K Ts + 1
(5.62)
- 102 -
where K =
b0 1 and T = , then equations (5.58), (5.60) and (5.61) change into, a0 a0
respectively: Tm = κ
(5.63)
m=
1 T
(5.64)
q1 =
1 1 ; q0 = K KT
(5.65)
These ideas and simulation results can be also confirmed by analysis of the closed loop transfer function (see fig. 5.1 and suppose 1DOF configuration):
GW Y
BQC GCb APC BQC = = = = 1 + GCb 1 + BQC APC + BQC APC b0 ( q1 s + q0 )
(5.66)
b0 ( q1s + q0 ) ( s + m) = = ( s + a0 ) s + b0 ( q1s + q0 ) ( s + a0 ) s + b0 ( q1s + q0 ) 2 ( s + m) 2
Assuming controller parameters in (5.23), it holds for the numerator of (5.66): ⎛ 2m − a0 m2 ⎞ b0 ( q1s + q0 ) = b0 ⎜ s+ ⎟ b0 ⎠ ⎝ b0
(5.67)
For example, it can be seen that the closed-loop system has non-minimum phase behaviour (first undershoot for input signal positive step change) if: m < 0.5a0
(5.68)
which concurs with equations (5.58) and (5.59). The succeeding set of examples demonstrates possibilities of this tuning method under the simulation conditions as follows: Reference signal 1 with step change to 2 in 1/3 of simulation time and step load disturbance n = −0.2 (example 5.1) or n = −1 (example 5.2) which starts to affect the signal from the controller in 2/3 of simulation time.
- 103 -
Example 5.1: The controlled system is supposed to be given by transfer function: G(s) =
5 0.5 = 10 s + 1 s + 0.1
(5.69)
For obtaining output value without overshoot, tuning parameter
m = 0.1
(5.70)
is assumed. Equations (5.61) give PI controller: Cb ( s ) =
QC ( s ) 0.2 s + 0.02 = PC ( s ) s
(5.71)
The simulation results can be seen in fig. 5.5.
2
w(t), y(t), u(t)
1.5
1
0.5
0 0
50
100
150 t [s]
200
250
300
Fig. 5.5 – Control behaviour of 1DOF system with plant (5.69) and controller (5.71) – control response (black), manipulated variable (blue) The applicability of the above derived tuning rules can be confirmed also by another, known approaches – e.g. the controller with the same parameters is obtained by desired model method (formerly known as dynamics inversion method) supposing time constant of the closed-loop equals to the time constant of the controlled system ( Tw = T ) – see e.g. [76].
- 104 -
Example 5.2: In this part, which should demonstrate robustness of considered PI controllers and their applicability to higher order systems, the following transfer functions: GP1 ( s ) = GP 2 ( s ) =
1
( s + 1)
(5.72)
3
1
( s + 1)
(5.73)
7
are assumed to be controlled systems and they are simply approximated by: GN 1 ( s ) =
1 0.3 = 3s + 1 s + 0.3
(5.74)
GN 2 ( s ) =
1 7s + 1
(5.75)
0.1429 s + 0.1429
PI controllers tuned according to (5.61) computed for nominal systems (5.74) and (5.75) are described by transfer functions, respectively: Cb1 ( s ) =
QC1 ( s ) s + 0.3 = PC1 ( s ) s
(5.76)
Cb 2 ( s ) =
QC 2 ( s ) s + 0.1429 = PC 2 ( s ) s
(5.77)
The results of closed-loop control both for nominal and perturbed (higher order) systems are shown in fig. 5.6 and fig. 5.7. As can be seen, output signals seem to be acceptable for most common applications.
- 105 -
2
w(t), y(t)
1.5
1
0.5
0 0
10
20
30
40 50 t [s]
60
70
80
90
Fig. 5.6 – The closed-loop control: PI regulator (5.76) for higher order system (5.72) (solid) and nominal one (5.74) (dotted)
2.5
w(t), y(t)
2
1.5
1
0.5
0 0
50
100
150 t [s]
200
250
300
Fig. 5.7 – The closed-loop control: PI regulator (5.77) for higher order system (5.73) (solid) and nominal one (5.75) (dotted)
- 106 -
6. SOFTWARE IMPLEMENTATION AND SIMULATION EXAMPLES This chapter introduces user-friendly program for synthesis and simulation of control systems under assumption that controlled plants are affected by interval uncertainty. It incorporates selected controller design algorithms and tools for robust stability analysis as they have been described hereinbefore. The developed software takes advantage of functions and graphical user interface (GUI) of MATLAB 6.5.1 and also benefits of simulation environment SIMULINK and support of the Polynomial Toolbox 2.5. In pastness, it has been already created several similar programs in Faculty of Applied Informatics and formerly in Faculty of Technology – e.g. it has been packages for control of time delay systems [36] or its embellishment for control of systems with time-varying (periodic) parameters [61]. The main menu window of the described product is shown in fig. 6.1.
Fig. 6.1 – The window of main menu
- 107 -
It follows a very brief depiction of program possibilities according to numbered items from fig. 6.1: 1) The definition of nominal system (with fixed parameters) which is used for controller design. 2) The definition of perturbed system (with interval parameters) which is used for simulation of control. 3) Size of perturbations (expressed in percentage). 4) The choice of strategy for controller tuning. The first eventuality allows user to define an arbitrary value of tuning parameter m > 0 while the second one minimizes the sensitivity function and searches for the “most robust” regulator to given nominal plant. 5) The selection of one from two basic closed control loop configurations – 1DOF or 2DOF control system. 6) The option of desired properties of the controller – either asymptotic tracking of reference signal or simultaneous tracking and disturbance rejection. 7) Adjustments of basic simulation parameters such as simulation time, reference signal, load disturbance and controller saturation. 8) Possibility of harmonic disturbance setting (in the output of the controlled plant). 9) Possibility of ramp disturbance setting (in the output of the controlled plant). 10) The selection of simulation results which should be displayed. The important item is “Number of partial intervals for simulation” defining how many intervals is each uncertain parameter in controlled system divided into. In other words, this number increased by one expresses the quantity of “sampled” values in individual uncertain coefficients. The aim is to create some “representative set of systems” (RSS) used for simulation process. However, be careful, the higher numbers noticeably increase computational time. 11) The buttons for start of simulation and exit from the program. The capability of developed software is demonstrated on the following examples.
- 108 -
Example 6.1: The controlled plant is given as the second order interval system described by uncertain transfer function: G ( s, bi , ai ) =
b1s + b0 s + a1s + a0
(6.1)
2
where b1 , b0 , a1 , a0 ∈ 0.5;1.5 . The system (6.1) in which the parameters are not uncertain, but they supposed to be fixed b1 = b0 = a1 = a0 = 1 is considered as the nominal one. The simulation conditions were used as follows: All uncertain parameters of the system (6.1) are divided into 6 partial intervals (sampled into 7 certain values), i.e. the curves corresponding to responses of 7 4 = 2401 members of RSS from the family (6.1) appear in graphs; in control simulations, the reference signal with step change from 1 to 2 is assumed in one third of simulation time and the step load disturbance of the size -1 is injected to the input of the controlled plant during the last third of simulation. The step responses of 2402 members of the interval family (2401 systems from RSS depicted in black + 1 nominal system in red) are shown in fig. 6.2. 4.5 4 3.5 3
h(t)
2.5 2 1.5 1 0.5 0 -0.5 0
5
10
15
t [s]
Fig. 6.2 – Step responses of 2402 systems from interval family (6.1) – (the red curve represents the nominal plant)
- 109 -
The task is to design the regulator which guarantees the asymptotic tracking of the reference signal and robust stability of the closed control loop, i.e. stability of control system for all members of interval family (6.1). The synthesis is performed via methodology described in chapter 5. The choice m = 0.6 and putting into relations (5.29), (5.35), (5.36) lead to PID controller for 1DOF configuration: Cb =
QC q2 s 2 + q1s + q0 0.4256s 2 − 0.24s + 0.1296 = = PC s 2 + p1 s s 2 + 0.9744s
(6.2)
As can be easily verified, the nominal system will be stabilized by this controller in closed loop. The question runs, if the control circuit is robustly stable. The closed loop characteristic polynomial has affine linear uncertainty structure: p ( s, bi , ai ) = s 4 + ( a1 + b1q2 + p1 ) s 3 + ( a0 + a1 p1 + b1q1 + b0 q2 ) s 2 + + ( a0 p1 + b1q0 + b0 q1 ) s + b0 q0
(6.3)
thus: p ( s, bi , ai ) = s 4 + ( a1 + 0.4256b1 + 0.9744 ) s 3 + + ( a0 + 0.9744a1 − 0.24b1 + 0.4256b0 ) s 2 +
(6.4)
+ ( 0.9744a0 + 0.1296b1 − 0.24b0 ) s + 0.1296b0 First, the robust stability of (6.4) is investigated through the overbounding method. Apart from other things, the overbounding interval polynomial and four related Kharitonov polynomials can be seen in fig. 6.3 which represents final result of robust stability analysis from the program.
Fig. 6.3 – Results of robust stability investigation from the program
- 110 -
It is effortless to check that only two of Kharitonov polynomials are stable. Kharitonov rectangles from fig. 6.4 (depicted actually only for illustration) ergo distinctly indicate robust instability of the overbounding polynomial because they cover the origin of the complex plane (frequencies from 0 to 2 with step 0.02). However, generally it does not point to any conclusion about robust stability of original structure (6.4) because the mutual dependence among polynomial coefficients has been ignored.
0.6
0
0.4
-10
Imag Axis
Imag Axis
-5
-15
0.2 0 -0.2
-20
-0.4
-25 0
5 Real Axis
10
-0.6
-0.4
-0.2 Real Axis
0
0.2
Fig. 6.4 – The Kharitonov rectangles of overbounding interval polynomial (full view and detail) Nevertheless, the “true” value sets of the polytope of polynomials (6.4) in fig. 6.5 reveal the closed-loop system is not robustly stable indeed.
0.15
0
0.1
-10
Imag Axis
Imag Axis
-5
-15
0
-0.05
-20
-25
0.05
-2
0
2
4 6 Real Axis
8
10
12
-0.1
-0.15
-0.1
-0.05
0 0.05 Real Axis
0.1
0.15
0.2
Fig. 6.5 – The value sets of polytope of polynomials (6.4) (full view and detail)
- 111 -
Besides, this fact is confirmed by RSS control behaviour itself gained as an output from 1DOF control structure constructed in SIMULINK environment. The simulation scheme is shown in fig. 6.6 while the control response can be seen in fig. 6.7.
Harmonic Disturbance q(s)
bsim(s)
p(s) Reference Signal
asim(s) Saturation
Controller
w, y, v
Controlled System
Ramp Disturbance
Load Disturbance
u
Fig. 6.6 – SIMULINK scheme of 1DOF control system 12 10 8
w(t), y(t)
6 4 2 0 -2 -4 -6 -8 0
10
20
30
40 50 t [s]
60
70
80
90
Fig. 6.7 – Control of RSS of interval family (6.1) and nominal system (red curve) by controller (6.2) If the feedback controller (5.35) is tuned by value m = 1 , it holds:
Cb =
QC 2 s 2 + 2 s + 1 = PC s2 + s
(6.5)
This regulator results in polytope of polynomials (6.3) in the form:
- 112 -
p ( s, bi , ai ) = s 4 + ( a1 + 2b1 + 1) s 3 + ( a0 + a1 + 2b1 + 2b0 ) s 2 +
(6.6)
+ ( a0 + b1 + 2b0 ) s + b0
The Kharitonov rectangles of overbounding interval polynomial for (6.6) are plotted in fig. 6.8 analogically to previous case. The overbounding method is not successful again so robust stability can not be resolved and on that account the value sets of original structure (6.6) are shown in fig. 6.9 (frequencies from 0 to 3.5 with step 0.04). Now, the zero point is excluded from the value sets thus the polytope of polynomials (6.6) and hence also the closed-loop control system is robustly stable.
0 3 2 Imag Axis
Imag Axis
-50
-100
-150
1 0 -1 -2
-200
-3 -20
0
20
40 60 Real Axis
80
100
120
-4
-3
-2
-1 Real Axis
0
1
Fig. 6.8 – The Kharitonov rectangles of overbounding interval polynomial (full view and detail) 3
0
2 1
-50 Imag Axis
Imag Axis
0 -100
-1 -2 -3
-150
-4 -5
-200 0
20
40 60 Real Axis
80
100
-6
-5
-4
-3
-2 -1 Real Axis
0
1
Fig. 6.9 – The value sets of polytope of polynomials (6.6) (full view and detail)
- 113 -
Robust stability of the closed loop is vindicated by control simulation of RSS depicted in fig. 6.10. 2.5
w(t), y(t)
2
1.5
1
0.5
0 0
10
20
30
40 50 t [s]
60
70
80
90
Fig. 6.10 – Control of RSS of interval family (6.1) and nominal system (red curve) by controller (6.5) The shorter settling time can be obtained by further tuning of controllers by parameter m. Assuming the 1DOF configuration of control system, the selection
m = 1.5 gives the feedback regulator: Cb =
QC 4.0625s 2 + 7.5s + 5.0625 = PC s 2 + 0.9375s
(6.7)
and the computation for 2DOF structure adds the feedforward part:
Cf =
RC 2.25s 2 + 6.75s + 5.0625 = PC s 2 + 0.9375s
(6.8)
For this once, only the final simulations of control behaviour are shown without deeper insight both for 1DOF and 2DOF configurations – see fig. 6.11 and fig. 6.12, respectively. However, the costs for “faster” regulation are much more aggressive control signals.
- 114 -
2.5
w(t), y(t)
2
1.5
1
0.5
0 0
10
20
30
40 50 t [s]
60
70
80
90
Fig. 6.11 – Control of RSS of interval family (6.1) and nominal system (red curve) by controller (6.7) – 1DOF
2.5
w(t), y(t)
2
1.5
1
0.5
0 0
10
20
30
40 50 t [s]
60
70
80
90
Fig. 6.12 – Control of RSS of interval family (6.1) and nominal system (red curve) by controller (6.7), (6.8) – 2DOF
- 115 -
7. CONTROL OF PERIODICALLY TIME-VARYING SYSTEMS The section pays attention to possible utilizing of continuous-time robust compensators designed with the assistance of methodology from chapter 5 to control of periodic systems.
7.1. System description The capability of proposed robust algorithms is demonstrated on control of timevarying continuous-time dynamical systems with periodically perturbed parameters, generally also with time-delay. Unlike systems with parametric uncertainty, here the parameters change significantly in time. Under assumption of zero initial conditions, it is described through differential equation:
an (t ) y ( ) (t ) + an −1 (t ) y ( n
n −1)
(t ) + … + a0 (t ) y (t ) =
= bm (t )u ( m ) (t − Td (t )) + bm −1 (t )u ( m −1) (t − Td (t )) + … + b0 (t )u (t − Td (t )); (7.1) m 0 lead to numbers from tab. 7.2.
Tab. 7.2 – Various parameters of controller (5.35) m
q2
q1
q0
p1
1 3 5
0.5 12.5 48.5
1 45 233
0.5 40.5 312.5
1 9 17
The outputs from closed loops containing the controllers tuned according to tab. 7.2 are shown in fig. 7.4. 3 m=1
2.5
m=5
w(t), y(t)
2 1.5 m=3
1 0.5 0 0
10
20
30 t [s]
40
Fig. 7.4 – Control of plant (7.8)
- 122 -
50
60
7.2.3. First order plant with time-varying delay Finally, the differential equation or “transfer function”: y ′(t ) + ⎡⎣ 0.1 + 0.01sin ( 0.5t ) ⎤⎦ y (t ) = [ 0.1 + 0.01sin t ] u (t − [10 + sin t ]); G ( s, t ) =
(7.10)
0.1 + 0.01sin t e −(10 + sin t ) s s + ⎡⎣ 0.1 + 0.01sin ( 0.5t ) ⎤⎦
describing the first order plant affected by time-varying delay is assumed to be a controlled system. Time delay, which entails complications in process control itself, is moreover considered in (7.10) as time-varying. For control design purpose, it has been superseded by Padé approximation (7.4). The nominal system can be hence written as: G ( s) =
0.1(1 − 5s )
(7.11)
( s + 0.1)(1 + 5s )
The final controller takes the form (5.35) again, now with parameters (5.36). In this instance, it has been tuned by the single parameter m = 0.2 which produces q2 = 3.6 ; q1 = 1.13 ; q0 = 0.08 ; and p1 = 0.86 . Resulting closed-loop control behaviour is
demonstrated in fig. 7.5. 2.5
w(t), y(t)
2
1.5
1
0.5
0 0
50
100
150 t [s]
200
Fig. 7.5 – Control of plant (7.10)
- 123 -
250
300
The output signal from fig. 7.5 appears to be relatively acceptable for most of common applications with respect to time-variability of delay which represent severe problem.
- 124 -
8. REAL EXPERIMENTS The main aim of this chapter is to test and evaluate practical utilizability of the proposed control algorithms on the set of real experiments.
8.1. Description of hot-air tunnel and used equipment The controlled plant has been represented by laboratory model of hot-air tunnel constructed in VŠB – Technical University of Ostrava [68]. Generally, this object can be seen as MIMO system, however, the experiments have been done on two selected SISO loops. The model is composed of the bulb, primary and secondary ventilator and an array of sensors covered by tunnel. The bulb is powered by controllable source of voltage and serves as the source of light and heat energy while the purpose of ventilators is to ensure the flow of air inside the tunnel. All components are connected to the electronic circuits which adjust signals into the voltage levels suitable for CTRL 51 unit. Finally, this control unit is connected with the personal computer (PC) via serial link RS232. The real visual appearance is shown in fig. 8.1.
Fig. 8.1 – Model of hot-air tunnel connected to PC via CTRL 51 unit
- 125 -
The fig. 8.2 presents the simplified diagram (only by reason of convenient model orientation and “nicer” illustration, the secondary ventilator is formally depicted on the opposite side than in the real case). Photoresistor Ventilator
Secondary ventilator
Light bulb
Thermoanemometer Vane flowmeter
Thermistors
Tunnel covering
Electronic circuits Inputs
Outputs
Power supply
CTRL 51 Unit
RS 232
PC
Fig. 8.2 – Scheme of hot-air tunnel and whole control system The CTRL 51 unit has been produced by Institute of Information Theory and Automation, Academy of Sciences of the Czech Republic [40] and it has the following technical parameters [68] (factually verified): •
CPU Intel 8751
•
4 KB internal EPROM
•
128 B internal + 256 B external RAM
•
16 analog inputs and 4 analog outputs
•
A/D converter with 0-10 V range and 12 bit resolution
•
D/A converter with 0-10 V range, 12 bit resolution and no more than 3 % of mutual influence
•
Communication with PC via standard serial interface RS232 (parameters: max. speed 9600 Bd, 8 data bits, 1 stop bit, without parity)
•
Power voltage +5 V at current consumption 0.6 A and +15 V at 0.1 A
•
Outer dimensions approximately 6 x 17 x 21 cm
- 126 -
The tab. 8.1 denotes the meaning of input and output channels of CTRL 51 unit.
Tab. 8.1 – Connection of input and output signals of CTRL 51 unit Input channel
Output channel
Sensor
Input 1 (y1) Input 2 (y2) Input 3 (y3) Input 4 (y4) Input 6 (y6) Input 7 (y7)
Actuator
Bulb voltage (control of light intensity and bulb temperature) Temperature a few mm Voltage of the primary from the bulb Output 2 (u2) ventilator (control of (2nd thermistor) revolutions) Voltage of the secondary Temperature of the bulb Output 3 (u3) ventilator (control of (1st thermistor) revolutions) Temperature at the end of the tunnel (3rd thermistor) Airflow speed (thermoanemometer) Airflow speed (vane flowmeter) Light intensity of the bulb (photoresistor)
Output 1 (u1)
All presented identification and control experiments were performed using the notebook HP Compaq nc6120 with Intel Pentium M processor 1.86 GHz, 512 MB DDR-333 SDRAM, Windows XP and MATLAB 6.5.1. The communication between MATLAB and CTRL 51 unit was arranged through four user function (for initialization, reading and writing of data and for closing) and the synchronization of the program with real time was done via „semaphore“ principle (furthermore, the utilization of MATLAB functions „tic“ and „toc“ as an alternative were tested). To ensure the sufficient emulation of the continuous-time control algorithms, the sampling time 0.1 s was set. However, this short sampling period was not observed and the real one was approximately by 25 % higher. The detailed information about utilization of serial
link
under
MATLAB
including
mentioned
user
routines,
program
synchronization mechanism and several tests can be found in [26]. The discretization of integrative part of control laws was carried out by left rectangle approximation method (the trapezoid method was also tried with the very similar results).
- 127 -
8.2. Bulb temperature The first considered loop covers bulb voltage u1 (control signal) which influences temperature of the bulb y3 (controlled variable). The other actuating signals were preset to constant values – primary ventilator voltage u2 to 2 V and secondary one u3 to 0 V (in spite of it, the fan revolved).
8.2.1. System identification Naturally, the first task was to determine static and dynamic behaviour of the system. The trio of static characteristics measured during three different days is plotted in fig. 8.3 (the points are averages of last 20 measured “steady” values – here exceptionally with period 0.5 s). 8 7
y3 [V]
6 5 4 3 2 1
2
3
4
5 6 u1 [V]
7
8
9
10
Fig. 8.3 – Static characteristics of the system (u1 – y3) Note, that the system properties markedly depend on current conditions and operating point and that it can be saturated in higher levels of u1. Therefore, the value 10 V was excluded from the subsequent process of identification. The fig. 8.4 shows the set of step responses with the starting point u1 = 0 V (nevertheless, the filament was slightly incandescent) while the final value of u1 is from 1 to 9 V and fig. 8.5 depicts the similar responses from u1 = 5V to 6, 7, 8 and 9 V.
- 128 -
8 7
y3 [V]
6 5 4 3 2 0
200
400 t [s]
600
800
Fig. 8.4 – Step responses of the system (u1 – y3) for starting value u1 = 0 V 7 6.5
y3 [V]
6 5.5 5 4.5 4 0
200
400 t [s]
600
800
Fig. 8.5 – Step responses of the system (u1 – y3) for starting value u1 = 5V
All measured responses were normalized and approximated by step response of system with selected structure. In the first instance, it has been approximated by first order system, i.e. the transfer function has been simply assumed as:
- 129 -
G(s) =
K Ts + 1
(8.1)
However, with respect to the character of dynamics which is initially very fast and gradually starts to slow, the first order plant represents simplified solution. On that account, also the second order system with transfer function: G(s) =
K (τ s + 1)
(8.2)
(T1s + 1)(T2 s + 1)
has been assumed. The least squares method was employed for identification. Hence, the form of approximated function is: t − ⎞ ⎛ h(t ) = K ⎜1 − e T ⎟ ⎝ ⎠
(8.3)
for (8.1) and: t t ⎛ τ − T1 − T1 T2 − τ − T2 h(t ) = K ⎜1 + e + e ⎜ T1 − T2 T1 − T2 ⎝
⎞ ⎟ ⎟ ⎠
(8.4)
for (8.2). In an effort to stress the initial part of step responses with fast dynamics more, only first 100 seconds have been included in optimization process of T for first order identification. Furthermore, the gains of all the systems have not been involved in optimization at all. They have been fixed according to average of 20 measured values from step responses. The example of approximation by both first (8.1) and second order system (8.2) is given in fig. 8.6. It belongs to u1 step-change from 0 to 5 V. In this particular case, the functions have the form: G(s) =
0.374 37.2064s + 1
(8.5)
and G(s) =
0.374 ( 76.1006s + 1)
( 6.6347s + 1)(130.6889s + 1)
- 130 -
(8.6)
0.4 0.35 0.3
h(t)
0.25 second order system
0.2 0.15 0.1
first order system
0.05 0 0
50
100
150 t [s]
200
250
300
Fig. 8.6 – Example of approximation by first and second order system The complete identification results for first and second order cases are shown in tab. 8.2 and tab. 8.3.
Tab. 8.2 – Results of identification for first order transfer function u1 [V]
K [-]
T [s]
0–1 0–2 0–3 0–4 0–5 0–6 0–7 0–8 0–9 5–6 5–7 5–8 5–9
0.2435 0.2833 0.3594 0.4274 0.3740 0.4107 0.4599 0.4889 0.4680 0.5656 0.5505 0.5676 0.5403
41.2259 47.2704 43.3580 48.2019 37.2064 37.2289 41.2868 37.9254 30.7657 35.1384 34.5624 28.0184 26.0924
- 131 -
Tab. 8.3 – Results of identification for second order transfer function u1 [V]
K [-]
τ [s]
T1 [s]
T2 [s]
0–1 0–2 0–3 0–4 0–5 0–6 0–7 0–8 0–9 5–6 5–7 5–8 5–9
0.2435 0.2833 0.3594 0.4274 0.3740 0.4107 0.4599 0.4889 0.4680 0.5656 0.5505 0.5676 0.5403
27.1160 33.6512 115.9249 109.6962 76.1006 119.7679 119.2653 114.5048 93.7720 79.5117 90.2150 93.1630 94.5474
3.6437 3.2631 11.9881 10.8675 6.6347 9.5334 9.5686 9.5139 9.4876 4.9491 9.6484 8.1383 11.5862
72.1970 92.8624 186.0546 195.5283 130.6889 186.3907 194.5886 180.0520 137.8641 137.3248 139.7103 135.3549 123.6040
The set of data from previous tables and advisement of substantive properties have led to the construction of models with parametric uncertainty. The lower bound of time constant T in model (8.7) has been moved down to 5 s because of fast initial dynamics which should also be taken into consideration. Thus, the chosen parametric models are: G ( s, K , T ) =
[0.2; 0.7] K = Ts + 1 [5; 50] s + 1
G ( s, K ,τ , T1 , T2 ) =
(8.7)
[0.2; 0.7 ] ([ 25;130] s + 1) (T1s + 1)(T2 s + 1) ([3;14] s + 1) ([70; 210] s + 1) K (τ s + 1)
=
(8.8)
8.2.2. Control experiments First, the uncertain model (8.7) and nominal system (for controller design): GN ( s ) =
0.5 0.02 = 25s + 1 s + 0.04
(8.9)
has been assumed. The choice of (8.9) has been based on control conditions and relevance of identified coefficients from tab. 8.2. The tuning parameter m = 0.0748 ,
- 132 -
which correspond to 2% of first overshoot from tab. 5.1, has been selected. The computed 1DOF PI controller is: Cb ( s ) =
QC ( s ) q1s + q0 5.48s + 0.2798 = = PC ( s ) s s
(8.10)
The characteristic polynomial of closed control loop containing plant (8.7) and controller (8.10) can be easily formulated as: p ( s, K , T ) = Ts 2 + (1 + Kq1 ) s + Kq0 = = [5; 50] s 2 + [ 2.096; 4.836] + [ 0.05596; 0.1959]
(8.11)
This simple polynomial is robustly stable, i.e. the whole system is robustly stable. The real closed-loop control behaviour can be seen in fig. 8.7. The control signal is depicted only in 25% of its true size because of better perspicuity of the controlled variable. 6
w(t), y3(t), 25% u1(t)
5 4 3 2 1 0 -1 0
300
600
900 t [s]
1200
1500
1800
Fig. 8.7 – Control of bulb temperature by regulator (8.10) Next, it has been supposed the system with parametric uncertainty (8.8) and the nominal plant: GN ( s ) =
0.5 (100 s + 1)
( 9s + 1)(150s + 1)
=
0.037s + 0.00037 s + 0.117s + 0.00074 2
- 133 -
(8.12)
Unfortunately, the single tuning parameter entails limitation in control design here and it is not facile to find appropriate one with “quality” control response. The chosen value m = 0.025 results in 1DOF PID controller: Cb ( s ) =
QC ( s ) q2 s 2 + q1s + q0 −1.1556s 2 + 0.01324 s + 0.001055 (8.13) = = PC ( s ) s 2 + p1 s s 2 + 0.02502 s
The plant (8.8) and regulator (8.13) leads to closed-loop characteristic polynomial:
p ( s, K ,τ , T1 , T2 ) = (T1 s + 1)(T2 s + 1) ( s 2 + p1s ) + + K (τ s + 1) ( q2 s 2 + q1s + q0 ) = = T1T2 ( s 4 + p1s 3 ) + (T1 + T2 ) ( s 3 + p1s 2 ) +
(8.14)
+ Kτ ( q2 s 3 + q1s 2 + q0 s ) + K ( q2 s 2 + q1s + q0 ) + + ( s 2 + p1s ) Unluckily, the system is not robustly stable with assumed range of uncertain parameters (it can be analysed e.g. via graphical test – the Polynomial Toolbox commands „vset“ and „vsetplot“ – see section 4.5). The boundaries in (8.8) are too broad, i.e. the requirements are too strong. Margins have to be narrowed to gain the closed loop robustly stable with the controller (8.13). However, the real system has been stable (with non-minimum phase behaviour), as can be seen in fig. 8.8. 6
w(t), y3(t), 25% u1(t)
5 4 3 2 1 0 -1 0
300
600
900 t [s]
1200
1500
1800
Fig. 8.8 – Control of bulb temperature by regulator (8.13)
- 134 -
If 2DOF structure and m = 0.02 is used, the final controller arises in the form: Cb ( s ) =
QC ( s ) q2 s 2 + q1 s + q0 −1.3701s 2 + 0.01727 s + 0.000432 = = PC ( s ) s 2 + p1s s 2 + 0.01297 s
R ( s ) r2 s 2 + r1 s + r0 1.08s 2 + 0.0432 s + 0.000432 C f (s) = C = = PC ( s ) s 2 + p1s s 2 + 0.01297 s
(8.15)
The feedforward part does not influence robust stability, i.e. this controller would ensure it under similar conditions as in the previous case. Fig. 8.9 presents the control results. 6
w(t), y3(t), 25% u1(t)
5 4 3 2 1 0 -1 0
300
600
900 t [s]
1200
1500
1800
Fig. 8.9 – Control of bulb temperature by regulator (8.15) Another possibility of simplifying (instead of approximation by first order model) can be done via additional order reduction in identified second order system. The order reductions first only in numerator and afterward both in numerator and denominator lead to nominal transfer functions, respectively: GN ( s ) = ≈
0.00037 0.5 = ≈ s + 0.117s + 0.00074 ( 9 s + 1)(150 s + 1) 2
0.5 (100s + 1)
( 9s + 1)(150s + 1) - 135 -
(8.16)
0.5 (100 s + 1) 0.003145 0.5 = ≈ s + 0.006289 159s + 1 ( 9 s + 1)(150 s + 1)
GN ( s ) =
(8.17)
The former approximation (8.16) and m = 0.04 result in controller: Cb ( s ) =
QC ( s ) q2 s 2 + q1s + q0 10.4933s 2 + 0.6068s + 0.006912 = = (8.18) PC ( s ) s 2 + p1 s s 2 + 0.04222s
while the latter one (8.17) and m = 0.0204 (6% first overshoot for case of nominal system) leads to: Cb ( s ) =
QC ( s ) q1s + q0 10.9733s + 0.1323 = = PC ( s ) s s
(8.19)
The plant (8.8) and the controller (8.18) give, again, the closed-loop characteristic polynomial with structure (8.14). However, in this instance, it is robustly stable. Furthermore, the controlled system (8.8) and the regulator (8.19) yield the polynomial: p ( s, K ,τ , T1 , T2 ) = (T1s + 1)(T2 s + 1) s + K (τ s + 1)( q1s + q0 ) = = T1T2 s 3 + (T1 + T2 ) s 2 +
(8.20)
+ Kτ ( q1s + q0 s ) + K ( q1s + q0 ) + s 2
which is also robustly stable. The fig. 8.10 and fig. 8.11 demonstrate the final control responses for both cases. 6
w(t), y3(t), 25% u1(t)
5 4 3 2 1 0 -1 0
300
600
900 t [s]
1200
1500
1800
Fig. 8.10 – Control of bulb temperature by regulator (8.18)
- 136 -
6
w(t), y3(t), 25% u1(t)
5 4 3 2 1 0 -1 0
300
600
900 t [s]
1200
1500
1800
Fig. 8.11 – Control of bulb temperature by regulator (8.19)
8.3. Airflow speed The second assumed control system consists of voltage of primary ventilator u2 (control signal) and airflow speed at the end of the tunnel measured through vane flowmeter y7 (controlled variable). The constant adjustment of other signals was u1 = 0 V and u 3 = 0 V .
8.3.1. System identification Analogously to the previous system, three static characteristics were measured, each in a different day. These curves are depicted in fig. 8.12 (again, the points are averages of last 20 measured “steady” values – now with period 0.1 s).
- 137 -
9 8
y7 [V]
7 6 5 4 3 2 1
2
3
4
5 6 u2 [V]
7
8
9
10
Fig. 8.12 – Static characteristics of the system (u2 – y7) In this instance, it seems that the behaviour of the system depends on the operational point more then in the previous case (the reference signal in control experiments will be 5 and 6 V). Needless to say, the sets of step responses follow – in fig. 8.13 for the starting point u 2 = 1V and the final value u 2 = 2 ∼ 10 V while in fig. 8.14 for ventilator voltage from u 2 = 5V to u 2 = 6 ∼ 10 V . 9 8
y7 [V]
7 6 5 4 3 2 0
5
10
15 t [s]
20
25
30
Fig. 8.13 – Step responses of the system (u2 – y7) for starting value u 2 = 1V
- 138 -
9 8.5
y7 [V]
8 7.5 7 6.5 6 0
5
10
15 t [s]
20
25
30
Fig. 8.14 – Step responses of the system (u2 – y7) for starting value u 2 = 5V
In this case, the normalized responses have been approximated by step responses of a second order system with double time constant described by: ⎡ ⎛ t h(t ) = K ⎢1 − ⎜ 1 + ⎣ ⎝ T
t ⎞ −T ⎤ e ⎥ ⎟ ⎠ ⎦
(8.21)
Such a system has the transfer function: G(s) =
K
(Ts + 1)
(8.22)
2
The fig. 8.15 shows the graphical example of approximation using the least squares method for step-change of u2 from 1 to 5 V, where the identified system is described by: G(s) =
0.8891
( 2.0505s + 1)
(8.23)
2
- 139 -
1
0.8
h(t)
0.6
0.4
0.2
0 0
5
10
15
t [s]
Fig. 8.15 – Example of approximation by second order system with double time constant The entire results of identification are displayed in tab. 8.4.
Tab. 8.4 – Results of identification for second order transfer function with double time constant u2 [V]
K [-]
T [s]
1–2 1–3 1–4 1–5 1–6 1–7 1–8 1–9 1 – 10 5–6 5–7 5–8 5–9 5 – 10
1.0714 1.0191 0.9613 0.8891 0.8269 0.7762 0.7410 0.6934 0.6526 0.7205 0.6162 0.5849 0.5509 0.5222
2.8485 2.5034 2.2757 2.0505 1.8646 1.7636 1.6958 1.6018 1.5528 1.7621 1.5425 1.5341 1.4461 1.3962
- 140 -
Further, the mathematical model with parametric uncertainty was constructed on the basis of data from the tab. 8.4. Although the intended working point corresponds to reference values of y7 at 5 and 6 V, the model is going to cover all measured area. Identification by higher revolutions would lead to even smaller gain K and shorter time constant T. Therefore, the final model takes it into account: G ( s, K , T ) =
K
(Ts + 1)
=
2
[0.3;1.2] 2 ([1; 3] s + 1)
(8.24)
8.3.2. Control experiments It has been supposed the second order uncertain model (8.24) and nominal system with transfer function: GN ( s ) =
0.7
(1.9s + 1)
2
=
0.1939 s + 1.0526s + 0.277 2
(8.25)
The choice of tuning parameter m = 0.6 results in the regulator: Cb ( s ) =
QC ( s ) q2 s 2 + q1s + q0 2.3967 s 2 + 2.5311s + 0.6684 = = PC ( s ) s 2 + p1 s s 2 + 1.3474 s
(8.26)
The closed-loop characteristic polynomial for plant (8.24) and controller (8.26) can be easily formulated as: p ( s, K , T ) = (Ts + 1) ( s 2 + p1s ) + K ( q2 s 2 + q1s + q0 ) = 2
= T 2 ( s 4 + p1 s 3 ) + T ( 2s 3 + 2 p1s 2 ) +
(8.27)
+ K ( q2 s 2 + q1s + q0 ) + ( s 2 + p1s ) The analysis has indicated that the polynomial and thus also control system is robustly stable. The fig. 8.16 illustrates the closed-loop control behaviour. Possibly, the controller with both feedback and feedforward part (for 2DOF configuration and the same parameter m = 0.6 ) is given by:
Cb ( s ) =
QC ( s ) q2 s 2 + q1s + q0 2.3967 s 2 + 2.5311s + 0.6684 = = PC ( s ) s 2 + p1 s s 2 + 1.3474 s
R ( s ) r2 s 2 + r1s + r0 1.8566 s 2 + 2.228s + 0.6684 = = C f (s) = C PC ( s ) s 2 + p1s s 2 + 1.3474 s
- 141 -
(8.28)
and it changes control in the way which can be seen in fig. 8.17. 7
w(t), y7(t), u2(t)
6
5
4
3
2 0
10
20
30
40 50 t [s]
60
70
80
90
Fig. 8.16 – Control of airflow speed by regulator (8.26)
7
w(t), y7(t), u2(t)
6
5
4
3
2 0
10
20
30
40 50 t [s]
60
70
80
90
Fig. 8.17 – Control of airflow speed by regulator (8.28) The last experiment relies again on simplification based on model order reduction. Hence, the trivial approximation results in new nominal system:
- 142 -
GN ( s ) =
0.1842 0.7 0.7 = ≈ s + 0.2632 3.8s + 1 (1.9s + 1)2
(8.29)
The control design works on the presumption that nominal response should be without first overshoot, i.e. m = 0.2632 , which represent the controller: Cb ( s ) =
QC ( s ) q1s + q0 1.4289 s + 0.3761 = = PC ( s ) s s
(8.30)
and together with the uncertain model (8.24), it produces robustly stable closed-loop characteristic polynomial: p ( s, K , T ) = (Ts + 1) s + K ( q1 s + q0 ) = 2
(8.31)
= T 2 s 3 + T 2s 2 + K ( q1 s + q0 ) + s Finally, the fig. 8.18 depicts resultant control behaviour. 7
w(t), y7(t), u2(t)
6
5
4
3
2 0
10
20
30
40 50 t [s]
60
70
80
90
Fig. 8.18 – Control of airflow speed by regulator (8.30)
- 143 -
8.4. Results and discussion The objective evaluation of quality has been performed by meaning of integrated squared error (ISE) criterion: ∞
ISE = ∫ e(t ) 2 dt
(8.32)
0
The quantification for bulb temperature is expressed in tab. 8.5, which indicates that controllers (8.18) and (8.10) achieve the best results. Nonetheless, the regulator (8.10) generates “less aggressive” actuating signal after step-changes of reference value. On the contrary, controller (8.13) is the worst, moreover with non-minimum phase control behaviour. Not an application of 2DOF structure – controller (8.15) – brings about considerable improvement. It is worth to take notice of problems in control, which emerge during use of identified second order model (8.8) and nominal system (8.12). To tell the truth, a disadvantage of single tuning parameter, causing control design limitation, arises here as the cost for tuning simplicity. Moreover, the control system is theoretically not robustly stable for controllers (8.13) and (8.15) under assumed range of uncertain parameters in controlled plant. Hence, lower order of nominal system (gained via “simpler” identification or model order reduction) can paradoxically result in better performance.
Tab. 8.5 – Outcomes of ISE calculations for bulb temperature Controller
ISE
(8.10) (8.13) (8.15) (8.18) (8.19)
19.2579 370.7898 166.0868 18.8931 28.4738
The values of ISE for airflow speed, shown in tab. 8.6, are quite similar for all three used controllers. In comparison with 1DOF (8.26), 2DOF control structure (8.28) have brought modest reduction of control signals after step changes. However, not a
- 144 -
(8.26) has generated any noticeable overshoot and respective closed-loop behaviour is, from the ISE viewpoint, better. PI controller (8.30) represents a little bit longer settling time owing to tiny undershoot during process of control.
Tab. 8.6 – Outcomes of ISE calculations for airflow speed Controller (8.26) (8.28) (8.30)
ISE 16.0646 21.1741 18.5004
All identification experiments have been accomplished during common working in the research laboratory to ensure subsumption of these operating conditions into the uncertain models. On the other hands, the depicted results of control experiments, especially for bulb temperature, were obtained under “ideal” conditions, e.g. by night or at the weekend, because of comparability of evaluated algorithms. Nevertheless, stability and “acceptable” quality of control responses were successfully tested also during normal operation mode.
- 145 -
9. CONTRIBUTION TO SCIENCE AND PRACTICE The thesis contributes to development of some theoretical aspects of robust control as well as to problems of practical application of these algorithms. In accordance with supra specified aims, it first intends to clarify the classification of mathematical models containing uncertainty. Special attention is paid to systems under parameter variations. The work also purveys the overview of characteristic techniques for robust stability analysis of single parameter (special case), interval, affine linear, multilinear, polynomial and general uncertainty structures. Besides, it briefly outlines the inspection of robust stability for time-delay systems. Moreover, the thesis describes contemporary state of an algebraic synthesis and furthermore formulates and refines a fractional approach to design of SISO continuoustime controllers based on general solutions of Diophantine equations in RPS, YoulaKučera parameterization and conditions of divisibility. Furthermore, it lays the groundwork for nominal and robust tuning of regulators via single scalar parameter m > 0 . The nominal analysis is provided for first order controlled systems and obtained results are utilized also to higher order systems. One of practical outputs is represented by the user-friendly program developed in the environment of MATLAB 6.5.1 + SIMULINK + Polynomial Toolbox. This software incorporates control design for 1DOF and 2DOF control structure, controller tuning, robust stability analysis, simulation procedure, etc. It works with the controlled interval plants and its capabilities are demonstrated on a set of simulation examples. The product is usable both for research and pedagogical purposes. To illustrate utilizability of proposed control laws also for another than parametric uncertainty, the thesis contains several examples aimed to control of systems with periodically time-varying parameters, including time-delay. From the practical realization point of view, the main contribution of the thesis lies in a range of control experiments, which have been done on two selected control loops in laboratory model of hot-air tunnel modelled as systems with parametric uncertainty. The results and subsequent discussion indicate both pros and cones of used synthesis. The interesting thing is especially the existence of the single parameter m, which is
- 147 -
believed to entail tuning simplicity, but which on the other hand causes the constriction in gamut of possible controllers. However, the proposed control design method has finally brought the satisfactory behaviour for control of bulb temperature and also airflow speed. The used control laws have been of standard PI or PID type.
- 148 -
10. CONCLUSION The crucial complication in real control applications is an omnipresent uncertainty and thus it is no wonder that problems of systems under some perturbations have been considered in control theory for decades. Among many approaches, the current practice apparently prefers the usage of one simple cheap off-line controller with fixed parameters which guarantees preservation of essential properties of control loop not only for one, but for the whole family of controlled systems. Such regulators are called robust. This doctoral thesis has been focused on issues of continuous-time robust control under parametric uncertainty. First, it has provided relatively detailed overview of various uncertainty structures and tools for robust stability investigation. In the next parts, the proposed synthesis method based on general solutions of linear Diophantine equations in RPS, Youla-Kučera parameterization of all nominally stabilizing controllers and utilization of divisibility conditions has been described. Moreover, the work has also dealt with additional nominal and robust tuning of controllers via single positive parameter m. The selected algorithms have been implemented into the software product for control design, robust stability analysis and simulation of control process, which has been created in MATLAB, SIMULINK and Polynomial Toolbox environment. The controlled systems are supposed as interval ones. Abilities of the program have been verified on illustrative examples. Besides, the effectiveness of the controllers has been proved also through the set of simulation experiments for time-varying plants with periodically changing parameters. And finally, the practical part of the thesis has shown real identification and control experiments on the laboratory model of hot-air tunnel. To sum up, the responses obtained during closed-loop control of bulb temperature and airflow speed have indicated the simplicity and practical applicability of the algebraic approach.
- 149 -
BIBLIOGRAPHY [1] Ackermann, J., et al.: Robust control – systems with uncertain physical parameters. Springer-Verlag London, Great Britain, 1993. [2] Akcay, H., Gu, G., Khargonekar, P.: A class of algorithms for identification in H∞: continuous-time case. IEEE Transactions on Automatic Control. Vol. 38, No. 2, 1993. [3] Anagnost, J. J., Desoer, C. A., Minnichelli, R. J.: Generalized Nyquist test for robust stability: Frequency domain generalizations of Kharitonov’s theorem. In: Robustness in Identification and Control (Milanese, M., Tempo, R., Vicino, A., eds.), New York, Plenum Press, 1989, pp. 79-96. [4] Anderson, B. D. O., Jury, E. I., Mansour, M.: On robust Hurwitz polynomials. IEEE Transactions on Automatic Control, Vol. AC-32, 1987, pp. 909-913. [5] Åström, K. J., Hägglund, T.: PID Controllers: Theory, Design and Tuning. Instrument Society of America, USA, 1995. [6] Åström, K. J., Hägglund, T.: The future of PID Control. In: IFAC Workshop on Digital Control, Terassa, Spain, 2000. [7] Åström, K. J., Wittenmark, B.: Adaptive Control. Addison-Wesley, Reading, Massachusetts, USA, 1989. [8] Balas, G. J., Packard, A. K., Harduvel, J. T.: Application of µ-synthesis techniques to momentum management and attitude control of the space station. In: AIAA Guidance, Navigation and Control Conference, USA, New Orleans, 1991. [9] Balátě, J.: Automatické řízení. (Automatic control). BEN – technická literatura, Prague, Czech Republic, 2003. (In Czech).
- 151 -
[10] Barmish, B. R., Fu, M., Saleh, S.: Stability of a polytope of matrices; Counterexamples. IEEE Transactions on Automatic Control, Vol. AC-33, 1988, pp. 569-572. [11] Barmish, B. R., Hollot, C. V., Kraus, F. J., Tempo, R.: Extreme point results for robust stabilization of interval plants with first order compensators. IEEE Transactions on Automatic Control, Vol. AC-37, 1992, pp. 707-714. [12] Barmish, B. R.: A generalization of Kharitonov’s four polynomial concept for robust stability problems with linearly dependent coefficient perturbations. IEEE Transactions on Automatic Control, Vol. AC-34, 1989, pp. 157-165. [13] Barmish, B. R.: Invariance of the strict Hurwitz property for polynomials with perturbed coefficients. In: Proceedings of the IEEE Conference on Decision and Control, San Antonio, Texas, 1983. [14] Barmish, B. R.: New Tools for Robustness of Linear Systems, Macmillan, New York, USA, 1994. [15] Bartlett, A. C., Hollot, C. V., Huang, L.: Root locations of an entire polytope of polynomials: It suffices to check the edges. Mathematics of Control, Signals and Systems, Vol. 1, 1988, pp. 61-71. [16] Beale, G.: Constraints on the sensitivity and complementary sensitivity functions. [online]. Lecture notes. [cited January 30, 2007]. Available from WWW: http://ece.gmu.edu/~gbeale/ece_720/limits-on-st-01.pdf. [17] Bhattacharyya, S. P., Chapellat, H., Keel, L. H.: Robust control: The parametric approach, Prentice Hall, Englewood Cliffs, New Jersey, USA, 1995. [18] Bialas, S., Garloff, J.: Convex combinations of stable polynomials. Journal of the Franklin Institute, Vol. 319, 1985, pp. 373-377. [19] Bialas, S.: A necessary and sufficient condition for stability of interval matrices. International Journal of Control, Vol. 37, 1983, pp. 717-722.
- 152 -
[20] Bialas, S.: A necessary and sufficient condition for the stability of convex combinations of stable polynomials or matrices. Bulletin of the Polish Academy of Sciences, Technical Sciences, Vol. 33, 1985, pp. 473-480. [21] Boyd, S., El Ghaoui, L., Feron, E., Balakrishnan, V.: Linear Matrix Inequalities in Systems and Control Theory, SIAM books, Philadelphia, 1994. [22] Chapellat, H., Bhattacharyya, S. P.: A generalization of Kharitonov’s theorem: Robust stability of interval plants. IEEE Transactions on Automatic Control, Vol. AC-34, 1989, pp. 306-311 [23] Dasgupta, S.: Kharitonov’s theorem revisited. Systems & Control Letters, Vol. 11, 1988, pp. 381-384. [24] Djaferis, T. E.: Robust Control Design: A Polynomial Approach. Kluwer Academic Publishers, Boston, 1995. [25] Doyle, C. D., Francis, B. A., Tannenbaum, A. R.: Feedback Control Theory. Macmillan, New York, 1992. [26] Dušek, F., Honc, D.: Využití sériové linky pod MATLABem verze 6. (The use of serial link under MATLAB 6). In: Proceedings of conference MATLAB 2002, Prague, Czech Republic, 2002. (In Czech). [27] Francis, B. A., Zames, G.: On H∞-optimal sensitivity theory for SISO feedback systems. IEEE Transactions on Automatic Control, Vol. AC-29, No. 1, 1984, pp. 9-16. [28] Fu, M., Barmish, B. R.: Polytopes of polynomials with zeros in a prescribed set. IEEE Transactions on Automatic Control, Vol. AC-34, 1989, pp. 544-546. [29] Fu, M., Olbrot, A. W., Polis, M. P.: Robust stability for time delay systems: The edge theorem and graphical tests. IEEE Transactions on Automatic Control, Vol. AC-34, 1989, pp. 813-820.
- 153 -
[30] Gazdoš, F.: Adaptive Control of Nonlinear Multivariable Systems: Plantparameterization Approach. Doctoral Thesis, Faculty of Technology, Tomas Bata University in Zlín, Czech Republic, 2004. [31] Glover, K., Curtain, R., Partington, J.: Realisation and approximation of linear infinite dimensional systems with error bounds. SIAM Journal on Control and Optimization, Vol. 26, No. 4, 1988. [32] Grimble, M. J., Kučera, V.: Polynomial Methods for Control Systems Design. Springer, Berlin, 1996. [33] Gu, G., Khargonekar, P., Lee, E.: Approximation of infinite dimensional systems. IEEE Transactions on Automatic Control, Vol. 34, No. 6, 1989. [34] Gu, G., Khargonekar, P.: Linear and nonlinear algorithms for identification in H∞ with error bounds. IEEE Transactions on Automatic Control, Vol. 37, No. 7, 1992. [35] Henrion, D.: Course on polynomial methods for robust control. [online]. Merida, Venezuela,
2001.
[cited
January
30,
2007].
Available
from WWW:
http://www.laas.fr/~henrion/courses/polyrobust/. [36] Husták, P.: Systémy s dopravním zpožděním a návrh robustních regulátorů pro jejich řízení. (Time-delay systems and design of robust controllers). Doctoral Thesis, Faculty of Technology, Tomas Bata University in Zlín, Czech Republic, 2003. (In Czech). [37] Kharitonov, V. L.: Asymptotic stability of an equilibrium position of a family of systems of linear differential equations. Differential Uraven, Vol. 14, 1978, pp. 2086-2088. Translation in Differential Equations, Vol. 14, 1979, pp. 1483-1485. [38] Kharitonov, V. L.: On a generalization of a stability criterion. Izvestiya Akademii Nauk Kazakhskoi SSR Seria Fizika Matematika, No. 1, 1979, pp. 33-57.
- 154 -
[39] Klán, P., Gorez, R.: Vyvážené nastavení PI regulátorů (Balanced Tuning of PI Controllers). Automa, Vol. 6., No. 4., pp. 49-53, 2000. (In Czech). [40] Klán, P., Honc, D., Jindřich, J.: Nová měřicí jednotka CTRL V3. (New measuring unit CTRL V3). In: Proceedings of conference MATLAB 2003, Prague, Czech Republic, 2003. (In Czech). [41] Kučera, V.: Diophantine equations in control – A survey. Automatica, Vol. 29, No. 6, 1993, pp. 1361-75. [42] Kučera, V.: Robustní regulátory. (Robust controllers). Automa, Vol. 7, No. 6, 2001, pp. 43-45. (In Czech). [43] Ljung, L.: System Identification: Theory for the User. Prentice-Hall, Englewood Cliffs, New Jersey, USA, 1987. [44] Mäkilä, P. M.: Worst-case input-output identification. International Journal of Control. Vol. 56, No. 3, 1992, pp. 673-689. [45] Marden, M.: Geometry of Polynomials. American Mathematical Society, Providence, R. I., 1966. [46] Matušů, R., Prokop, R., Korbel, J.: Analysis and tuning of PI controllers designed through algebraic tools. In: Proceedings of the 6th Asian Control Conference, Bali, Indonesia, 2006, pp. 31-35. [47] Matušů, R., Prokop, R.: Implementation of robust control design for interval systems into user-friendly program. In: Proceedings of 1st International Workshop on Advanced Control Circuits and Systems, Cairo, Egypt, 2005, Paper No. RCS-150. [48] Matušů, R., Prokop, R.: New tuning method for PI controllers based on algebraic approach. In: Proceedings of 15th International Conference on Process Control, Štrbské Pleso, Slovakia, 2005, Paper No. 120.
- 155 -
[49] Mikhailov, A. W.: Method of harmonic analysis in control theory. Avtomatika i Telemekhanika, Vol. 3, 1938, pp. 27-81. [50] Minnichelli, R. J., Anagost, J. J., Desoer, C. A.: An elementary proof of Kharitonov’s theorem with extensions. IEEE Transactions on Automatic Control, Vol. 34, 1989, pp. 995-998. [51] Morari, M., Zafiriou, E.: Robust Process Control. Prentice Hall, New Jersey, USA, 1989. [52] Mori, T., Kokame, H.: Stability of interval polynomials with vanishing extreme coefficients. Recent Advances in Mathematical Theory of Systems, Control, Networks and Signal Processing I, Mita Press, Tokyo, Japan, 1992, pp. 409-414. [53] Packard, A., Doyle, J., Balas, G. J.: Linear, multivariable robust control with a µ perspective. ASME Journal of Dynamic Systems, Measurement and Control, 50th Anniversary Issue, Vol. 115, No. 2b, pp. 310-319, 1993. [54] Peaucelle, D.: SeDuMi Interface. [online]. [cited January 30, 2007]. Available from WWW: http://www.laas.fr/~peaucell/software/SeDuMiInt.html. [55] Polyx: The Polynomial Toolbox. [online]. [cited January 30, 2007]. Available from WWW: http://www.polyx.com/. [56] Prokop, R., Corriou, J. P.: Design and analysis of simple robust controllers. International Journal of Control, Vol. 66, No. 6, 1997, pp. 905-921. [57] Prokop, R., Dostál, P., Prokopová, Z.: Robust linear controllers for unstable systems with time delay. In: Proceedings of 3rd IFAC Symposium on Robust Control Design, Prague, Czech Republic, 2000, pp. 171-176. [58] Prokop, R., Husták, P., Dostál, P.: Robust tracking and disturbance rejection design for time delay systems. In: Preprints of European Control Conference, Porto, Portugal, 2001.
- 156 -
[59] Prokop, R., Husták, P., Prokopová, Z.: Simple robust controllers: Design, tuning and analysis. In: Preprints of 15th World Congress, Barcelona, Spain, 2002. [60] Prokop, R., Husták, P., Prokopová, Z.: Simultaneous regulation and disturbance rejection in a robust sense. In: Preprints of SCI 2001, Orlando, Florida, 2001. [61] Prokop, R., Matušů, R., Prokopová, Z.: Matlab environment for control of timevarying systems. In: Proceedings of 11th Mediterranean Conference on Control and Automation, Rhodes, Greece, 2003. [62] Prokop, R., Mészáros, A.: Design of robust controllers for SISO time delay systems. Journal of Electrical Engineering, Vol. 47, No. 11-12, 1996, pp. 287294. [63] Rantzer, A.: Stability conditions for polytopes of polynomials. IEEE Transactions on Automatic Control, Vol. AC-37, 1992, pp. 79-89. [64] Sánchez-Pena, R., Sznaier, M.: Robust Systems: Theory and Applications, John Wiley & Sons, New York, USA, 1998. [65] Šebek, M., Hromčík, M., Ježek, J.: Polynomial toolbox 2.5 and systems with parametric uncertainties. In: Proceedings of 3rd IFAC Symposium on Robust Control Design, Prague, Czech Republic, 2000. [66] Šebek, M.: Robustní řízení (Robust Control). [online]. PDF slides for the course “Robust Control”, ČVUT Praha, Czech Republic. [cited January 30, 2007]. Available from WWW: http://dce.felk.cvut.cz/ror/prednasky_sebek.html. (In Czech). [67] Sideris, A., Sanchez Pena, R. S.: Fast computation of the multivariable stability margin for real interrelated uncertain parameters. IEEE Transactions on Automatic Control, Vol. AC-34, 1989, pp. 1272-1276. [68] Smutný, L., Škuta, J., Farník, J.: Model teplovzdušného obvodu (Model of hot-air circuit). Technical report to HS 311107 “Technická pomoc při návrhu a zhotovení
- 157 -
modelu teplovzdušného obvodu”, VŠB-TU Ostrava, Czech Republic, 2002. (In Czech). [69] Söderström, T., Stoica, P.: System Identification. Prentice-Hall International, Englewood Cliffs, New Jersey, USA, 1989. [70] Sturm, J. F.: SeDuMi. [online]. [cited January 30, 2007]. Available from WWW: http://sedumi.mcmaster.ca/. [71] Tan, N., Atherton, D. P.: A user friendly toolbox for the analysis of interval systems. In: Proceedings of 3rd IFAC Symposium on Robust Control Design, Prague, Czech Republic, 2000. [72] Tan, N., Atherton, D. P.: Some results on control systems with mixed perturbation. In: Preprints of 15th World Congress, Barcelona, Spain, 2002. [73] The MathWorks: MATLAB and Simulink for Technical Computing. [online]. [cited January 30, 2007]. Available from WWW: http://www.mathworks.com/. [74] Veselý, V., Grman, Ľ.: Problémy a riešenia robustného riadenia lineárnych systémov. (Problems and solutions of robust control of linear systems). Automa, Vol. 9, No. 4, 2003, pp. 54-59. (In Slovak). [75] Vidyasagar, M.: Control system synthesis: a factorization approach. MIT Press, Cambridge, M.A., 1985. [76] Vítečková, M.: Seřízení regulátorů metodou inverze dynamiky (Tuning of controllers by dynamics inversion method). VSB – Technical University of Ostrava, Ostrava, Czech Republic, 2000. (In Czech). [77] Yan, W., Bitmead, R. R., Anderson, B. D. O.: Design problems for sensitivity and complementary sensitivity. Systems & Control Letters, Vol. 15, 1990, pp. 137146.
- 158 -
[78] Zadeh, L. A., Desoer, C. A.: Linear Systems Theory. McGraw Hill Book Co., New York, USA, 1963. [79] Zames, G.: Feedback and optimal sensitivity: model reference transformations, multiplicative seminorms, and approximate inverse. IEEE Transactions on Automatic Control, Vol. 26, 1981. [80] Zames, G.: Functional analysis applied to nonlinear feedback systems. IEEE Transactions on Circuit Theory, Vol. CT-10, 1963, pp. 392-404. [81] Zelinka, I.: Umělá inteligence v problémech globální optimalizace (Artificial intelligence in global optimization problems). BEN – technická literatura, Prague, Czech Republic, 2002. (In Czech). [82] Zhou, K., et al.: Robust and optimal control. Prentice-Hall, New Jersey, USA, 1996.
- 159 -
LIST OF AUTHOR’S RELATED PUBLICATIONS Textbook: Prokop, R., Matušů, R., Prokopová, Z.: Teorie automatického řízení – lineární spojité dynamické systémy. (Automatic control theory – linear continuous-time dynamical systems). Tomas Bata University in Zlín, Czech Republic, 2006, 102 p., ISBN 807318-369-2. (In Czech).
Journal articles: Matušů, R., Prokop, R.: Robustní stabilita systémů s neurčitými parametry. (Robust stability of systems with uncertain parameters). Automatizace, 2007, accepted for publication. (In Czech).
Matušů, R., Prokop, R.: Řízení systémů s periodicky proměnnými parametry pomocí pevných regulátorů. (Control of systems with periodically time-varying parameters via fixed controllers). AT&P Journal, Vol. 13, No. 4, on-line paper id 41, 2006, 5 p., ISSN 1336-233X. (In Czech).
Conference contributions: Matušů, R., Prokop, R.: Design and practical application of simple robust controllers: a parametric approach. In: Proceedings of IEEE Multi-conference on Systems and Control, Singapore, 2007, accepted for publication.
Matušů, R., Prokop, R.: Robust control of uncertain time-delay systems. In: Proceedings of 11th international research/expert conference “Trends in the development of machinery and associated technology”, Hammamet, Tunisia, 2007, accepted for publication.
Matušů, R., Prokop, R., Pekař, L..: Control of systems with periodic time-varying parameters: an algebraic approach. In: Proceedings of the 15th Mediterranean
- 161 -
Conference on Control and Automation, Athens, Greece, 2007, Paper No. T31-008, ISBN 978-96-0254-664-2. Pekař, L., Prokop, R., Matušů, R.: Algebraic control of unstable delayed first order systems using RQ-meromorphic functions. In: Proceedings of the 15th Mediterranean Conference on Control and Automation, Athens, Greece, 2007, Paper No. T19-021, ISBN 978-96-0254-664-2.
Matušů, R., Prokop, R., Vojtěšek, J.: Control of airflow speed in laboratory model of hot-air system with perturbed parameters. In: Proceedings of 16th International Conference on Process Control, Štrbské Pleso, Slovakia, 2007, Paper No. 132, ISBN 978-80-227-2677-1. Vojtěšek, J., Dostál, P., Matušů, R.: Multifunctional process control teaching system PCT40. In: Proceedings of 16th International Conference on Process Control, Štrbské Pleso, Slovakia, 2007, Paper No. 115, ISBN 978-80-227-2677-1.
Matušů, R., Prokop, R., Vašek, V.: Factorization approach to control design – utilization for systems with parametric uncertainty. In: Proceedings of the Fourth IASTED International Conference on Circuits, Signals, and Systems, San Francisco, USA, 2006, pp. 341-346, ISBN (Hardcopy) 0-88986-605-8, (CD) 0-88986-607-4.
Matušů, R., Prokop, R., Korbel, J.: Analysis and tuning of PI controllers designed through algebraic tools. In: Proceedings of the 6th Asian Control Conference, Bali, Indonesia, 2006, pp. 31-35, ISBN 979-15017-0.
Matušů, R., Prokop, R., Dostálek, P.: Robust stability of systems with complicated uncertainty structure. In: Proceedings of 10th international research/expert conference “Trends in the development of machinery and associated technology”, Lloret de Mar, Spain, 2006, pp. 1499-1502, ISBN 995861730-7.
Matušů, R., Prokop, R., Vašek, V.: Robust stability analysis for polynomials with nonlinear uncertainty structure. In: Annals of DAAAM for 2006 & Proceedings of the
- 162 -
17th International DAAAM Symposium, Vienna, Austria, 2006, pp. 243-244, ISBN 3901509-57-7, ISSN 1726-9679.
Matušů, R., Prokop, R.: Význam intervalových neurčitostí v teorii a praxi řízení procesů. (Importance of interval uncertainties in theory and practice of process control). In: Proceedings of papers of the 7th international conference Control of Power & Heating Systems 2006, Zlín, Czech Republic, 2006, Paper No. P53, ISBN (Proceedings of annotations) 80-7318-409-5. (In Czech).
Matušů, R., Prokop, R., Vojtěšek, J.: Single tuning parameter in algebraic control design. In: Proceedings of the 7th International Scientific-Technical Conference Process Control 2006, Kouty nad Desnou, Czech Republic, 2006, Paper No. R012, ISBN 80-7194-860-8. Vojtěšek, J., Dostál, P., Matušů, R.: Effect of co- and counter-current cooling in tubular reactor. In: Proceedings of the 7th International Scientific-Technical Conference Process Control 2006, Kouty nad Desnou, Czech Republic, 2006, Paper No. R020, ISBN 80-7194-860-8.
Matušů, R., Prokop, R.: User-friendly MATLAB program for control and robust stability analysis of systems with parametric uncertainties. In: Proceedings of the 13th Mediterranean Conference on Control and Automation, Limassol, Cyprus, 2005, pp. 1487-1492, ISBN 0-7803-8937-9.
Matušů, R., Prokop, R.: Implementation of robust control design for interval systems into user-friendly program. In: Proceedings of 1st International Workshop on Advanced Control Circuits and Systems, Cairo, Egypt, 2005, Paper No. RCS-150, ISBN 0-150-6310-7933-2.
Matušů, R., Prokop, R., Korbel, J.: Algebraic approach to design and tuning of PI controllers for higher order systems. In: Annals of DAAAM for 2005 & Proceedings of the 16th International DAAAM Symposium, Opatija, Croatia, 2005, pp. 245-246, ISBN 3-901509-46-1, ISSN 1726-9679.
- 163 -
Prokop, R, Korbel, J., Matušů, R.: PI autotuners based on biased relay identification. In: Preprints of the 16th IFAC World Congress, Prague, Czech Republic, 2005, Paper No. 2115, ISBN 0-08-045108-X. Prokop, R, Korbel, J., Matušů, R.: Relay-based autotuning: a second order algebraic design. In: Proceedings of IEEE International Symposium on Intelligent Signal Processing, Faro, Portugal, 2005, ISBN 0-7803-9031-8.
Matušů, R., Prokop, R.: New tuning method for PI controllers based on algebraic approach. In: Proceedings of 15th International Conference on Process Control, Štrbské Pleso, Slovakia, 2005, Paper No. 120, ISBN 80-227-2235-9.
Matušů, R., Prokop, R.: Systems with parametric uncertainties – robust control and stability analysis. In: Proceedings of the 23rd IASTED International Conference on Modelling, Identification, and Control, Grindelwald, Switzerland, 2004, Paper No. 412-127, pp. 19-24, ISBN 0-88986-387-3, ISSN 1025-8973.
Matušů, R., Prokop, R.: Uncertain systems close to the stability border – control and analysis from the robustness viewpoint. In: Proceedings of 12th Mediterranean Conference on Control and Automation, Kusadasi, Turkey, 2004, Paper No. 1065.
Matušů, R., Prokop, R., Sysel, M.: Control of systems with time-varying delay. In: Annals of DAAAM for 2004 & Proceedings of the 15th International DAAAM Symposium, Vienna, Austria, 2004, pp. 279-280, ISBN 3-901509-42-9, ISSN 17269679. Prokop, R., Matušů, R., Prokopová, Z.: Matlab environment for control of timevarying systems. In: Proceedings of 11th Mediterranean Conference on Control and Automation, Rhodes, Greece, 2003, Paper No. IV 01-06, ISBN 960-87706-1-0, (Book of Abstracts – ISBN 960-87706-0-2).
Matušů, R., Prokop, R.: Robust control and analysis of continuous-time dynamic systems with interval uncertainty. In: Annals of DAAAM for 2003 & Proceedings of the
- 164 -
14th International DAAAM Symposium, Sarajevo, Bosnia and Herzegovina, 2003, pp. 291-292, ISBN 3-901509-34-8, ISSN 1726-9679. Sysel, M., Matušů, R., Bobál, V.: Recursive system identification using delta models. In: Annals of DAAAM for 2003 & Proceedings of the 14th International DAAAM Symposium, Sarajevo, Bosnia and Herzegovina, 2003, pp. 455-456, ISBN 3-90150934-8, ISSN 1726-9679.
Matušů, R., Prokop, R.: Matlab toolbox for automatic control design and simulation of time-varying systems. In: Proceedings of 14th International Conference on Process Control, Štrbské Pleso, Slovakia, 2003, Paper No. 047, ISBN 80-227-1902-1. Prokop, R., Matušů, R., Prokopová, Z.: Analysis and control of time-varying systems close to the stability border. In: Proceedings of 14th International Conference on Process Control, Štrbské Pleso, Slovakia, 2003, Paper No. 020, ISBN 80-227-1902-1.
Matušů, R.: Aplikace robustních algoritmů při řízení systémů s periodicky perturbovanými parametry. (Application of robust algorithms to control of systems with periodically perturbed parameters). In: Proceedings of XXVIII Seminary ASR'03 Instruments and Control, Ostrava, 2003, pp. 213-224, ISBN 80-248-0326-7. (In Czech).
Lectures (unpublished): Matušů, R.: Analýza a syntéza regulačních obvodů v podmínkách neurčitosti. (Analysis and synthesis of control loops under conditions of uncertainty). Invited lecture – program Kontakt, Slovak University of Technology in Bratislava, Faculty of Chemical and Food Technology, Department of Information Engineering and Process Control, Bratislava, Slovakia, 5/12/2006. (In Czech).
Matušů, R.: Algebraic approach to design of control systems under conditions of uncertainty. Socrates/Erasmus lecture, University of Strathclyde, Department of
- 165 -
Electronic and Electrical Engineering, Industrial Control Centre, Glasgow, United Kingdom, 8/9/2005.
Matušů, R.: Design and tuning of robust controllers for interval systems. Invited lecture, Politecnico di Milano, Dipartimento di Elettronica e Informazione, Milano, Italy, 25/6/2004.
Matušů, R.: Návrh spojitých robustních regulátorů v okruhu RPS a jejich aplikace při řízení systémů s neurčitostmi. (Design of continuous-time robust controllers in RPS and its application to control of systems with uncertainties). Invited lecture, Czech Technical University in Prague, Faculty of Electrical Engineering, Department of Control Engineering and Center of Applied Cybernetics, Prague, Czech Republic, 4/12/2003. (In Czech).
- 166 -
AUTHOR’S CURRICULUM VITAE Personal and contact data: Name: Radek Matušů Date and place of birth: 31/12/1978, Zlín, Czech Republic Nationality: Czech Address: Dlouhá 4213, 76001 Zlín, Czech Republic Marital status: single Telephone: +420576035261 E-mail:
[email protected]
Education: 2002 – present: TBU in Zlín, Faculty of Applied Informatics, Doctoral degree (Ph.D.), branch: Technical Cybernetics. 1997 – 2002: TBU in Zlín, Faculty of Technology, Master’s degree (Ing. – M.Sc. equivalent), branch: Automatization and control technology in consumer goods industry. 1993 – 1997: Tomas Bata Business Academy, Zlín, branch: Marketing.
Work experience: 2006 – present: Research worker, Department of Automation and Control Engineering, Faculty of Applied Informatics, TBU in Zlín. 2006: Lecturer, Department of Automation and Control Engineering, Faculty of Applied Informatics, TBU in Zlín. 2004 – 2005: Lecturer, Institute of Process Control and Applied Informatics, Faculty of Technology, TBU in Zlín.
Pedagogical activities: 2002 – 2006: Teaching of TBU seminars and laboratory courses on subjects such as Basics of Computer Technology and Informatics, Automatic Control Theory I and II, and Optimization; Assistance at lectures and examinations.
- 167 -
2005 – present: Supervising of master (4 defended) and bachelor (10 defended) theses in TBU in Zlín. 2006: Member of committee for final state exams in bachelor study programme Engineering Informatics, branch Automatic Control and Informatics.
Short-term attachments abroad: 2006: Slovak University of Technology in Bratislava, Slovakia. 2005: University of Strathclyde, Glasgow, United Kingdom. 2004: Politecnico di Milano, Italy.
Language knowledge: Czech – mother tongue English – active (writing, reading, speaking, listening) German – passive
Grant participation: 2005 – present: Research grant MSM 7088352102 Modelování a řízení zpracovatelských procesů přírodních a syntetických polymerů (Modelling and control of natural and synthetic polymer processing) – co-participant. 2006 – present: The sixth EU framework research project IST-027168 Innovative, inclusive, interactive & intercultural learning campus (iCamp) – co-participant. 2006 – present: Research project KONTAKT 50/112 Progresivní metody robustního a adaptivního řízení procesů s přestupem tepla a hmoty (Progressive methods of robust and adaptive control for processes with heat and mass transfer) – co-participant.
Other related activities: Contribution reviewer for 2007 IEEE Multi-conference on Systems and Control. Member of DAAAM Young Researchers’ and Scientists’ International Committee for 2006. Member of organizing committee of the 7th international conference Control of Power & Heating Systems 2006 (not stated in proceedings but confirmed in writing).
- 168 -
Doctoral Thesis to obtain Philosophiæ Doctor (Ph.D.) degree Robust Control of Systems with Parametric Uncertainty: An Algebraic Approach Robustní řízení systémů s parametrickou neurčitostí: algebraický přístup Ing. Radek Matušů
Published by Tomas Bata University in Zlín Printing: 10 coppies This publication has not been neither edited nor linguistically corrected. Year of publishing: 2007