of topology is common in networks. Network planners [6] advise use of a serial T1 (1.544 Mbit/s) or E1 (2 Mbit/s) link between a LAN and the border gateway.
Router Response to Traffic at a Bottleneck Link Marcos Paredes-Farrera, Martin Fleury and Mohammed Ghanbari Department of Electronic Systems Engineering University of Essex, United Kingdom Email: {mpared,fleum,ghan}@essex.ac.uk
Abstract— Traffic at varying bit rates, packet lengths and packet rates are passed across a bottleneck link. The router response is determined, especially the onset of instability due to excessive CPU load. The paper concludes that it is primarily packet rate that governs the router response. The results are relevant to multimedia streaming applications.
I. I NTRODUCTION This paper presents a measurement study designed to find what metric best determines the router transfer and forwarding response, focusing upon the critical region when the router response, given a fixed-size output queue, becomes unstable due to an excessive CPU load. A testbed approach is employed to stress the video stream as it passes through typical routers working at the limits of their performance range. The intention is to identify potential problems that a video stream will encounter, with a view to guiding the design of a streaming application. A set of experiments, varying the bit rate, the packet length and the packet rate across a bottleneck link, determine router CPU load. Of course, the bottleneck link represents the tight link on an Internet path, often found at the boundary between network core and local LAN. It was found that packet rate seems to be the significant metric and not, as might be supposed, input bit rate or packet length. Optimal packetization schemes are of great interest [1] to the designers of video streaming applications. As video and audio packets are often closely spaced, loss correlation is a more serious problem for video streaming than for other applications [2], for which losses may appear as essentially random [3]. Though video inter-packet spacing is similar to audio (averaging around 30 ms) video packets vary in length. Video bandwidths can clearly be much higher than other flows [4], which is a problem if the video traffic takes up a sizeable proportion of the bandwidth across a tight link. Video delivery should avoid regimes that result in significant packet losses at the router queues. However, it is the case [5] that streaming applications often do send a bursty stream, either for reasons of coding efficiency or when a none real-time operating system falls behind its schedule and releases a packet burst. The remainder of this paper is organized as follows. Section II describes the simple network testbed employed and the experimental methodology. Section III contains the experimental results and an analysis of their implications. Finally, Section IV presents the main findings from this research.
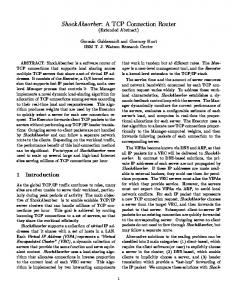
II. E XPERIMENTAL SCENARIO A. Network testbed Fig. 1 shows the network topology employed to test the routers’ response. Two Cisco 2600 routers are interconnected with a 2 Mbit/s serial link and the border links (to the Linux router and receiver) with a 100 Mbit/s Ethernet link. Clearly, the bottleneck link is located in the 2 Mbit/s serial link between the two Cisco routers. To aid replication of the network set-up, the most relevant devices configuration details and Quality-ofService (QoS) policy settings are given in Table I. This type of topology is common in networks. Network planners [6] advise use of a serial T1 (1.544 Mbit/s) or E1 (2 Mbit/s) link between a LAN and the border gateway. Network-to-satellite links share the same topology, though with greater serial link latency. The queue size settings are typical for Ethernet links. For traffic response testing a traffic “sender” computer was used to host the stgr traffic generator. stgr is a traffic generator originating as part of the network simulator NCTUns [7] but now employed on a live network. [8] is a case study describing the use of stgr. A Linux router monitors the traffic introduced into the section under test. A “receiver” computer monitors and stores output traffic from the Cisco router. The CPU processing load was obtained in both Cisco routers by using the command “show processes cpu” The command option “Cpu utilization for one minute” was selected. It is desirable to monitor for shorter periods of time than one minute. However, that is the minimum possible for this Cisco router model. The traffic injected into the
Ethernet 100 Mbps
Sender
Ethernet 100 Mbps
Linux Router Monitoring
Cisco Routers
Router A
Serial Router B 2 Mbps
Ethernet 100 Mbps
Receiver Monitoring
Fig. 1. Basic network testbed employed to model the effect of a bottleneck link on an Internet path with Cisco routers
routers will affect the router CPU load and therefore the traffic forwarded. Router A will work as a traffic shaper by receiving high-speed traffic from the 100 Mbit/s link and then limiting the traffic in the 2 Mbit/s serial link. In order to reduce the traffic rate, the router must drop any excessive packets, usually at its output queue, as this is where the bandwidth restrictions occur. On the other hand, Router B
TABLE I N ETWORK COMPONENT SETTINGS
Fast FIFO 100 1500 B Linux kernel V. 2.4.9
Routers Model Cisco 2600 Software 12.2(13a) version Queue FIFO policy Queue in 75, out 40 length MTU 1500 B
will act as a border router, receiving the forwarded traffic from router A, which will not exceed the 2 Mbit/s serial link rate. Therefore, it is expected that the router B will be less affected by the traffic created in the probes. The test events were synchronized with the ag agent program and monitored with tcpdump and analyzed with tcpflw. ag agent and tcpflw are in-house software, described in [9]. B. Testing methodology The proposed methodology is to send 2 minute UDP Constant Bit Rate (CBR) traffic probes from the receiver, through the two Cisco routers and finally to the receiver. Every probe has a fixed Packet Length (PL) and constant Packet InterArrival Time (PIAT). A grid of probes was formed with PL values of 65, 90 130,1200 and 1500 byte (B); and PIAT = 1x10⁻⁴ , 2x10⁻⁴ . . . 9x10⁻⁴ , 1x10⁻³ , 2x10⁻³ . . . 1x10⁻¹ s (making a total of 30 different PIAT). This results in a grid of 5 x 30 probes. The CPU load is taken for one minute from when each probe is first received. The purpose of this test is to find: • The network traffic conditions when the router becomes unstable by observing the CPU load under different conditions: PIAT, PL, and bit rate. • The router optimal performance (reducing the packet loss and the router CPU load) by finding the most friendly traffic conditions. III. R ESULTS 1) Effect of bit rate on the Cisco Router:- Fig. 2 presents the CPU load response to the varying bit rate with different PL. From these graphs three regions were found. In the case of a PL of 65 B, there is a “stable” region ranges between 0 and 2 Mbit/s bit rate, when the reported CPU load approaches 72%; an “unstable” region ranges from just over 2 Mbit/s to about 3 Mbit/s, ending when the reported CPU load decreases from the 72% level; and a “highly unstable region” starts when the “unstable” region ends to the bottom line in the right side of the curve. Other PLs display a similar behavior, but the onset of router instability is delayed. The three regions were observed for each of the PL tested, and all the curves have similar shapes. For
CPU Load (Percentage)
Queue policy Queue length MTU OS
Linux Machines Pentium IV 1.7 GHz Intel Pro 10/100
65 bytes 90 Bytes 130 Bytes 1200 Bytes 1500 Bytes
80 70 60 50 40 30 20 10 0 0
2
4 6 Rate(1E6 bit/s)
8
10
(a) 100
CPU Load (Percentage)
CPU NIC
90
65 bytes 90 Bytes 130 Bytes 1200 Bytes 1500 Bytes
80
60
40
20
0 0
0.5
1 1.5 Rate(1E6 Bit/s)
2
2.5
(b) Fig. 2. Cisco router CPU load response with differing PL at varying bit rate: (a) Router A, (b) Router B
example the unstable region for selected PL commence at: PL (65 B) = 2.5 Mbit/s, PL(130 B) = 4.2 Mbit/s and PL(1500 B) = 46 Mbit/s. Router B, Fig. 2b, presents a similar behavior beyond a bit rate of 2 Mbit/s. When the traffic reaches 2.2 Mbit/s, with a PL of 65 B, the router reaches a CPU load of 66%. The “stable region” is when the router does not have any problems and delivers packets, discards packets and schedules all internal processes at the desired time. The “unstable region” occurs when the router is overwhelmed by the traffic load. As the routing process has high priority, some processes, such as the ”statistics” process, report a slowdown. The “highly unstable region” represents a total slowdown of all processes including routing and the CPU load is incorrectly reported. Therefore, there is no actual reduction in CPU load as the recorded results imply. For constant PIAT, the onset of router instability is linked to the PL, with the smaller the PL the earlier the occurrence of instability. 2) Packet rate effect on Cisco Routers.- Fig. 3 shows the CPU load response to the packet rate with different PLs. In the graphs, the three regions are again found for each PL curve.
IV. C ONCLUSION 90
65B 90B 130B 1200B 1500B
80 CPU Load(percentage)
70 60 50 40 30 20 10 0 0
1
2
3
4 5 6 Rate(1E3 packet/s)
7
8
9
4
4.5
(a) 80
65 bytes 90 Bytes 130 Bytes
70 60
Percent
50 40 30 20 10 0 0
0.5
1
1.5
2 2.5 1E3 packet/s
3
3.5
(b) Fig. 3. Cisco router CPU load response, with different PL, at varying packet rates: (a) Router A, (b) Router B
However, the curves share almost the same starting points for the three regions. For example, the unstable region starts in: PL (65 B) = 4290 packet/s, PL (130 B) = 4092 packet/s, and PL (1500 B) = 3925 packet/s. This clearly implies that packet rate, not PL, principally determines the onset of instability. Fig. 3b shows the CPU load on Router B. Each curve represents a small portion of the stable region curve shown in Fig. 3a. For example, the PL (130 B) curve ends at about the 2000 packet/s point. This sudden halt represents the limit imposed by the serial link’s bandwidth restriction, 2000 packets with 130 B PL represents a bit rate of 2.08 Mbit/s. 3) Packet Loss response on the two Cisco routers.- Fig. 4 presents the packet loss versus packet rate with different PLs. Packet loss starts when the maximum bandwidth available in the serial link is reached. As a result, one can observe that each curve starts at the equivalent packet rate for the corresponding PL at the 2 Mbit/s level. Fig. 4b depicts the packets lost in relation to the bit rate. From this graph, one can see that traffic composed of smaller packets increases to a high degree the number of packets that are lost. On the other hand, larger packets decrease the number of packets lost. This is because PIAT is constant and, hence, packet rate varies with PL.
The CPU load response on typical (Cisco 2600) routers has been measured to determine how bit rate, packet length, and packet rate effect the router’s response. The router has to forward or discard packets as necessary. An increase in the packet rate will certainly mean an increase in the router CPU load. The traffic characteristics determine the router’s CPU load and hence: • The router CPU load response is largely related to the packet rate and not to the PL or bit rate. • In the experiments, after the 4000 packet/s point the router become unstable for the router configuration . • The best traffic conditions were found when the PL was larger, PL (1500 bytes) for standard Ethernet frames, because larger packets require smaller packet rates to transmit data. Therefore, PL indirectly affects CPU load in the sense that for constant PIAT, the packet rate will be higher for small PLs. However, for varying PIAT, it is the packet rate that is critical. This is no doubt due to the buffer slot allocation policy within the Cisco 2600 router, which is based on packet number rather than byte size. As access to the router software is restricted, these results are intuitive, in the sense that the cause of the response is not positively identified. However, while the results presented are specific to the bottleneck and router configuration, the set of experiments were extensive, as every curve in the graphs represents a group of 30 independent experiments, trying to map all the possible traffic conditions in the router. What is interesting is that a result was obtained that was repeatable for each test. As in most practical situations, the multimedia stream will not form the only packets traversing the bottleneck link, the aggregate packet rate should be carefully monitored. R EFERENCES [1] M. Paredes-Farrera, M. Fleury, M. Mbise, and M. Ghanbari, “Best packetization scheme for H.263 internet video communication,” Electronic Letters, vol. 40, no. 23, pp. 1476–1478, 2004. [2] M. Yajnik, J. Kurose, and D. Towsley, “Packet loss correlation in the Mbone multicast network,” in Global Internet conference, 1996. [3] A. K. Aggrawala and D. Sanghi, “Network dynamics: An experimental study of the Internet,” in IEEE Conference on Global Communication (GLOBECOM), 1992, pp. 782–786. [4] H. Schulzrinne, “IP networks,” in In Compressed Video over Networks, M.-T. Sun and A. R. Reibmen, Eds. Marcel Dekker, New York, 2001, pp. 81–138. [5] R. Rejaie, “On integration of congestion control with Internet streaming applications,” in PacketVideo workshop, 2003. [6] S. Kieffer, W. Spicer, A. Schmidt, and S. Lyszyk, “Planning a data center,” Network System Architects, Inc., Denver, CO, Tech. Rep., 2003. [7] S. Y. Wang, C. L. Chou, C. H. Huang, C. C. Hwang, Z. M. Yang, C. C. Chiou, and C. C. Lin, “The design and implementation of the NCTUns 1.0 network simulator,” Computer Networks, vol. 42, no. 2, pp. 175–197, 2003. [8] M. Paredes-Farrera, M. Fleury, and M. Ghanbari, “Precision and accuracy of network traffic generators for packet-by-packet traffic analysis,” in 2nd International IEEE/Create-Net Conference on Testbeds and Research Infrastructures for the Development of Networks and Communities, 2006. [9] M. Paredes-Farrera, “Packet-by-packet analysis of video traffic dynamics on IP networks,” Ph.D. dissertation, University of Essex, UK, 2005.
65 bytes 90 Bytes 130 Bytes 1200 Bytes 1500 Bytes
10
65 bytes 90 Bytes 130 Bytes 1200 Bytes 1500 Bytes
12
Loss(1E3 packet/s)
Rate(1E3 packet/s)
12
8 6 4 2
10 8 6 4 2
0
0 0
1
2
3
4 5 6 7 Loss(1E3 packet/s)
(a) Fig. 4.
8
9
10
0
10
20
30
40 50 60 Rate(1E6 bit/s)
(b)
Cisco router packet loss response with different PL at varying:(a)bit rate and (b)packet rate
70
80
90