Routing and Relay Node Placement in Wireless Sensor Networks Powered by Ambient Energy Harvesting Zhi Ang Eu NUS Graduate School for Integrative Sciences and Engineering, National University of Singapore
[email protected] Abstract - Energy consumption is an important issue in the design of wireless sensor networks which typically rely on nonrenewable energy sources like batteries for power. Recent advances in ambient energy harvesting technologies have made it a viable alternative source of energy for powering wireless sensor networks perpetually. In this paper, we optimize network performance by finding the optimal routing algorithm and relay node placement scheme for wireless sensor networks powered by ambient energy harvesting. We evaluate the performance of three different variants of geographic routing algorithms and consider two relay node placement schemes, viz. uniform string topology and a cluster string topology. The performance metrics are network throughput (T), goodput (G), source sending rate (SR), efficiency (η), data delivery ratio (DR) and hop count (H). Simulation results obtained using the Qualnet simulator show that there is an optimal combination of routing algorithm and relay node placement scheme that maximizes the required performance metric. These results aim to provide insights into the impact of routing algorithms and relay node placement schemes on wireless sensor networks that rely solely on ambient energy harvesting for power.
Hwee-Pink Tan, Winston K. G. Seah Networking Protocols Department, Institute for Infocomm Research, A*STAR {hptan, winston}@i2r.a-star.edu.sg hop communications are required, by investigating the impact of routing algorithms and relay node placement strategies. Our work is motivated by the following questions which arise from realistic deployment scenarios (cf: Section IV): 1) Between a uniform and cluster string topology, which relay node placement topology will deliver better performance? 2) For a given relay node placement scheme, what routing algorithm will maximize performance for a given number of relay nodes and average energy harvesting rate? Our main performance metric is goodput (G), which is the rate of unique data packets received by the sink from the source node. Other performance metrics of interest include source sending rate (SR), throughput (T), efficiency (η), data delivery ratio (DR) and hop count (H).
Keywords – ambient energy harvesting, routing algorithm, relay node placement, wireless sensor networks
I.
INTRODUCTION
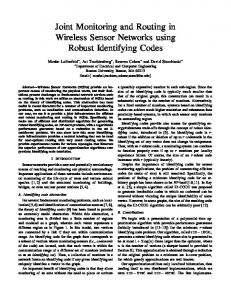
Much research on wireless sensor networks (WSNs) have focused on extending the lifetime of WSNs which are assumed to rely on finite and non-renewable energy sources like batteries for power. In contrast, WSNs Powered by Ambient Energy Harvesting (which we refer to as WSN-HEAP in this paper) are more useful and economical in the long-term as they can operate for very long periods of time until hardware failure because ambient energy can be harvested from the environment perpetually. Examples of ambient energy sources include solar, mechanical (strain or vibration), heat and wind. Therefore, WSN-HEAP present promising solutions for solving the energy constraints of WSNs. Moreover, WSNHEAP use supercapacitors instead of batteries as energy storage devices, thereby providing virtually unlimited recharge cycles for perpetual deployment. However, as the rate of charging is usually much lower than the rate of energy consumption for the sensor nodes, WSN-HEAP nodes can only be awake for a short period of time before it needs to shut down in order to recharge. Moreover, the time taken to charge up the sensor varies due to environmental factors. Fig. 1 shows the salient difference in the energy models of batteries versus energy harvesting devices. Our main contribution is to study and identify the optimal network performance conditions of WSN-HEAP when multi-
Fig. 1. Characteristics of Energy Sources
II. RELATED WORK Most sensors used in WSNs today rely on limited and nonrenewable energy sources like batteries to operate. Recent advances in ambient energy harvesting technologies have made it possible for sensors to rely on energy harvesting devices [1-3] for power. Since batteries have limited recharge cycles, supercapacitors with virtually unlimited recharge cycles are an attractive option for use in such WSNs to replace batteries because they can operate perpetually without the need for replacement. Some examples of WSN-HEAP have been deployed in testbeds. For example, in [4], 557 solarpowered motes have been used to evaluate robust multi-target tracking algorithms. Other solar-powered sensor network testbeds are illustrated in [5-6]. There are also commercially available sensor motes which rely on ambient energy harvesting for power. The devices developed by Microstrain [7] harvest and use energy from two sources, viz. solar and mechanical energy. To date, none of these efforts address issues related to the networking aspects of WSNs. Instead, the focus is on improving the efficiency and viability of the energy harvesting method. Furthermore, most of the reported work focused on harvesting energy to supplement battery
power while we focus on using the harvested energy as the only energy source, which is a more viable solution for longterm sensor network deployments.
transmitted by the sensor nodes as long as the sink lies within the transmission range of the sensor and there is no collision due to two or more concurrent transmissions by the sensors.
III. ENERGY MODELS OF WSN-HEAP NODES
IV. NODE PLACEMENT SCHEMES FOR WSN-HEAP In this paper, we consider the network performance of WSN-HEAP with one source node, n relay nodes and one sink. We let x be the distance between the source and sink, and d be the maximum transmission range of a node. We evaluate two different node placement schemes, viz. uniform string topology and cluster string topology.
WSN-HEAP are very useful in applications where sensors cannot be easily accessible or replaceable after deployment, and the replenishment of the exhausted on-board power source like batteries is not feasible. Furthermore, power sources like batteries are inappropriate in some applications due to environmental concerns and the risk of battery leakage. Examples of such applications include sensors for structural health monitoring [8-10] where sensors are embedded into buildings and structures. We consider a multi-hop WSNHEAP deployment that comprises three different types of nodes: relay, source and sink nodes. A. Relay Node The role of the relay nodes is to forward data packets from the source nodes to the sink. Relay nodes are required when the source node is not within direct communication range of the sink. When the relay node receives any data packet in the receive state, it would buffer the data packet and schedule it for possible transmission at the end of the receive period. Initially, the relay node is uncharged. It will transit into the receive state when the node is fully charged. If a node has a packet to transmit at the end of the receive period, then it will transmit the data packet when it senses that the channel is clear. Otherwise, it will go into the charging state until it is fully charged to Ef and the whole cycle repeats itself. The energy model is illustrated in Fig. 2 and the state transition diagram is shown in Fig. 3.
A. Uniform String Topology In the uniform string topology, n relay nodes are placed uniformly between the source and the sink at an inter-node distance of x/(n+1) as illustrated in Fig. 4. An example is that of a railway track monitoring system where sensor nodes with vibrational energy harvesters are placed uniformly along the track to detect wear-and-tear and breakages.
Fig. 4. WSN-HEAP in uniform string topology for railway track monitoring
B. Cluster String Topology Driven by application requirements, it is not always desirable to deploy sensor nodes uniformly across a deployment area. For example, in bridge monitoring as illustrated in Fig. 5, nodes have to be deployed in clusters to monitor the stability of the beams supporting these structures. WSN-HEAP is also very useful in monitoring remote structures where maintenance costs are prohibitively high. An example is the Thailand-Burma railway in which it is constructed over mountains, therefore making it difficult to access the bridge to replace any battery-operated sensor nodes.
Fig. 2. Energy Model
Fig. 3. State transition diagram for the relay node
B. Source Node The source node is similar to the relay node except that if it does not receive any packet in the receive period, it will send its own data packet in the transmit period. Each new data packet has an unique ID for every source node. The state transition diagram for the source node is the same as the relay node as shown in Fig. 3. C. Sink The sink is connected to power mains, so it does not need to be charged. Therefore, the sink would receive any data packet
Fig. 5. WSN-HEAP in cluster string topology for monitoring remote bridges such as Thailand-Burma railway
In the cluster string topology, n relay nodes are divided into y clusters placed uniformly between the source and sink as shown in Fig. 6. We assign one node in the leftmost cluster to
be the source. To minimize interference, any node in one cluster is only within communication range of the next immediate cluster/sink. Therefore, x 2x −1 ≤ y < −1. d d In our study, we set the number of clusters to be x/d where x is a multiple of d. We also ensure that the number of nodes in each cluster is the same by choosing suitable values of n in our simulations.
Fig. 6. Cluster String Topology
V. ROUTING ALGORITHMS FOR WSN-HEAP Since the wakeup timings of the sensor nodes cannot be predicted accurately because charging the nodes is dependent on environmental factors, it is not possible for a node to know the number or the identity of neighbors who are in receive state when a node is ready to transmit. However, each node knows its own location which is either preprogrammed into the node or obtained using a localization algorithm. Therefore, in this paper, we adopt three variants of broadcast-based geographic routing protocols suited for WSN-HEAP. A. Geographic Routing (GR) In Geographic Routing (GR), any sensor node that is nearer to the sink than the sender has to rebroadcast the packet. When a relay node receives a data packet in the receive period, it will first store the packet in the buffer. At the end of the receive period and if the channel is clear, the packet at the head of the queue in the buffer will be transmitted. The flowchart for GR is illustrated in Fig. 7. B. Geographic Routing with Duplicate Detection (GR-DD) Geographic Routing with Duplicate Detection (GR-DD) is similar to GR, except that when a sensor node receives a data packet from a node/cluster further away from the sink than it is, it will determine whether it has received a similar data packet previously: If so, it will discard the duplicate packet
Fig. 7. Flowchart for GR routing protocol
received; otherwise, it will store the newly received data packet in the buffer. The flowchart for GR-DD is illustrated in Fig. 8. C. Geographic Routing with Duplicate Detection and Retransmission (GR-DD-RT) In Geographic Routing with Duplicate Detection and ReTransmission (GR-DD-RT), when a relay node receives a data packet from a node/cluster further away from the sink than it is, it will perform duplicate detection similar to GRDD. However, it differs from GR-DD by always retransmitting the last transmitted packet when there is no new packet in the buffer to transmit. The buffer is modified such that there is an additional space to store the last retransmitted packet. Therefore, in GR-DD-RT, a node always transmits at the end of the receive period if the channel is clear. The flowchart for GR-DD-RT is illustrated in Fig. 9. VI. PERFORMANCE ANALYSIS We let the size of a data transmission (including all headers) be s bits and the transmission rate of the sensor be α kbps. The time (in ms) taken to transmit one data packet is t tx = s / α . The receive time, trx must be more than ttx since the wakeup timings of the nodes cannot be synchronized into time slots. In this study, we set trx to be the duration of two transmission periods. The hardware turnaround time, which is the time for the node to change from receive to transmit state, is denoted by tta. We denote the energy required in the receive state by Erx, the energy required to transmit a data packet by Etx, the energy required to change from receive to transmit state by Eta and the energy of a fully charged node by Ef. We let the receive and transmit power of the sensor be Prx and Ptx respectively. Therefore, we have Erx = Prxtrx , Etx = Ptxttx ,
Prx + Ptx tta , 2 E f = Erx + Eta + Etx .
Eta = and
The energy harvesting rate is not constant because it depends on environmental factors such as the placement of sensor and weather conditions.
Fig. 8. Flowchart for GR-DD routing protocol
Fig. 9. Flowchart for GR-DD-RT routing protocol
In this paper, we assume that the average energy harvesting rate is β mW and the charging time is exponentially distributed. The linear charging process is shown to simplify the diagrams in Fig. 2. We do not assume that the charging process is linear in our simulations. We use the Qualnet [11] network simulator to derive the performance metrics. We have also referred to the specifications of MICAz sensor mote [12] manufactured by Crossbow Technology Inc. to compute the transmit and receive power. We consider the power consumption of two components of the sensor node which are the processor and the RF transceiver as these two components account for most of the power needed for the sensor node. We assume that the power required to maintain the buffer is negligible compared to transmit and receive power. For the MICAz sensor mote, the current draw for the processor is 8mA. The current draw for the RF transceiver is 19.7 mA and 17.4 mA for receiving and transmitting respectively at maximum transmit power. The assigned variable values are shown in Table I. TABLE I. VALUES OF VARIOUS VARIABLES USED IN SIMULATION Parameter Value d 100m n ranges from 10 to 240 Prx 83.1mW Ptx 76.2mW s 800 bits trx 6.4 ms ttx 3.2 ms tta 0.192 ms x 500m y 5 α 250 kbps Simulation Time 1000 seconds
The performance metrics which we consider in this study and their definitions are summarized in Table II.
TABLE II. PERFORMANCE METRICS Performance Metric Description Source Sending Rate (SR) Rate of data packets sent by the source Throughput (T) Rate of data packets (including duplicate packets) received by the sink Goodput (G) Rate of unique data packets received by sink Data Delivery Ratio (DR) Ratio of G to SR Efficiency (η) Ratio of G to T Hop Count (H) Average number of transmissions required from source to sink
In our simulations, we consider two different scenarios.
A. Scenario 1 with Varying number of Relay Nodes The first scenario assumes that the average energy harvesting rate, β, is fixed at 10mW and we vary the number of relay nodes, n. The results for this scenario are shown in Fig. 10. Some data points are not plotted for low values of n because no packets are received by the sink. The source sending rate (SR) varies because the source node will only transmit at the end of a receive period after it senses that the channel is clear. This is done to minimize collisions. GR-DDRT reduces the number of packets that can be sent by the source because of increased transmissions by the source’s neighbors compared to GR and GR-DD. Based on the number of packets sent by the source, a cluster relay node placement scheme performs better than the uniform relay node placement scheme. This is because nodes in a cluster do not retransmit packets received from other nodes in the same cluster, thereby reducing channel contention, so the source is able to send more packets due to reduced channel utilization. Next, we consider the throughput (T) of the network. The throughput of the network is defined as the rate of data packets, including duplicate packets, received by the sink. Based on the results obtained, GR-DD-RT performs the best. This is expected because all the nodes will always attempt to transmit a packet (either a new packet or the last retransmitted packet) at the end of the receive period.
Fig. 10. Performance analysis of WSN-HEAP using different number of relay nodes
The throughput metric is not a good performance metric in this study as it includes the duplicate packets which are of no value to the sink. Therefore, we consider goodput (G), which is defined as the rate of unique packets received by the sink. At low deployment density, GR-DD-RT with cluster relay node placement scheme performs the best. However, beyond a certain threshold density, GR-DD with cluster relay node placement scheme outperforms the rest of the schemes. This clearly shows that the choice of the routing algorithm and relay node placement scheme is crucial in optimizing the performance of WSN-HEAP for different values of n. The data delivery ratio (DR) is the ratio of goodput to sending rate. This metric computes the probability of a packet being delivered to the sink for every packet transmitted by the source node. We can observe that the cluster relay node placement scheme outperforms the uniform relay node placement scheme for various variants of geographic routing. We consider efficiency which is the ratio of goodput to throughput. It can also be described as the probability of a received packet being a unique packet when received by a sink. Although GR-DD-RT gives good goodput at low density deployment, the efficiency of GR-DD-RT is very low. Once again, GR-DD with the cluster relay node placement scheme outperforms all the other protocols in most cases. Lastly, we consider hop count which is the average number of packet transmissions before the packet reaches the sink. The hop count for cluster relay node deployment scheme is fixed. The hop count for the uniform relay node deployment scheme increases as the number of relay nodes increases due to higher interference arising from more transmissions.
B. Scenario 2 with Varying Energy Harvesting Rates The second scenario assumes that the number of relay nodes is fixed. Therefore, the aim is to find the optimal energy harvesting rate, and therefore a suitable energy harvester to
use such that the network performance is optimized. We fixed the number of relay nodes and vary the average energy harvesting rate, β, from 2mW to 20mW. Due to space constraints, we only illustrate the simulation results for 100 relay nodes in Fig. 11 and the simulation results for 200 relay nodes in Fig. 12. Unlike scenario 1 where SR decreases with increasing n, SR increases with larger values of β because the average charging time required is reduced. However, the rate of increase decreases because of increased contention. In terms of throughput, GR-DD-RT with uniform relay node placement scheme performs the best for different values of β. For moderate energy harvesting rates, GR-DD with cluster relay node placement gives the highest goodput, data delivery ratio and efficiency.
C. Analysis From Figs. 10-12, we can provide some insights into the impact of relay node placement schemes on performance. The uniform node placement scheme gives higher throughput in some scenarios and therefore higher channel utilization. However, this does not always translate into higher goodput and in many scenarios the cluster relay node placement scheme provides higher goodput. The average number of hops in the uniform relay node placement scheme can be up to twice the average number of hops in the cluster relay node placement scheme. This means that more retransmissions are required in a uniform relay node placement scheme than a cluster relay node placement scheme. In addition, we can infer that duplicate detection (GR-DD and GR-DD-RT) improves efficiency (η) and reliability (DR) because this reduces the number of redundant transmissions. Retransmission (GR-DD-RT) is only useful with low energy harvesting rates or with low number of relay nodes.
Fig. 11. Performance analysis of WSN-HEAP using different energy harvesting rates for 100 relay nodes (n=100)
Fig. 12. Performance analysis of WSN-HEAP using different energy harvesting rates for 200 relay nodes (n=200)
From the simulation results of both scenarios, it is possible to form a decision matrix as shown in Fig. 13 to determine the routing protocol and relay node placement strategy to use in order to maximize goodput. It is clear that there is no single combination that works best under all scenarios and therefore choosing the correct combination is essential to obtaining the best performance. In general, GR-DD is better in most scenarios except when the energy harvesting rate or the number of relay nodes is low, then GR-DD-RT should be used. Furthermore, cluster relay node placement scheme is preferred. Cluster Cluster GR-DD GR-DD Medium Cluster Cluster GR-DD GR-DD Low Cluster Cluster GR-DD-RT GR-DD Medium High Increasing number of relay nodes Fig. 13. Decision Matrix for Goodput (x-axis denotes the number of relay nodes while y-axis denotes the energy harvesting rate)
Increasing energy harvesting rate
High
Cluster GR-DD Cluster GR-DD-RT Cluster GR-DD-RT Low
VII. CONCLUSION In this paper, we have analyzed the impact of routing algorithms and relay node placement schemes on network performance in wireless sensor networks powered by ambient energy harvesting. From the performance results, there is no specific node placement scheme or routing algorithm that performs best under all scenarios. Our results show that there is an optimal number of relay nodes that optimizes goodput for any energy harvesting rate. Similarly, there is an optimal energy harvesting rate that optimizes goodput for a fixed number of relay nodes. For future work, we are developing analytical models to determine the optimal number of nodes or the optimal energy harvesting rate to deploy under different scenarios.
REFERENCES [1] J. A. Paradiso, and T. Starner, “Energy Scavenging for Mobile and Wireless Electronics”, IEEE Pervasive Computing, Vol. 4, No. 1, 2005, pp.18-27. [2] V. Raghunathan, S. Ganeriwal, and M. Srivastava, “Emerging Techniques for Long Lived Wireless Sensor Networks”, IEEE Communications Magazine, Vol. 44, No. 4, April 2006, pp. 108-114. [3] F. I. Simjee, and P. H. Chou, “Efficient Charging of Supercapacitors for Extended Lifetime of Wireless Sensor Nodes”, IEEE Transactions on Power Electronics, Vol. 23, No. 3, May 2008, pp. 1526-1536. [4] P. Dutta, J. Hui, J. Jeong, S. Kim, C. Sharp, J. Taneja, G. Tolle, K. Whitehouse, and D. Culler, “Trio: Enabling Sustainable and Scalable Outdoor Wireless Sensor Network Deployments”, in Proc. of the 5th International Conference on Information Processing in Sensor Networks (IPSN), April 2006, pp. 407-415, Nashville, TN, USA. [5] P. Sikka, P. Corke, P. Valencia, C. Crossman, D. Swain, and G. BishopHurley, “Wireless Adhoc Sensor and Actuator Networks on the Farm”, in Proc. of the 5th International Conference on Information Processing in Sensor Networks (IPSN), April 2006, pp. 492-499, Nashville, TN, USA. [6] P. Corke, P. Valencia, P. Sikka, T. Wark, and L. Overs, “Long-Duration Solar-powered Wireless Sensor Networks”, in Proc. of the 4th Workshop on Embedded Networked Sensors (EmNets 2007), June 2007, pp. 33-37, Cork, Ireland. [7] Microstrain, http://www.microstrain.com. [8] W.-J. Wu, Y.-F. Chen, Y.-Y. Chen, C.-S. Wang, and Y.-H. Chen, “Smart Wireless Sensor Network Powered by Random Ambient Vibrations”, in Proc. of the IEEE International Conference on Systems, Man, and Cybernetics, Oct 2006, pp. 2701-2708, Taipei, Taiwan. [9] V. A. Kottapalli, A. S. Kiremidjian, J. P. Lynch, E. Carryer, T. W. Kenny, K. H. Law, and Y. Lei, “Two-tiered wireless sensor network architecture for structural health monitoring”, in Proc. of the SPIE’s 10th Annual International Symposium on Smart Structures and Materials, Mar 2003, San Diego, CA, USA. [10] G. Park, C. R. Farrar, M. D. Todd, W. Hodgkiss, and T. Rosing, “Energy Harvesting for Structural Health Monitoring Sensor Networks”, Technical Report, Los Alamos National Laboratory, February 2007. [11] Qualnet Network Simulator 4.5, http://www.scalable-networks.com. [12] MICAz sensor mote specifications, available from http://www.xbow.com.