Larroulet, Cristian. "Chile's Economic Growth: Key Reforms to Development." The
. Heritage Foundation. N.p., 15 Oct. 2013. Web. 20 Nov. 2013.
Running Header: DEVELOPMENT TRAJECTORIES
! ! ! ! ! ! ! ! ! ! ! ! ! ! ! ! ! ! ! ! !
Development Trajectories: Explaining growth and progress in Brazil and Chile
The New School
Mildred Ferrer
! ! ! ! ! !
N00341839
!1
Running Header: DEVELOPMENT TRAJECTORIES
!2
Introduction: Present Day, Chile v. Brazil
Development should be understood, for the purpose of this paper, as the social condition
within a country, in which the authentic necessities of the population are satisfied, through the rational and sustainable use of resources and natural systems. Moreover, this general definition of development includes the assumption that all social groups have access to institutions, and basic public services such as education, housing, health, and above all, that the traditions and culture are respected within the social framework of a Nation-State.
Chile is a country that has served as a case of the economic advancement which all
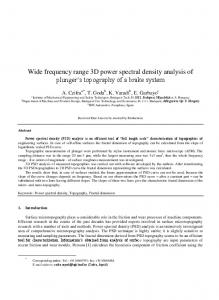
South American countries could realize; while socially, topographically, and institutionally not the same as the rest, it has, undoubtedly, had an advancing developmental trajectory. The Latin American nation has a GDP of $325.8 billion and a population of 17.2 million. Chile’s centerright government has attempted to make practical development a necessity, and by it has been attaining it. The nation upholds open strategies in the social, economic and political fields since the 1980s that have driven its unfaltering development, poverty rate diminishment, and the molding of a representative government. Chile has seen steady increase in its income per capita, and today, it is the highest in the region, as shown in Figure 1. Being the only South American nation to be accepted into the OECD (2010), Chile is closer than ever to realizing its mission to build a social order where its people have the ability to reach a life of nobility and without destitution.
GDP per capita (constant 2005 US$) 10000
Chile
Brazil
7500 5000 2500 0 1980 1982 1985 1988 1991 1994 1997 2000 2003 2006 2009 2012
Meanwhile, Brazil is a giant among its modest sized neighbors, the biggest economy of
the South American continent, and one of the most unequal. With a GDP of $2.394 trillion, and a population of approximately 198.7 million, Brazil’s development does not quite measure up to
Running Header: DEVELOPMENT TRAJECTORIES
!3
the size of its economy. The country is preparing to throw two big parties; it will be the host of both the 2014 World Cup and the 2016 Summer Olympics. The world will be watching, and to make sure they like what they see, the government will inject approximately 30 billion reais ($13 billion) into its economy for tournament identified ventures.
Ironically, acknowledging that the titan country has birthed a high percentage of the most
amazing superstars of “the beautiful game”, the actuality of what it implies for a large number of Brazilians, in developmental terms, is a long way from energizing. Riots have sparked over different urban communities, as educators, understudies, and laborers, have all been part of indications of discontent, chiefly expecting that hosting the World Cup is pushing consideration far from the true issues that the nation confronts in areas such as housing, education, inequality, political corruption, and a fizzling healthcare system. Indeed, a tremendous 26% of Brazilians accept that the nation ought not host the World Cup in light of the fact that public spending that goes into the donning occasion is unreasonable, particularly acknowledging that all social necessities are not being totally satisfied. (Datafolha, 2013). However, the government insists on putting forth the plans to host the events, which is not surprising given that the Brazilian interests have long been represented by the well off rather than by the lower income population.
There is a marked contrast in Brazil and Chile’s current GDP per capita, the former being
$5721 and the latter leading in South America at $9440 (World Bank Database, 2013). In 2009, both countries had negative rates of GDP per capita annual growth, Chile -2%, Brazil -1%. Since then, Chile saw an 8% growth rate in 2010, and has maintained a steady rate of 5%. Brazil had the same 8% annual growth, vacating the economic crisis in 2009, it experienced one of the quickest financial recuperations in the region, yet has been growing gradually since, presently just at a 2% rate.
This paper aims to break down and verify any reasonability or need thereof the
development inclines in Brazil and Chile in the previous five decades, including metrics of social mobility, education, health, income, political participation, and how these have affected the growth trajectories of these two South American nations. Will Chile be the first South American nation to achieve developed status? If so, what policies have allowed for such development? How does the history of the two countries explain where they are today? Will Brazilian economy be overheated by hosting two consecutive mega-events, and what will that mean for future growth?
Running Header: DEVELOPMENT TRAJECTORIES
!4
! Trajectories and growth determinants: Colonization and Factor Endowments
Some features influencing advancement trajectories are the geography of a country,
provincial experiences, and factor endowments. These variables can either push or obstruct social, political and economic organization. Chile and Brazil have sought after development for over a century. In the case of Chile, various presidents and other national pioneers, have hoped to convert Chile into a nation without destitution, with high economic prosperity and human advancement. However, despite historical efforts, achieving development resulted a difficult task for Chilean leaders, who encountered structural deterrents that appeared to be exceptionally challenging to change. A few illustrations of these impediments were Chile’s remote geographic area, its long terrain, and a lot of times, even Chilean society. Since early in their development stages, both Brazil and Chile’s economies have heavily relied on commodity trading. Brazil’s trading included horticultural merchandise, such as coffee and sugar, as well as timber, while Chile exploited its mineral rich soil, becoming dependent on the fare of copper and some agrarian products. Former Brazilian president Luiz Ignacio Lula da Silva’s government sought to increase benefits from state investments in areas such as infrastructure, industrialization and education. It also increased manufacturing exports and trade which has proved beneficial to Brazil’s more recent trends of rapid growth.
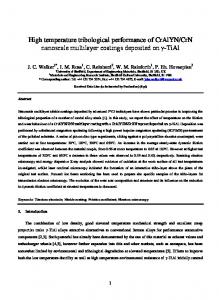
Poverty headcount ratio at national poverty line (% of population) Brazil
32
Chile
24
16
8
0
2000
2003
2005
2006
2007
2008
2009
2011
Figure 2 - Source: World Bank Database, 2013
Many scholars have been concerned with the differences in economic development of the
continent. The United States and Canada, for example, have been more successful than
Running Header: DEVELOPMENT TRAJECTORIES
!5
economies in Latin America; the divergence in the paths that each region has taken can be attributed to the ability of the US and Canada to maintain steady growth rates in the eighteenth and nineteenth century, whereas Latin America could not establish a steady growth rate until a century after. Many theories have emerged in explaining these trajectories, the most relevant is that the difference in wealth, human capital, and political power can be attributed to the factor endowments of the respective colonies, a trend that has persisted throughout time. (Engerman and Sokoloff, 2002).
Brazil was colonized by Portugal, while Chile, like the majority of Latin America was
colonized by the Spaniards. The critical importance of history is evident; present day distribution of land can be explained by making reference to the history of colonization, just as much as present-day racial inequality in Brazil can be traced back to slavery. Engerman and Sokoloff describe three different types of colonies, the first, colonies with climates and soils that were well suited for the production of sugar and other highly valued crops, characterized by extensive scale economies associated with the use of slaves. This first category describes the condition of Brazil; with a great presence of African slaves that efficiently worked the large plantations, giving way to the still present unequal distribution of wealth and human capital.
Chile’s punctual early dependence on agribusiness, mineral mining, and especially copper, succumbs to a second category described by the authors, one with a high native population, dominated by European colonizers, and marked by substantial natural resources in the form of metal. The provision of cheap labor by the indigenous, made it highly profitable to concentrate on mining.
Todaro & Smith’s (2008) dependency theory explains the situation that both Brazil and
Chile faced, heavily relying on the export of commodities for economic development, which proved beneficial to boost the initial conditions of the economies, but the same dependency left them under the control of international prices, constantly declining. In the past 50 years, both countries have seen an increase in wellbeing, in terms of GDP per capita. Brazil, for example, has transitioned from dependence on export of primary commodities and more into the manufacturing sector. Chile’s dependence on copper has been beneficial to the economy in times when copper prices are high. However, an economy so heavily dependent on one sector, such as is the case of Chile and copper, would benefit from diversification of its industries, which would
Running Header: DEVELOPMENT TRAJECTORIES
!6
not be an easy task for the government, being that regulations on mining would have to be put in place to allow the growth of any smaller industry.
Poverty, Income and Inequality
Poverty
The patterns of poverty reduction in Chile and Brazil are noteworthy. The last few
decades have been of significant importance in this matter, in fact, not only for these two nations, but for many South American countries as well1. As shown in Figure 2, both countries have
managed a reduction of poverty headcount; Chile’s rates are lower than Brazil in general terms, however, Brazil has steadily reduced its rate as well, nearly 10% in the last 5 years. It is important to note that Chile reached a low of 13.7% poverty rate in 2006; an important benchmark for the country, whose percentage of population living in poverty when its first national poverty census was conducted in 1986 was a soaring 45%. While Brazil did not see poverty increments during the economic contraction of 2009, Chile’s poverty rate slightly increased by almost 2%. However, the country was able to regain a downward trend again in the last two years.
Inequality
For Chile, it could be said that the situation of inequality is not as dire as it could be,
keeping in mind that the country has been, for the past century, highly unequal. In fact, both countries have seen positive development trends in terms of reduction of inequality and poverty. Of the OECD countries, Chile has the highest level of inequality (as per the GINI coefficient), falling behind Mexico (.48) and its neighbor, Argentina (.46), with a coefficient of .52 in 2009. A high rate of the GINI coefficient denotes a high level of inequality in a country. Between 1974 and 1985, the levels of inequality rose from .46 to .61. However, this could be an occurrence of the transition into a model based on economic freedom. Since then, however, inequality levels have decreased slowly, and in comparison to other countries in the region, are still extremely high. Reduction of inequality in Chile has been targeted through reduction of educational gaps. An increase in enrollment from 200,000 in the mid 80s, to more than a million in present-day. This approach is backed up by Birdsall and Londoño’s evidence that a more equal distribution of
1
According to World Bank Data, Chile, Brazil and Uruguay are the three South American nations with the lowest levels of poverty headcount. However, the trends show a significant reduction of poverty in all the region, where in most countries poverty headcount has been reduced on average to a half of what it used to be 10 years ago.
Running Header: DEVELOPMENT TRAJECTORIES
!7
education could write off inequality of income as a factor affecting growth. The chilean trend shows a slow but steady decrease in inequality, a rise in mean income, and a reduction in poverty. However, earlier trends of unequal access to education perpetuated the uneven distribution of income.
As shown in Figure 3, Brazil, while having high GINI coefficient in the past two decades,
it starting to show declining GINI scores, showing progress toward a more equal society. However, for an economy of its size and its middle income status, the scores are not consistent. In 1989, Brazil saw the highest level of inequality in its recent history; and the highest at the time, at least of the available data, followed by Guatemala with a score of 60. On average, in Latin America the richest 20 percent of households are more than ten times richer than the poorest 20 percent. Moreover, in Brazil, the richest households are more than twenty-five times richer than the poorest (Birdsall, 2001).
Inequality is furthered by the tax system in Brazil, which affects mostly the population
with lower spending power. The Institute of Applied Economic Research (Instituto de Pesquisa Econômica Aplicada, IPEA), produced data that shows how taxes are levied on products thus contributing to social inequality, because taxes are regressive; they are collected by the business who supplies the products, and therefore included in the price that is paid by the consumer. The federal sales tax, the contribution to welfare financing, and the state tax on goods and services are all added to the overall cost of products.
Racial composition & Institutions of Brazil and Chile
Brazil has seen more challenges in overcoming racial inequalities. The ethnic
composition of the country is more divided than that of Chile. Included in Engerman and Sokoloff’s report, the racial composition of Spanish America, including Chile in the 1930s was 35.5% white, while today approximately 95.4% of the Chilean population identifies themselves as white, making Chile’s racial composition today very similar to that of the US and Canada in the 1930s (CIA Factbook). The relevance of the racial composition in the development of institutions is again, tied to Engerman and Sokoloff’s theory of factor endowments leading to growth or hinder thereof. Brazil’s racial composition, having a high percentage of black and native population, can be attributed to the early colonial period and the presence of slave labor. Brazil has made great efforts towards lessening inequalities, and more recently has set out to ensure basic social services to the more impoverished, a group which coincidentally is
Running Header: DEVELOPMENT TRAJECTORIES
!8
disproportionally conformed of blacks and mulattos. While these efforts cannot be ignored, the country still has much room for improvement in this area, as it remains one of the most unequal in the region.
Government accountability and freedom to have a political voice are factors which play a
role in determining a society’s equity. While it is an aspect that does not necessarily tell the whole story of the strength of institutions, it is quite relevant in analyzing said strength. Brazil’s majority has, since long ago, seen difficulty in the procurement of an inclusive voting system. Since early in the century, the government limited the participation in elections by placing regulations for voting, such as literacy requirements, which evidently favored the higher classes. Chile on the other hand only has put in a place a literacy requirement, and unlike Brazil has a system where the ballot is secret. Many Latin American countries have difficulties with their election processes, especially, on ensuring transparency and fairness.
Economic Structures
Chile’s economy is Latin America’s most market friendly. In the current presidential
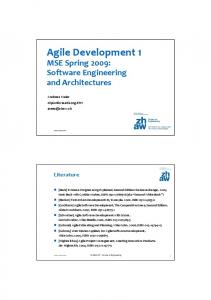
term, the government seems to be focusing on economic growth driven by freedoms. However, for the past century, at least, both countries have sought to engage in policy responses that will GDP annual growth rate (%)
Brazil
Chile
14 10.5 7 3.5 0 -3.5 -7 -10.5 -14
1965 1968 1971 1974 1977 1980 1983 1986 1989 1992 1995 1998 2001 2004 2007 2010
Figure 4 - Source: World Bank Database, 2013
generate growth. The development of import substitution industries in Latin America came as a result of the dubiety created by the Great Depression. As Baer (1972) notes, ISI was an attempt to break away from using proceeds from primary commodity exports for the purchases of imported manufactures. Many countries adopted the ISI model, including Brazil and Chile,
Running Header: DEVELOPMENT TRAJECTORIES
!9
which hoped to be able to compete with bigger economies. The purpose of transitioning to ISI, was to establishing industries in the countries that had normally been imported from other nations, implementing regulations that would allow taxation of imports as to protect the newly created industries. However, while ISI was effective at achieving its purpose, without further regulations the model proved unsustainable. This is especially true in the case of Chile, dependent on mining, which required the use of machinery and equipment whose importation was being taxed highly, resulting in a significant drop in profits.
ISI proved further unsustainable when, in the decade of the 60s and well into the 70s the
benefits of ISI were stagnant in many nations, which, according to Palma (2003) was the reason for an increase in revolutionary reforms that led to the political polarization in the different countries. While Chile was more negatively affected by the lack of reforms and policies to sustain ISI, Brazil, according to Rodrick (2007) had a better experience post ISI. In 1964, economic stagnation was followed by market reforms and Brazil started integration of export led industries. In 1975, under Augusto Pinochet, Chile’s economy saw a significant decline in GDP growth as shown in Figure 4. Prior to 1975, however, both Brazil and Chile’s economy show relatively healthy growth. The economic crisis in 1982 resulted in Chile’s sharpest economic contraction in the past 30 years, going from a 4.7% annual growth in 1981 to a -10.3% in 1982 (World Bank Database, 2013). The same is true for Brazil, though, the contraction did not represent the high percentage it did in Chile, instead Brazil saw a decline in economic growth earlier than Chile, going from a 9.1% annual growth in 1980 to a -4.3 in 1981, then saw a year of recovery in 1982 and again a fall in 1983 before growth resumed. For Chile, Pinochet’s conservative market reforms made the economy stall before growth resumed. The implementation of the market reforms, thus, was not initially beneficial; stabilization began after 1975, post ISI economic reforms and 1985, post economic crisis.
Industries
Brasil developed one of the most advanced industrial sectors in the region, and today
competes globally in industries that other Latin American countries have not been able to develop, such as the automotive industry. Brazil saw benefits from ISI, which helped build the industrial sector that drives the economy of the country today; production is not limited to automobiles, but varies from computers, to textiles, consumer durables and even aircraft. Brazil
Running Header: DEVELOPMENT TRAJECTORIES
!10
has decreased its reliance on primary commodity exports, which include lumber, tin and petrochemicals.
As mentioned before, Chile remains highly dependent on copper exports, today, it
represents 19% of the total revenues (CIA Factbook, 2013). Both countries have opened their markets to international trade in the past decades, which has contributed to economic growth. However, for Brazil, for example, it has also contributed to higher levels of unemployment. Having adopted neoliberal market reforms more slowly than Chile, the country has seen increased job loss as a result of foreign competition brought on by increased trade (Figure 5). Trade patterns are similar, however, Chile’s trade percentage post ISI reforms has been considerably higher than Brazil’s, and also OECD states. With the increase of the percentage of tarde, Chile has seen a decline in unemployment (Figure 6), opposite of the case of Brazil.
In order for Chile’s growth to be sustainable, though, the country must seek to diversify
its economy, for a sharp fall in copper prices would prove catastrophic for its economy. As mentioned earlier, the diversification of an economy such as Chile’s, where there is such high dependence on one commodity, requires very strict controls of the mining sector, in order to allow for infant industries to develop and contribute significantly to the economic growth of the Trade and Unemployment in Brazil Unemployment, total (% of total labor force)
10
22.5
7.5
15
5
7.5
2.5
0
1970 1973 1976 1979 1982 1985 1988 1991 1994 1997 2000 2003 2006 2009 2012
0
Figure 5 - Source: World Bank Database, 2013
Trade and Unemployment in Chile 90
Trade (% of GDP)
Unemployment, total (% of total labor force)
20
67.5
15
45
10
22.5
5
0
1970 1973 1976 1979 1982 1985 1988 1991 1994 1997 2000 2003 2006 2009 2012
Figure 6 - Source: World Bank Database, 2013
0
Value Axis
30
Trade (% of GDP)
Running Header: DEVELOPMENT TRAJECTORIES
!11
country. The difficulty for Chile is related to its adoption of more neoliberal reforms, in comparison to Brazil, who has implemented free market reforms in a more gradual way. Brazil has seen a combination of growth and reduction of inequality, contrary to notions proposed by theories of trade-offs.
Public Social Expenditure
Education is one of the dimensions that is deemed essential for the growth and progress
of a nation. In that respect, Brazil’s allocation towards education has been generally higher than that of Chile. Moreover, while Brazil initial inequality and poverty levels have been generally high, the country is beginning to see positive changes through investment in health and education that will be invaluable for the sustainability of growth, and will especially have a positive impact on the more marginalized. Chile’s public social expenditures in health and education have been gradually signified great progress for the country’s development. In 1980, life expectancy at birth was 69 years, today, that number has been increased by 10, matching life expectancy of the United States. Infant mortality has been reduced significantly as well, from 33.9/1000 in the 80s, to 8.4/1000 today.
Public Spending on Education, total (% of GDP)
Health Expenditure, public (% of GDP) Chile
4.4
Brazil
3.3
4.5
2.2
3
1.1
1.5
0
1993
1996
1999
2002
2005
2008
Figure 7 - Source: World Bank Database, 2013
6
2011
0
Chile
Brazil
1993 1995 1997 1999 2001 2003 2005 2007 2009 2011
Figure 8 - Source: World Bank Database, 2013
A lot of the pillars of prosperity introduced in Chile, were done so under a military
regime, which made especially important the process of democratization as a solidification, legitimization, and strengthening of the measures that led to this prosperity. Paradoxically, while
Running Header: DEVELOPMENT TRAJECTORIES
!12
Chile has seen increased wellbeing of its population, it has also seen a rise in protests, especially by students in 2011. While previous Chilean governments had emphasized a lot of reforms to promote growth in the country, public spending on education had been left aside, and this can be seen in Figure 8, where starting in 2002 there was a steady decline in public spending on education, and the same is true for health expenditures. Brazil, on the other hand was increasingly spending more in these two sectors.
In the past decade, educational reforms that were needed, such as improved quality,
access to and funding of the educational system, were not enacted. One of the main demands of the student protests in 2011 was access to totally free higher education. This would mean that the chilean government would have to fund education entirely through taxes. A 2013 study concludes that this would be a bad policy implementation, since it would highly benefit the wealthy segments of society, defeating the fundamental principle of targeted public spending (Larroulet, 2013). The same sector has pressed for the consideration of ending privately funded education in Chile, again, this would be regressive implementation. If the provision of education is left entirely in the hands of the state, important elements of progress found in education would like be reduced, these include freedom of choice, creativity and innovation incentives, and diversity of viewpoints.
Development Outlook: Brazil
The investment needed, in order for a developing economy to have the capacity to host a
mega-event, for example The World Cup and the Summer Olympics, is sold to the general population as a driver of development; as though it will guarantee income that will have positive repercussions for improvement with the building of roads, stadiums, tourism, and so forth However, history does not back this hypothesis up. For a nation that does not presently rely on the foundation to have said occasions, this means the utilization of many sections of urban land to prepare stupendous stadiums. Japan and South Korea co-hosted the soccer competition in 2002, furnishing 10 stadiums each, most which were newly built to fulfill the demands of the occasion, at an expense of approximately $2 billion (FIFA, 2002). Today, these state of the art venues, much as the ones Brazil has underway, have transformed into white elephants; they are underused, consuming important urban land, that won't be accessible for additional beneficial use for at least a few decades, and taking a toll on taxpayers, costing billions of yen every year in upkeep costs.
Running Header: DEVELOPMENT TRAJECTORIES
!13
The amount of capital investment that the games demand, is a high risk for Brazil’s
roaring economy; it could result in high levels of inflation, which is already a high 6%, and lowquality construction. In 2012, hoping to boost growth, Dilma Rousseff’s administration implemented a somewhat expansionary monetary policy that has failed to stimulate growth. (CIA Factbook, 2013). If Brazil had very high unemployment rates and excess capacity, this kind of stimulus spending could be helpful to its economy. In circumstances as such, expansionary fiscal policy could create jobs and raise demands for good and services, thus promoting economic growth. However, unemployment is not a concern to Brazil’s economy at this point, as they have a country-record low of 5.5% rate. Reducing inequality should be the highest priority for the Brazilian government; and participating as the host of the mega-events could potentially further hinder inequality reduction, not to mention the risk of overheating the economy, which, economic theory warns, could be the result of undertaking major long-term infrastructure investment under the conditions of an economy such as Brazil’s. Wage inflation, shoddy work, and the use of low quality materials are only a few of the potential problems Brazil could face under the severe time pressure to finalize preparations for the events.
Another aspect to consider in Brazil’s future, during and post mega-events, is that
depending on the performance of the country during the time, the tourism industry, considering Rio is the most visited city in the southern hemisphere, could be negatively affected. While the event will undoubtedly attract a galore of sports fans, it is difficult to say if people will respond by being frightened away by high crowding and price climbs. Taking into account that the first of the two events is upon us, and that construction projects, relocation of the population of favelas that surround the adjacent areas to where stadiums are planned be erected, have not yet started, the risk is of monumental proportion. Brazil might never recover the massive investment for hosting the 2014 World Cup and 2016 Summer Olympics. By avoiding the allurements of gigantism in its construction projects, keeping tabs, instead, on base upgrades that will serve the nation’s economic development, making use of existing sports facilities, and involving local communities in the planning process, Brazil could maximize the probability that the events will not create a financial and political burden in the coming years.
The Outlook: Chile
Unlike Brazil’s gigantic economy, Chile is a smaller scale one. During the past two
decades, Chile has taken positive, efficient steps towards development. Chile has been benefitted
Running Header: DEVELOPMENT TRAJECTORIES
!14
by the recently adopted economic model, where great reliance lies in the strength of the private sector, it has implemented policies concerned with the marginalized sector, and has developed a stable and representative democratic system. The decade had a downturn, as the capacity to lead in those key reform implementation was ineffective. However, the economic balance in the past years has been relatively positive. During the world economic crisis, Chile doubled its growth, exports have increased to 40%, representing $80,000 million. In inequality and development, Chile has performed positively as well, achieving record low poverty rates, and growth of the middle class. In order to continue its good performance, Chile will need to deepen its liberal economic model, as it is what has worked in the nation. As aforementioned, Chile will need to develop infant industries and diversify its economy in order to stay afloat in case of drops in prices of copper.
Conclusion
Both Brazil and Chile’s recent performance in terms of development has been
noteworthy. While the countries could definitely be doing much better, they have gradually progressed the wellbeing of their societies. Given the trajectories and histories of both nations, there are mistakes to learn from. Brazil, for example, would highly benefit from work on strengthening economic and political institutions, which are presently very weak. Moreover, the giant nation will need to implement policies that are targeted to reduce inequality among the poorest, more marginalized sectors of society, this is true for Chile as well. Chile has been admitted to the OECD in 2010, which is a result of at least two decades dedicated to reform policies conducive to progress. A key factor of the progress Chile has achieved has been the development of its current economic model, which has sought to strengthen the private sector and move towards a more representative and democratic system. However, the earthquake that hit Chile, the 6th most devastating in recorded history, was a great challenge for the country. Chile proved its capability to overcome such obstacle, by committing to the reconstruction of damages caused by the 2010 earthquake.
While many theories can be applied to the development of these two South American
nations, there is not one single cookie-cutter recipe that proves to have worked and explain their paths of development. Thus, both have work to do in terms of bettering some indicators of development. Brazil would benefit from reducing restrictions within its electoral system, making the political atmosphere more approachable and desirable to the general population, and should
Running Header: DEVELOPMENT TRAJECTORIES
!15
emphasize on the reduction of unemployment which has seen an increase with higher percentages of trade. The country will have a great opportunity at its hands with the investment being made for hosting the mega-events aforementioned, but needs to be careful not to overheat its economy and cause endless negative repercussions in its future growth pattern. Chile, as emphasized throughout this paper, needs to prioritize the diversification of its economy in order to make the sustainability of its model more likely, for it is an economy that would greatly suffer from the drop of copper prices. It is closer than any other South American nation to becoming fully developed, and the balance it has achieved, if flexibility to respond to challenges continues, it will surely drive the country to fully developed status in the next few decades. Having been through processes of democratization, both nations ought to strengthen and secure their institutions to guarantee progressive democracy for years to come.
! ! ! ! ! ! ! ! ! ! ! ! ! ! ! ! ! ! ! !
Running Header: DEVELOPMENT TRAJECTORIES References Baer, Werner and Kerstenetsky, Issac.(1972) “Import Substitution and Industrialization in Latin America: Experiences and Interpretations.” Latin American Research Review, 7,(1), 95-122. Birdsall, Nancy. 2001. ‘Why Inequality Matters’. Ethics and International Affairs. CIA Factbook. (2013). Brazil. https://www.cia.gov/library/publications/the-worldfactbook/ geos/br.html CIA Factbook. (2013). Chile. https://www.cia.gov/library/publications/the-worldfactbook/ geos/ci.html Datafolha (2013) Engerman, Stanley L, Kenneth L. Sokoloff, Miguel Urquiola and Daron Acemoglu. (2002). “Factor Endowments, Inequality, and Paths of Development among New World Economies” [with Comments], Economía, 3 (1), 41-109. Ferreira, H.G. and Ravallion, M. (2008). “Global Poverty and Inequality. A Review of the Evidence”. World Bank. Policy Research Working Paper 4623. Larroulet, Cristian. "Chile's Economic Growth: Key Reforms to Development." The Heritage Foundation. N.p., 15 Oct. 2013. Web. 20 Nov. 2013. . Panja, Tariq, and David Biller. "Brazil Riots Threaten World Cup as Nation Prepares for Games." Bloomberg.com. Bloomberg, n.d. Web. 14 Nov. 2013. . Rodrik, Dani. 2007. One Economics, Many Recipes: Globalization, Institutions, and Economic Growth. Princeton, NJ: Princeton University Press. UN HDI Database. (2012). http://hdrstats.undp.org/en/tables/. World Bank Database. (2012). http://data.worldbank.org/. Zimbalist, Andrew. "Brazil World Cup Olympics Finances - Brazilian Infrastructure Olympics and World Cup Impact." Brazil World Cup Olympics Finances -
!16
Running Header: DEVELOPMENT TRAJECTORIES Brazilian Infrastructure Olympics and World Cup Impact. N.p., n.d. Web. 25 Nov. 2013.