Uncertainty evaluation for a new traceable areal surface texture measuring instrument †
C. L. Giusca†‡*, A. B. Forbes†, R. K. Leach† National Physical Laboratory, Hampton Rd, Teddington, Middlesex, TW11 0LW, UK ‡ University of Huddersfield, Queensgate, Huddersfield, HD1 3DH, UK Received Date Line (to be inserted by Production) (8 pt)
Abstract A traceable areal surface texture measuring instrument has recently been developed at the National Physical Laboratory (NPL). The instrument uses a stylus probe and the relative positions of the measured points on a surface are inferred from laser interferometers. This paper presents the method used to evaluate the uncertainties associated with the new traceable instrument. A geometrical model of the instrument has been constructed and a Monte Carlo technique has been used to evaluate the uncertainties associated with the point coordinates. The approach is analogous to the “virtual CMM” method used in co-ordinate metrology. The mathematical model is presented along with the influence factors and some preliminary results. Keywords: Areal Surface Texture, Contact Stylus, Monte Carlo Method, Uncertainty Evaluation
1.
Introduction
The NPL Areal Instrument [1] is a primary surface texture measuring instrument that has been developed in response to the demand for traceable three-dimensional (3D) or areal surface texture measurements. The instrument measures the positions of a set of points on the surface of an artefact. The measured points are used to generate a 3D map of the surface and to calculate various surface texture parameters. To allow for reliable areal surface texture measurements it is important to ensure traceability. The NPL Areal Instrument was developed based on this requirement. The instrument is a contact stylus instrument that measures the displacement of the stylus using laser interferometers. The interferometers are mounted on three mutually orthogonal axes monitoring the position of the stylus tip relative to the sample surface, providing 3D coordinate measurements traceable to the definition of metre. The instrument’s working volume is 8 mm by 8 mm by 0.1 mm. The instrument is effectively a coordinate measuring machine (CMM) and its performance depends on a complex interaction [2] between a number of influence factors such as the squareness of pairs of axes, alignment and imperfect motion. While the effects of these interactions are usually compensated through calibration, the assessment of measurement uncertainty remains an issue. The NPL Areal Instrument is designed to perform traceable 3D measurements of surface texture with uncertainties of the order of nanometres. We present in this paper the evaluation of uncertainty associated with the *
Corresponding author. Tel.: +44 (0) 20 8943 6321. E-mail address:
[email protected] (Claudiu L. Giusca)
NPL Areal Instrument point coordinate measurement calculated using the Monte Carlo approach [3]. The Monte Carlo approach is based on using an input-output model to estimate the output quantity uncertainty in terms of probability distributions assigned to the input quantities. 2.
The NPL Areal Instrument
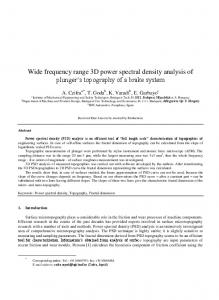
The NPL Areal Instrument [1], shown schematically in Fig. 1, consists of a granite surface plate (Fig. 1a), a steel structural frame that is rigidly attached to the granite base ( Fig. 1b), a coplanar air-bearing translation stage (Fig. 1c) that is also fixed to the granite base below the steel frame, and a probing system ( Fig. 2) that is mounted kinematically on the steel frame. The entire structure of the instrument is mounted on a vibration isolation table. The stylus probe (Fig. 2a) is mounted vertically and in direct contact with the surface of a sample. The probing force is approximately 0.75 mN ± 0.15 mN. When the stylus probe contacts a sample placed on the translation stage, the structural loop is closed.
Fig. 1 Schema of the NPL Areal Instrument.
Fig. 2 Schema of the probing system.
The coplanar translation stage supports a sample holder and a Zerodur mirror block ( Fig. 2b). The sample holder is height adjustable and is made of Zerodur spacers having different thicknesses, allowing for coarse adjustment. The spacers are placed on an Invar rising stage providing finer height increments. The Zerodur block provides the reference surface for the z interferometer and the measurement surfaces for the x and y interferometers, which establishes the squareness of the coordinate system. The z interferometer (Fig. 1d) is mounted on top of the frame, above the probing system, and the x and y interferometers (each interferometer block contains a linear and an angular measuring system) are bolted onto the underside of the bridge. The z interferometer is referenced from the top Zerodur plane mirror above the sample. Since the sample is situated below the z reference mirror, the probe access to the sample is through a hole in the z reference mirror. This arrangement limits the movement in the x and y directions to approximately 8 mm by 8 mm. The x and y interferometers are referenced from two further mirrors nominally orthogonal to each other and mounted on the probing system body that remains stationary during measurements. The sample moves in a horizontal plane at constant speed while the laser interferometers measure the displacement of the sample relative to the probe. Monitoring the position of the probe tip and translation stage using laser interferometers provides measurement traceability via the stabilised wavelength of the source laser. 3.
Mathematical model
The uncertainty associated with the instrument point coordinate measurements is evaluated using a mathematical model described elsewhere [4]. With reference to Fig. 3, Eq. 1 represents the basic instrument model for a single interferometric measurement:
y R p ws N
T 0, k
u (1) v h g u, v
where y are the coordinates of the target being measured, p and s jointly define a line in three dimensions representing the interferometric measuring beam, R(α) specifies the stage rotation, N0,k is a fixed rotation matrix that describes the mirror orthogonality, and (u, ν, h + g(u, ν))T describes the shape of the mirror as a function of u and v, where h is the nominal surface height and the function g describes the form error. We expect g to be close to zero. The parameters u and v describe the point of intersection of the beam with the mirror Fig. 3 Schema of plan view of the NPL Areal Instrument: surface and w is the distance between the reference p describes the interferometer position, w is the distance mirror and the stage mirror. Assuming nominal between the interferometer and the mirror surface, x0 is geometry of the mirrors, perfect interferometric the mirror block position vector, x(u) is a position vector alignment and perfect motion, Eq. 1 is used to that describes a point on the mirror, yr,l is the target convert an interferometric measurement of w to an position vector and yr is the target position vector in the stage reference frame. estimate of one of the coordinates of the target y. Using all three interferometric measurements along each axis allows the coordinates of y to be determined. The model takes into account all the main instrument error sources such as the squareness of the pairs of axes, reflecting mirror flatness, interferometer orientations, Abbe offsets, dead-path, thermo-mechanical effects, laser intrinsic error sources and the imperfect motion of the translation stage. 4.
Results
The uncertainty associated with the point coordinate measurement was calculated using a Monte Carlo method. The Monte Carlo analysis is based on the following approach. Using Eq. 1 for each of the three mirrors, the coordinates yr of the target can be expressed as a function of the other parameters in the model. By assigning probability distributions to these parameters, the uncertainties associated with the estimates of the target coordinates can be evaluated. We consider the instrument has been well characterised, which means that all the input parameters are well known, as well as the random instrument effects. A detailed list of the input parameters and their associated probability density functions (PDFs) is given in Table 1. The Monte Carlo approach is a sampling method for estimating the uncertainty of measurement. The method generates a random draw for each input quantity from its assigned PDF, and then calculates the output quantity value for these sampled input quantity values. In this way, samples from the output distribution are calculated from which means, standard deviations and coverage intervals can be estimated.
Table 1 Input quantities and their associated PDFs. R(a, b) is a rectangular distribution and N(x, u2(x)) is a Gaussian distribution. Quantity / unit
PDF
Position and orientation of x interferometer pxx / mm R(15.999 996, 16.000 004) pxy / mm R(4.5, 5.5) pxz / mm R(0.5, 1.5) αxx / mrad R(–0.15, 0.15) βxy / mrad R(103 × π/2 – 0.15, 103 × π/2 + 0.15) γxz / mrad R(–0.15, 0.15) Position and orientation of y interferometer pyx / mm R(0.5, 1.5) pyy / mm R(–16.000 004, –15.999 996) pyz / mm R(4.5, 5.5) αyx / mrad R(–0.15, 0.15) βyy / mrad R(103 × π/2 – 0.15, 103 × π/2 + 0.15) γyz / mrad R(–0.15, 0.15) Position and orientation of z interferometer pzx / mm R(–0.002, 0.002) pzy / mm R(–0.002, 0.002) pzz / mm R(0.199 997, 0.200 003) αzx / mrad βzy / mrad γzz / mrad α0,l / μrad β0,l / μrad γ0,l / μrad N
βxy / μrad γxz / μrad N αyx / μrad N
R(–0.15, 0.15) R(103 × π – 0.15, 103 × π + 0.15) R(–0.15, 0.15) xy stage rotation R(–0.97, 0.97) R(–0.97, 0.97) R(3.8, 5.8) Mirrors orthogonality and flatness R(–106 × π/2 – 0.97, –106 × π/2 + 0.97) R(–0.97, 0.97) R(106 × π/2 – 0.97, 106 × π/2 + 0.97)
ωx / mm ωy / mm ωz / mm
N(0, 0.000 0072) N(0, 0.000 0072) N(0, 0.000 001 52) Dead path and laser contribution N(25, 0.000 000 42) N(25, 0.000 000 42) N(5, 0.000 000 12)
εx / mm εy / mm εz / mm
N(0,0.000 000 72) N(0,0.000 000 72) N(0,0.000 000 562)
hx / mm hy / mm hz / mm
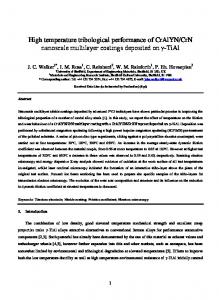
The recommended steps for estimating the uncertainty using the Monte Carlo approach are [5]: 1. Select the number of trials (n). 2. Generate n input quantity vectors by sampling from their PDFs. 3. Calculate the value of the output quantity corresponding to each input quantity vector. 4. Obtain the mean and standard deviation of the calculated output quantity values. In our experiments n = 50 000 trials were found to be adequate for producing stable results. The uncertainties were evaluated for a set of target locations uniformly distributed in a working volume of 8 mm by 8 mm by 0.1 mm. The results of the simulation show that the standard uncertainty associated with the point coordinate measurements along the x and y directions does not exceed 8 nm and the standard uncertainty associated with the point coordinate measurement along the z direction does not exceed 3 nm. These values are achievable because the variations associated with the influence quantities are small. For example, small Abbe and cosine offsets are matched by the sub arc-second orthogonality of pairs of axes and angular degrees of freedom of the moving stage. If the uncertainties associated with the laser alignment are increased by a factor of ten, the standard uncertainties associated with the x and y coordinate estimates increase from approximately 8 nm to 35 nm. To verify the simulations, we have performed measurements of step heights using the NPL Areal Instrument. Preliminary measurements on 100 nm and 1000 nm step heights are in good agreement with the measurements performed using a traceable profile measuring instrument (NanoSurf IV) [6]. The NPL Areal Instrument results are 93 nm ± 3 nm (k = 1) and 971 nm ± 3 nm (k = 1). The NanoSurf IV results on the same samples are 92.7 nm ± 1.0 nm (k = 1) and 968.5 nm ± 0.9 nm (k = 1). Fig. 4 shows a map of the 1000 nm step height that was obtained using the NPL Areal Instrument coordinate measurements.
Fig. 4 Areal Instrument measurement on a step height 1 μm deep and 500 μm wide.
5.
Summary
In summary, we have calculated the uncertainty associated with the NPL Areal Instrument’s coordinate measurements. A measurement model was established that takes into account all the instrument error sources, such as squareness of pair of axes, reflecting mirror flatness, interferometers orientation, Abbe offsets, dead-path, thermo-mechanic effects, laser intrinsic error sources and the imperfect motion of the coplanar air-bearing stage. The method of choice for calculating the uncertainties associated with the instrument point coordinate measurement was a Monte Carlo method. The NPL Areal Instrument is capable of measuring the relative position of a point on a surface with nanometre uncertainties. The standard uncertainty associated with the distance measurement in the x and y directions is 8 nm, whereas the standard uncertainty in the z direction was found to be 3 nm. We have proved that the NPL Areal Instrument has the attributes of a traceable instrument. Further work is necessary to understand the way that the uncertainties associated with the coordinate measurements influence the uncertainties associated with the areal surface texture parameters. It is also important to compare the NPL Areal Instrument with other instruments of a similar kind in order to validate their performance characterisation. Acknowledgements This work was carried out as part of the UK’s Department of Innovation, Universities and Skills Engineering Measurement (2008 - 2011) and Software Support for Metrology programmes (2007 – 2010). References [1] R. K. Leach, D. R. Flack, E. B. Hughes, C. W. Jones, Development of a new traceable areal surface texture measuring instrument, Wear 266 (2009), 552-554 [2] M. G. Cox, A. B. Forbes, P. M. Harris, G. N. Peggs, Experimental design in determining the parametric errors of CMM, Proceedings of 4th Int. Conf. on Laser Metrology and Machine Performance. Lamdamap 1999, 13-22 [3] BIPM, IEC, IFCC, ILAC, ISO, IUPAC, IUPAP, and OIML. Evaluation of measurement data — Supplement 1 to the “Guide to the expression of uncertainty in measurement — Propagation of distributions using a Monte Carlo method, Bureau International des Poids et Mesures, JCGM 101, 2008. [4] A. B. Forbes, R. K. Leach, Self-calibration of a novel surface texture measuring instrument, Proceedings of 7th Int. Conf. and Exhib. on Laser Metrology, Machine Tool, CMM & Robotic Performance. Lamdamap, 2005, pp. 276-285 [5] M. G. Cox, P. M. Harris, Software Support for Metrology. Best Practice Guide No. 6. Uncertainty Evaluation, NPL Report DEM-ES-011, 2006 [6] R. K. Leach, Traceable measurement of surface texture at the National Physical Laboratory using NanoSurf IV, Meas. Sci. Technol. 13 (2000), N1-N4