NASA contract NNL08AA23C, by a Samsung SAIT grant, and by several Microsoft gifts. .... event use iter before(Iterator i) : call(* Iterator+.next()) && target(i) {}.
RV'10, LNCS 6418, pp 136-152. 2010
Runtime Verification with the RV System
?
Patrick Meredith and Grigore Ro¸su 2
1 Runtime Verification, Inc University of Illinois at Urbana-Champaign 3 {pmeredit, grosu}@illinois.edu
Abstract. The RV system is the first system to merge the benefits of Runtime Monitoring with Predictive Analysis. The Runtime Monitoring portion of RV is based on the successful Monitoring Oriented Programming system developed at the University of Illinois [6, 7, 9, 21, 5], while the Predictive Analysis capability is a vastly expanded version of the jPredictor System also developed at the University of Illinois [11, 14]. With the RV system, runtime monitoring is supported and encouraged as a fundamental principle for building reliable software: monitors are automatically synthesized from specified properties and integrated into the original system to check its dynamic behaviors. When certain conditions of interest occur, such as a violation of a specification, user-defined actions will be triggered, which can be any code from information logging to runtime recovery. The RV system supports the monitoring of parametric properties that may specify a relationship between objects. Properties may be defined using one of several logical formalisms, such as: extended regular languages, context-free patterns, deterministic finite state machines, linear temporal logic, and past time linear temporal logic. The system is designed in such a way that adding new logical formalisms is a relatively simple task The predictive capabilities allow any of these monitoring specifications to be extended to checking not just the actual runtime traces of program execution, but any trace that may be inferred from a constructed casual model. The Predictive Analysis also features built in algorithms for race detection and atomicity violations, that are both highly useful in concurrent system design and difficult to specify in terms of formal specification languages.
1
Introduction
This paper presents an introduction to the RV System, the first system to combine runtime monitoring and predictive analysis. Not only do these two components work in isolation to ease the testing and debugging of software, but they also work in conjunction: monitoring properties can be predicted against using the predictive analysis capabilities of the system. Runtime monitoring allows one to check safety properties against the execution of a program during runtime. In the RV System, properties are parametric, which means they take into account the given objects that are related to a given property. For example, one may wish to state a property that an Enumeration ?
Supported in part by NSF grants CCF-0916893, CNS-0720512, and CCF-0448501, by NASA contract NNL08AA23C, by a Samsung SAIT grant, and by several Microsoft gifts.
RV'10, LNCS 6418, pp 136-152. 2010
from a given Vector in Java is not used after the Vector is updated. In this case the parameters will be a Vector and an Enumeration, and the property will be checked for every pair of Vector and Enumeration objects. Predictive analysis allows one to check safety properties against all the viable inferred executions of a program that can be generated by creating a causal model from one run of the program. This is especially useful for checking safety properties that rely on the behavior of concurrent code, such as finding races and atomicity violations. The remainder of this paper is as follows: Section 2 discusses a high level overview of the RV system. Section 3 provides an explanation of runtime monitoring, including an explanation of parametric slicing and several examples of how to use the monitoring portion of the RV system (referred to as RV-Monitor). Additionally, some performance results are given. Section 4 discusses the concepts necessary to understanding the predictive analysis of the RV system (RV-Predict), as well as explaining, at a high level, several of the algorithms used in prediction. As with monitoring, several examples and results are given.
2
System Overview
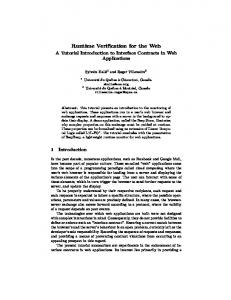
Fig. 1. System Overview
Fig. 1 shows the dependency diagram for the RV System. The RV System consists of two components, RV-Monitor and RV-Predict, which are further divided into sub-components. The arrows represent the direction of data flow. In the case of components that generate code, the generated code is treated as synonymous with the component that generates it in order to simplify the diagram. 1. RV-Monitor (a) Runtime Monitoring performs actual monitoring on a program under test. This is achieved by generating an AspectJ aspect that is weaved into the program under test, which is then run to collect monitoring results. This is discussed in detail in Section 3. (b) Prediction Logging Aspect generates an aspect that is weaved into the program under test that causes the program to generate logging info for use in prediction of arbitrary properties. This is orthogonal to the Instrumentation component of RV-Predict described below, and
RV'10, LNCS 6418, pp 136-152. 2010
used in conjunction with it. The logging aspect is automatically inferred from a specification designed for the Runtime Monitoring component. (c) Prediction Monitor Library generates a library that communicates with the Generic Property Detection component of RV-Predict. The Generic Property Detection component sends events to the Prediction Monitor Library which reports monitoring results back to the Generic Property Detection component. The library is generated from a specification designed for the Runtime Monitoring component. (d) Parametric Slicing slices a trace based on parameter instances. This component is used both by the Runtime Monitoring and Prediction Monitor Library in order to properly find violations and validations of parametric properties. This is explained in more detail in Section 3.1. 2. RV-Predict (a) Instrumentation adds logging code to a program under test. This will cause important information about a run of the program under test, such as the creation of threads or the entry and exit of methods, to be output by the Logging component. (b) Logging runs the program under test which has been instrumented with logging code via the Instrumentation component. If generic property detection is performed, the program under test will be weaved with the Prediction Logging Aspect generated aspect before logging commences. (c) Causal Slicing performs casual slicing of the logged trace of the program using the concept of sliced causality first introduced in [11]. Causal slicing is able to reduce the amount of necessary information in a trace, which allows the various prediction steps to find more viable linearizations of the trace. It is described in detail in Section 4.1. (d) Race Detection performs race detection. This is achieved by determining when to accesses to the same variable, at least one of which is a write, may be reordered while still preserving the causal dependences of the program. It is described in more detail in Section 4.2. (e) Atomicity Violation Detection finds violations in the intended atomicity of a program. More detail on this can be found in [14]. (f) Generic Property Detection detects violations and validations of given generic specifications by discovering possible linearizations that are causally possible and feeding the events of these linearizations to a library generated by the Prediction Monitor Library. These specifications are written using the same syntax as those used by the Runtime Monitoring component. It is described in more detail in Section 4.2.
3
Runtime Monitoring
Monitoring executions of a system against expected properties plays an important role not only in different stages of software development, e.g., testing and debugging, but also in the deployed system as a mechanism to increase system reliability. This is achieved by allowing the monitors to perform recovery actions in the case that a specification is matched, or fails to match. Numerous approaches,
RV'10, LNCS 6418, pp 136-152. 2010
UnsafeMapIterator(Map m, Collection c, Iterator i){ event create coll after(Map m) returning(Collection c)} : (call(* Map.values()) || call(* Map.keySet())) && target(m) {} event create iter after(Collection c) returning(Iterator i) : call(* Collection+.iterator()) && target(c) {} event use iter before(Iterator i) : call(* Iterator+.next()) && target(i) {} event update map after(Map m) : call(* Map.remove*(..)) || call(* Map.put*(..)) || call(* Map.putAll*(..)) || call(* Map.clear())) && target(m) {} fsm: start [ create coll -> s1 ] s1 [ update map -> s1, create iter -> s2 ] ] s2 [ use iter -> s2, update map -> s3 s3 [ update map -> s3, uset iter -> end ] end [] @end { System.out.println("fsm: Accessed invalid Iterator!"); RESET; } ere: create coll update map* create iter use iter* update map+ use iter @match { System.out.println("ere: Accessed Invalid Iterator!"); RESET; } cfg: S -> create coll Updates create iter Nexts update map Updates use iter, Nexts -> Nexts use iter | epsilon Updates -> Updates update map | epsilon @match { System.out.println("cfg: Accessed Invalid Iterator!"); RESET; } ftltl: (create coll and (create iter and (update map and use iter))) @validation { System.out.println("ftltl: Accessed Invalid Iterator!"); RESET; } ptltl: use iter -> (( (create iter and ( create coll))) -> ((not update map) S create iter)) @violation { System.out.println("prltl: Accessed Invalid Iterator!"); RESET; }
s1
up
us e
da
ite
te
r
ma p
r ite at e cre
start
cre
at
ec oll
}
s2
s3
end
update map use iter update map
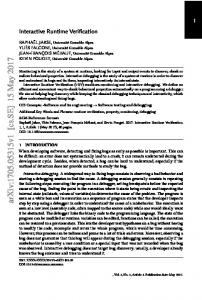
Fig. 2. FSM, ERE, CFG, FTLTL, and PTLTL UnsafeMapIterator. Inset: graphical depiction of the property.
such as [18, 15, 8, 3, 1, 2, 20, 17, 10], have been proposed to build effective and efficient monitoring solutions for different applications. More recently, monitoring of parametric specifications, i.e., specifications with free variables, has received increasing interest due to its effectiveness at capturing system behaviors, such as the one presented in Fig. 2, which encapsulates the proper use of Map Iterators. It is highly non-trivial to monitor such parametric specifications efficiently. It is possible to see a tremendous number of parameter instances during the execution of a monitored program. For example, it is not uncommon to see hundreds of thousands of iterators in a program, which will generate hundreds of thousands of parameter instances in the UnsafeMapIterator specification in Fig. 2. Several approaches have been introduced to support the monitoring of parametric specifications, including Eagle [3], Tracematches [1, 2], PQL [20], and PTQL [17]. However, they are all limited in terms of supported specification formalisms. Other techniques, e.g., Eagle, Tracematches, PQL and PTQL, follow a formalism-dependent approach, that is, they have their parametric specification formalisms hardwired, e.g., regular patterns (like Tracematches), context-free patterns (like PQL) with parameters, etc., and then develop algorithms to generate monitoring code for the particular formalisms. Although this approach provides a feasible solution to monitoring parametric specifications, we argue that it not only has limited expressiveness, but also causes unnecessary complexity in developing optimal monitor generation algorithms, often leading to inefficient monitoring. In
RV'10, LNCS 6418, pp 136-152. 2010
fact, the experiments summarized in Section 3.3 shows that RV-Monitor generates more efficient monitoring code than other existing tools. Fig. 2 shows a RV-Monitor specification of the UnsafeMapIterator property. The idea of UnsafeMapIterator is to catch an intricate safety property of Java. There are several methods to create Collection (essentially sets) from Java Maps. One may then create Java Iterators to traverse these Collections. However, if the Map is updated, the Iterators are invalidated. The specification uses five different formalisms: finite state machines (FSM), extended regular expressions (ERE), context-free grammars (CFG), future-time linear temporal logic (FTLTL), and past-time linear temporal logic (PTLTL). Because each of the properties in Fig. 2 is the same, five messages will be reported whenever an Iterator is incorrectly used after an update to the underlying Map. We show all five of them to emphasize the formalism-independence of our approach. Under normal circumstances a user would chose just one formalism. On the first line, we name the specified property and give the parameters used in the specification. Then we define the involved events using the AspectJ syntax. For example, create coll is defined as the return value of functions values and keyset of Map. We adopt AspectJ syntax to define events in RV-Monitor because it is an expressive language for defining observation points in a Java program. As mentioned, every event may instantiate some parameters at runtime. This can be seen in Fig. 2: create coll will instantiate parameters m and c using the target and the return value of the method call. When one defines a pattern or formula there are implicit events, which must begin traces; we call them monitor creation events. For example, in a pattern language like ERE, the monitor creation events are the first events that appear in the pattern. We assume a semantics where events that occur before monitor creation events are ignored. 3.1
Parametric Slicing
#
Event
1 2 3 4 5 6
create collhm1 , c1 i create collhm1 , c2 i create iterhc1 , i1 i create iterhc1 , i2 i use iterhi1 i create iterhc2 , i3 i
#
Event
7 update maphm1 i 8 use iterhi2 i 9 create collhm2 , c3 i 10 create iterhc3 , i4 i 11 use iterhi4 i
Fig. 3. Possible execution trace over the events specified in UnsafeMapIterator.
RV-Monitor automatically synthesizes AspectJ instrumentation code from the specification, which is weaved into the program we wish to monitor by any standard AspectJ compiler. In this way, executions of the monitored program will produce traces made up of events defined in the specification, as those in Fig. 2. Consider the example eleven event trace in Fig. 3 over the events defined in Fig. 2. The # column gives the numbering of the events for easy reference. Every event in the trace starts with the name of the event, e.g., create coll, followed
RV'10, LNCS 6418, pp 136-152. 2010
by the parameter binding information, e.g., hm1 , c1 i that binds parameters m and c with a map object m1 and a collection c1 , respectively. Such a trace is called a parametric trace since it contains events with parameters. Our approach to monitoring parametric traces against parametric properties is based on the observation that each parametric trace actually contains multiple non-parametric trace slices, each for a particular parameter binding instance. Intuitively, a slice of a parametric trace for a particular parameter binding consists of names of all the events that have identical or less informative parameter bindings. Informally, a parameter binding b1 is identical or less informative than a parameter binding b2 if and only if the parameters for which they have bindings agree, and b2 binds either an equal number of parameters or more parameters: parameter hm1 , c2 i is less informative than hm1 , c2 , i3 i because the parameters they both bind, m and c, agree on their values, m1 and c2 , respectively, and hm1 , c2 , i3 i binds one more parameter. From here on we will simply say less informative to mean identical or less informative. Fig. 4 shows the trace slices and their corresponding parameter bindings contained in the trace in Fig. 3. The Status column denotes the monitor output category that the slice falls into (for ERE). In this case everything but the slice for hm1 , c1 , i2 i, which matches the property, is in the “?” (undecided) category. For example, the trace for the binding hm1 , c1 i contains create coll update map (the first and seventh events in the trace) and the trace for the binding hm1 , c1 , i2 i is create coll create iter update map use iter (the first, fourth, seventh, and eighth events in the trace).
Instance
Slice
Status
hm1 i update map ? hm1 , c1 i create coll update map ? hm1 , c2 i create coll update map ? ? hm2 , c3 i create coll hm1 , c1 , i1 i create coll create iter use iter update map ? hm1 , c1 , i2 i create coll create iter update map use iter match hm1 , c2 , i3 i create coll create iter update map ? ? hm2 , c3 , i4 i create coll create iter use iter
Fig. 4. Slices for the trace in Fig. 3.
Based on this observation, our approach creates a set of monitor instances during the monitoring process, each handling a trace slice for a parameter binding. Fig. 5 shows the set of monitor instances created for the trace in Fig. 3, each monitor labeled by the corresponding parameter binding. This way, the monitor does not need to handle the parameter information and can employ any existing technique for ordinary, non-parametric traces, including state machines and pushdown automata, providing a formalism-independent way to check parametric properties. When an event comes, our algorithm will dispatch it to related monitors, which will update their states accordingly. For example, the seventh
RV'10, LNCS 6418, pp 136-152. 2010
hm1 , c1 i hm1 , c2 i
hm2 , c3 i
hm1 , c1 , i2 i
hm1 , c1 , i1 i
hm2 , c3 , i4 i
hm1 , c2 , i3 i
Fig. 5. A parametric monitor with corresponding parameter instance monitors.
event in Fig. 3, update maphm1 i, will be dispatched to monitors for hm1 , c1 i, hm1 , c2 i, hm1 , c1 , i1 i, hm1 , c1 , i2 i, and hm1 , c2 , i3 i. New monitor instances will be created if the event contains new parameter instances. For example, when the third event in Fig. 3, create iterhc1 , i1 i, is received, a new monitor will be created for hm1 , c1 , i1 i by combining hm1 , c1 i in the first event with hc1 , i1 i. An algorithm to build parameter instances from observed events, like the one introduced in [12], may create many useless monitor instances leading to prohibitive runtime overheads. For example, Fig. 4 does not need to contain the binding hm1 , c3 , i4 i even though it can be created by combining the parameter instances of update maphm1 i (the seventh event) and create iterhc3 , i4 i (the tenth event). It is safe to ignore this binding here because m1 is not the underlying map for c3 , i4 . It is critical to minimize the number of monitor instances created during monitoring. The advantage is twofold: (1) that it reduces the needed memory space, and (2), more importantly, monitoring efficiency is improved since fewer monitors are triggered for each received event. RV-Monitor uses several algorithms in order to prevent the creation of instances that are known to be unneeded, as well as to remove those that become unneeded during execution. 3.2 Monitoring Example Here we give a simple example of monitoring using RV-Monitor, consider the following Java program: bash-3.2$ cat SafeEnum_1.java import java.util.*; public class SafeEnum_1 { public static void main(String[] args){ Vector v = new Vector(); v.add(1); v.add(2); v.add(4); v.add(8); Enumeration e = v.elements(); int sum = 0; if(e.hasMoreElements()){ sum += (Integer)e.nextElement(); v.add(11); } while(e.hasMoreElements()){ sum += (Integer)e.nextElement(); } v.clear(); System.out.println("sum: " + sum);
RV'10, LNCS 6418, pp 136-152. 2010
} }
This program violates a basic multi-object protocol, namely that a vector should not be modified during enumeration. For performance reasons, the JVM does not perform this runtime check, so one can end up with a subtle, nondeterministic and hard to check error in one’s program. Suppose now that one wants to monitor the program above using rv-monitor. All one needs to do is to create a subdirectory called mop and to place in this directory all the property specifications against which one wants to monitor the program. In our case, bash-3.2$ cat mop/SafeEnum.mop package mop; import java.io.*; import java.util.*; SafeEnum(Vector v, Enumeration e) { event create after(Vector v) returning(Enumeration e) : call(Enumeration Vector+.elements()) && target(v) {} event updatesource after(Vector v) : (call(* Vector+.remove*(..)) || call(* Vector+.add*(..)) || call(* Vector+.clear(..)) || call(* Vector+.insertElementAt(..)) || call(* Vector+.set*(..)) || call(* Vector+.retainAll(..))) && target(v){} event next before(Enumeration e) : call(* Enumeration+.nextElement()) && target(e){} ere : create next* updatesource updatesource* next @match { System.out.println("improper enumeration usage at " + __LOC); __RESET; } }
Now one can call the rv-monitor program, which does a series of operations under the hood (compiles the program, compiles the specification, weaves the generated monitor with the program binary, then runs the resulting monitored program) and only shows the user the relevant information: bash-3.2$ rv-monitor SafeEnum_1 -Processing ./mop/SafeEnum.mop SafeEnumMonitorAspect.aj is generated SafeEnum_1.java Executing your program: improper enumeration usage at SafeEnum_1.java:23 sum: 26 Done
The message above makes it clear to the user that the program violates the specification. 3.3 Monitoring Results Our previous work on monitoring, in particular [21, 5] shows that, in general the overhead of monitoring is around 10%. However, some exceptionally intensive
RV'10, LNCS 6418, pp 136-152. 2010
properties, such as iterator based properties in the bloat and pmd benchmarks from DaCapo [4] showed exceptionally large overheads. Recent advances have lowered these overheads considerably, as can be seen in Fig. 6 where JavaMOP is our earlier system and RV-Monitor is our current system.
UnsafeMapIterator JavaMOP RV-Monitor bloat pmd
935% 196%
194% 74%
Fig. 6. JavaMOP Vs. RV-Monitor
4
Predictive Analysis
Concurrent systems in general and multithreaded systems in particular may exhibit different behaviors when executed at different times. This inherent nondeterminism makes multithreaded programs difficult to analyze, test and debug. Predictive analysis is able to detect, correctly, concurrency errors from observing execution traces of multithreaded programs. By “correct” or “sound” prediction of errors we mean that there are no false alarms. The program is automatically instrumented to emit runtime events for use in the Causal Slicing component, and the various detection components on the right side of Fig. 1. The particular execution that is observed need not hit the error; yet, errors in other executions can be correctly predicted together with counter-examples leading to them. There are several other approaches also aiming at detecting potential concurrency errors by examining particular execution traces. Some of these approaches aim at verifying general purpose properties [25, 26], including temporal ones, and are inspired from debugging distributed systems based on Lamport’s happensbefore causality [19]. Other approaches work with particular properties, such as data-races and/or atomicity. [24] introduces a first lock-set based algorithm to detect data-races dynamically, followed by many variants aiming at improving its accuracy. For example, an ownership model was used in [23] to achieve a more precise race detection at the object level. [22] combines the lock-set and the happen-before techniques. The lock-set technique has also been used to detect atomicity violations at runtime, e.g., the reduction based algorithms in [16] and [27]. [27] also proposes a block-based algorithm for dynamic checking of atomicity built on a simplified happen-before relation, as well as a graph-based algorithm to improve the efficiency and precision of runtime atomicity analysis. Previous efforts tend to focus on either soundness or coverage: those based on happens-before try to be sound, but have limited coverage over interleavings, thus missing errors; lock-set based approaches have better coverage but suffer from false alarms. RV-Predict aims at improving coverage without giving up soundness or genericity of properties. It combines sliced causality [11], a happen-before
RV'10, LNCS 6418, pp 136-152. 2010
causality drastically but soundly sliced by removing irrelevant causalities using semantic information about the program obtained with an apriori static analysis, with lock-atomicity. Our predictive runtime analysis technique can be understood as a hybrid of testing and model checking. Testing because one runs the system and observes its runtime behavior in order to detect errors, and model checking because the special causality with lock-atomicity extracted from the running program can be regarded as an abstract model of the program, which can further be investigated exhaustively by the observer in order to detect potential errors. 4.1
Causal Slicing
We briefly describe our technique for extracting from an execution trace of a multithreaded system the sliced causality relation corresponding to some property of interest ϕ. Our technique is offline, in the sense that it takes as input an already generated execution trace (see Fig. 1); that is because causal slicing must traverse the trace backwards. Our technique consists of two steps: (1) all the irrelevant events (those which are neither property events nor events on which property events are dependant) are removed from the original trace, obtaining the (ϕ)-sliced trace; and (2) a vector clock (VC) based algorithm is applied on the sliced trace to capture the sliced causality partial order. Extracting Slices Our goal here is to take a trace ξ and a property ϕ, and to generate a trace ξϕ obtained from ξ filtering out all its events which are irrelevant for ϕ. When slicing the execution trace, one must nevertheless keep all the property events. Moreover, one must also keep any event e with e (@ctrl ∪ @data )+ e0 for some property event e0 . This can be easily achieved by traversing the original trace backwards, starting with ξϕ empty and accumulating in ξϕ events that either are property events or have events depending on them already in ξϕ . One can employ any off-the-shelf analysis tool for data- and control- dependence; e.g., RV-Predict uses termination-sensitive control dependence [13].
Thread t1:
T1
Thread t2:
T2
y = 1;
e 1write y
x=0 if (x == 0) { x=1
e 2: write x
e3 : read x
x=y y=0 }
e4 : write x
e 5: read y
e 6: write y
A. Example program
B. Example Trace
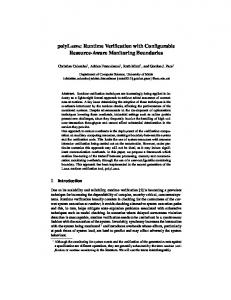
Fig. 7. Example for relevance dependence
RV'10, LNCS 6418, pp 136-152. 2010
To understand the process, consider the example in Fig. 7, threads T1 and T2 are executed as shown by the solid arrows (A), yielding the event sequence “e1 , e2 , e3 , e4 , e5 , e6 ” (B). Suppose the property to check refers only to y; the property events are then e1 , e5 , and e6 . Events e2 and e3 are immediately marked as relevant, since e2 @data e3 @ctrl e5 . If only closure under control- and datadependence were used to compute the relevant events, then e4 would appear to be irrelevant, so one may conclude that “e2 , e6 , e1 , e3 , e5 ” is a sound permutation; there is, obviously, no execution that can produce that trace, so one reported a false alarm if that trace violated the original property on y. Consequently, e4 is also a relevant event and e3 @rlvn e4 . Unfortunately, one backwards traversal of the trace does not suffice to correctly calculate all the relevant events. Reconsider Fig. 7. When the backward traversal first reaches e4 , it is unclear whether e4 is relevant or not, because we have not seen e3 and e2 yet. Thus a second scan of the trace is needed to include e4 . Once e4 is included in ξϕ , it may induce other relevance dependencies, requiring more traversals of the trace to include them. This process would cease only when no new relevant events are detected and thus resulting sliced trace stabilizes. If one misses relevant events like e4 then one may “slice the trace too much” and, consequently, one may produce false alarms. Because at each trace traversal some event is added to ξϕ , the worse-case complexity of the sound trace slicing procedure is square in the number of events. Since execution traces can be huge, in the order of billions of events4 , any trace slicing algorithms that is worse than linear may easily become prohibitive. For that reason, RV-Predict traverses the trace only once during slicing, thus achieving an approximation of the complete slice that can, in theory, lead to false alarms. However, our experiments show that this approximation is actually very precise in practice: we have yet to find a false alarm in any of our experiments. Vector Clocking Vector clocks [19] are routinely used to capture causal partial orders in distributed and concurrent systems. A VC -based algorithm was presented in [26] to encode a conventional multithreaded-system “happen-before” causal partial order on the unsliced trace. We next adapt that algorithm to work on our sliced trace and thus to capture the sliced causality. Recall that a vector clock (VC ) is a function from threads to integers, VC : T → Int. We say that VC ≤ VC 0 iff ∀t ∈ T, VC(t) ≤ VC 0 (t). The max function on VCs is defined as: max(VC1 , ..., VCn )(t) = max(VC1 (t), ..., VCn (t)) ([26]). Before we explain our VC algorithm, let us introduce our event and trace notation. An event is a mapping of attributes into corresponding values. One event can be, e.g., e1 : (counter = 8, thread = t1 , stmt = L11 , type = write, target = a, state = 1), which is a write on location a with value 1, produced at statement L11 by thread t1 . One can include more information into an event by adding new attribute-value pairs. We use key(e) to refer to the value of attribute key of event 4
RV-Predict compresses traces to keep sizes manageable. Reversing the trace is done at logging time by outputting a buffer of events backwards into separate archives. The archives are then read by the trace slicer in reverse order.
RV'10, LNCS 6418, pp 136-152. 2010
e. To distinguish different occurrences of events with the same attribute values, we add a designated attribute to every event, counter, collecting the number of previous events with the same attribute-value pairs (other than the counter ). The trace for the vector clocking step is the ϕ-sliced trace ξϕ obtained in Section 4.1. Intuitively, vector clocks are used to track and transmit the causal partial ordering information in a concurrent computation, and are typically associated with elements participating in such computations, such as threads, processes, shared variables, messages, signals, etc. If VC and VC0 are vector clocks such that VC(t) ≤ VC’(t) for some thread t, then we can say that VC’ has newer information about t than VC. In our VC technique, every thread t keeps a vector clock, VCt , maintaining information about all the threads obtained both locally and from thread communications (reads/writes of shared variables). Every shared variable is associated with two vector clocks, one for writes (VCw x ) used to enforce the order among writes of x, and one for all accesses (VCax ) used to accumulate information about all accesses of x. They are then used together to keep the order between writes and reads of x. Every property event e found in the analysis is associated a VC attribute, which represents the computed causal partial order. We next show how to update these VCs when an event e is encountered during the analysis (the third case can overlap the first two; if so, the third case will be handled first): 1. type(e) = write, target(e) = x, thread(e) = t (the variable x is written in thread t) and x is a shared variable. In this case, the write vector clock VCw x is updated to reflect the newly obtained information; since a write is also an access, the access VC of x is also updated; we also want to capture that t committed a causally irreversible action, by updating its VC as well: a VCt ← VCax ← VCw x ← max(VCx , VCt ). 2. type(e) = read, target(e) = x, thread(e) = t (the variable x is read in t), and x is a shared variable. Then the thread updates its information with the write information of x (we do not want to causally order reads of shared variables!), and x updates its access information with that of the thread: a x VCt ← max(VCw x , VCt ) and then VCx ← max(VCa , VCt ). 3. e is a property event and thread(e) = t. In this case, let VC(e) := VCt . Then VCt (t) is increased to capture the intra-thread total ordering: VCt (t) ← VCt (t) + 1. 4.2 Race and Generic Property Detection The basic idea of race detection is simple: check for accesses to the same variable with incomparable VCs. However, it is easy to note that this has quadratic worst case complexity, because each access must be compared against every other access. Clearly, when billions of accesses may occur in a trace, this is unacceptable. Not only would this be unbearable slow, but it would be impossible to even fit the accesses in memory to perform the comparisons. To alleviate this, as well as to make it more easy to deal with streaming to and from the disk when memory is overfull, we use the idea of a window of comparisons, ignoring pairs of events that trivially cannot have incomparable
RV'10, LNCS 6418, pp 136-152. 2010
vector clocks. If at some point we note the second access, aT2 1 in thread T1 must occur after the fifth access, aT5 2 , in thread T2 we know that we do not need to check the aT2 1 against any further accesses in thread T2 because all accesses in a given thread must be totally ordered (and the traces are backwards). To implement this we use a set5 of search states. Each search state abstracts the notion of checking accesses in two threads. Each search state keeps an iterator to the list of accesses representing one of its two given threads. The algorithm begins by keeping search states for each pair of threads in a set (actually not all threads are known immediately, but we will elide this detail for ease of understanding). Each state is advanced by considering the accesses pointed to by each of its iterators. If the iterators are incomparable, three new search states are added to the set. One state where one iterator is advanced, one where the other iterator is advanced, and one where both iterators are advanced. If the two accesses are incomparable and are not protected by a shared lock, a race is reported. If, one the other hand, the vector clocks of the two accesses in question are ordered, only one of the iterators is advanced, for example, if the access in thread t of the search state must take place before the access in thread t0 , the iterator pointing to the access from thread t is advanced, and no other states are generated. This idea is easily extrapolated to generic property detection. One caveat, however, is that the iterators of the search states point to streams of monitoring events like those describes in Section 3 rather than accesses to shared variables. Also, rather than keeping iterators to only two threads in a search state, each search state keeps an iterator to every thread in the program. Each search state, additionally, keeps a reference to a monitor provided by the Prediction Monitor Library component of Fig. 1. When a search state is advanced, a new set of states is created and added to the overall set of states the same as for race detection, save that the advanced iterators are the subset of iterators with incomparable VCs, and that states that end up with the same monitor state are collapsed immediately into one chosen representative search state. For each search state thus generated, the event uncovered by advancing one of the iterators is given to its monitor to check for property violation or validation. While this is exponential in the worst case, in practice most search states are collapsed because they have identical monitor states and positions in the event stream. 4.3 Prediction Example Here we give a simple example of race prediction using RV-Predict: bash-3.2$ cat simple/Simple.java package simple; public class Simple extends Thread { static public int i = 1; public static void main(String[] args) { (new Simple()).start(); (new Simple()).start(); } public void run() { i++; 5
We must use a set to avoid duplicate search states, or the algorithm can quickly explode.
RV'10, LNCS 6418, pp 136-152. 2010
System.out.println(i); } }
This program creates two threads, each incrementing the shared variable i and then printing it. This program has two dataraces, one on the variable i and one on the output. All one has to do is to compile this program with javac and then pass the binary to RV-Predict: bash-3.2$ javac simple/Simple.java bash-3.2$ RV-Predict simple.Simple Instrumenting... ...Done Executing the instrumented code... 2 3 ...Done Running Race Detection... Determining race candidates The following are our race candidates: | java.io.PrintStream (instance #657291792) | simple.Simple.i Predicting for race candidate: java.io.PrintStream (instance #657291792) /--- Race found on java.io.PrintStream (instance #657291792) ---\ | Write at simple.Simple:10 | | Write at simple.Simple:10 | \---------------------------------------------------------------/ Predicting for race candidate: simple.Simple.i /--- Race found on simple.Simple.i ---\ | Read at simple.Simple:10 | | Write at simple.Simple:9 | \-------------------------------------/ ...Done bash-3.2$
Both races were detected from one run of the program, even though the observed run behaved normally (the output was 2,3). The different components of RV-Predict from Fig. 1 can be seen in the above output. “Execution the instrumented code” corresponds to the Logging component. “Instrumenting” and “Race Detection” are self-evident. 4.4
Prediction Results
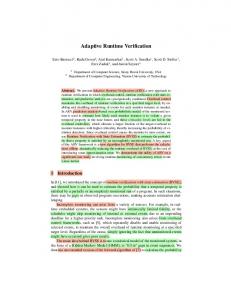
Fig. 8 summarizes the differences in real time and disk usage between the original jPredictor system first presented in [14] and RV-Predict for race prediction as measured on a system with two quad core Xeon E5430 processors running at 2.66GHz and 16 GB of 667 MHz DDR2 memory running Redhat Linux. On very small examples jPredictor occasionally outperforms RV-Predict, but on anything substantial RV-Predict is a vast improvement. Account, elevator, and tsp are actual programs used to benchmark parallel systems. Huge, medium, small, and the mixed locks examples are microbenchmarks that we designed to test particularly difficult aspects of race detection, such as millions of accesses to the same shared variable in huge.
RV'10, LNCS 6418, pp 136-152. 2010
jPredictor Name
RV-Predict
Input Real Time Disk Usage Real Time Disk Usage
account 0:02.07 elevator 5:55.29 tsp map4 2 5:30.87 tsp map5 2 10:10.19 tsp map10 2 8:25:04.00 huge crash medium crash small crash mixedlockshuge 8:13:40.00 mixedlocksbig 5:44.89 mixedlocksmedium 0:08.92 mixedlockssmall 0:05.46
236K 63M 16M 17M 442M crash crash crash 250M 25M 2.7M 1.5M
0:04.31 1:20.31 1:33.44 2:20.95 29:27.13 0:42.22 0:06.12 0:05.99 0:13.95 0:07.03 0:07.25 0:05.67
360K 864K 744K 868K 2.8M 13M 840K 292K 2.9M 496K 308K 296K
Fig. 8. jPredictor Vs. RV-Predict
References 1. Allan, C., Avgustinov, P., Christensen, A.S., Hendren, L.J., Kuzins, S., Lhot´ ak, O., de Moor, O., Sereni, D., Sittampalam, G., Tibble, J.: Adding trace matching with free variables to AspectJ. In: OOPSLA’05. pp. 345–364. ACM (2005) 2. Avgustinov, P., Tibble, J., de Moor, O.: Making trace monitors feasible. In: OOPSLA’07. pp. 589–608. ACM (2007) 3. Barringer, H., Goldberg, A., Havelund, K., Sen, K.: Rule-Based Runtime Verification. In: VMCAI’04. LNCS, vol. 2937, pp. 44–57 (2004) 4. Blackburn, S.M., Garner, R., Hoffman, C., Khan, A.M., McKinley, K.S., Bentzur, R., Diwan, A., Feinberg, D., Frampton, D., Guyer, S.Z., Hirzel, M., Hosking, A., Jump, M., Lee, H., Moss, J.E.B., Phansalkar, A., Stefanovi´c, D., VanDrunen, T., von Dincklage, D., Wiedermann, B.: The DaCapo benchmarks: Java benchmarking development and analysis. In: Object-Oriented Programming, Systems, Languages and Applications (OOPSLA’06). pp. 169–190. ACM (2006) 5. Chen, F., Meredith, P., Jin, D., Ro¸su, G.: Efficient formalism-independent monitoring of parametric properties. In: Automated Software Engineering (ASE ’09). IEEE (2009), to appear 6. Chen, F., D’Amorim, M., Ro¸su, G.: A formal monitoring-based framework for software development and analysis. In: Formal Engineering Methods (ICFEM’04). LNCS, vol. 3308, pp. 357–372 (2004) 7. Chen, F., D’Amorim, M., Ro¸su, G.: Checking and correcting behaviors of Java programs at runtime with JavaMOP. In: Runtime Verification(RV’06). ENTCS, vol. 144, pp. 3–20 (2006) 8. Chen, F., Ro¸su, G.: Towards monitoring-oriented programming: A paradigm combining specification and implementation. In: Runtime Verification(RV’03). ENTCS, vol. 89 (2003) 9. Chen, F., Ro¸su, G.: Java-MOP: A monitoring oriented programming environment for Java. In: Tools and Algorithms for the Construction and Analysis of Systems (TACAS’05). LNCS, vol. 3440, pp. 546–550 (2005) 10. Chen, F., Ro¸su, G.: MOP: An efficient and generic runtime verification framework. In: OOPSLA’07. pp. 569–588. ACM (2007)
RV'10, LNCS 6418, pp 136-152. 2010
11. Chen, F., Ro¸su, G.: Parametric and Sliced Causality. In: Computer Aided Verification (CAV’07). LNCS, vol. 4590, pp. 240–253. Springer (2007) 12. Chen, F., Ro¸su, G.: Parametric trace slicing and monitoring. In: Tools and Algorithms for the Construction and Analysis of Systems (TACAS’09). LNCS, vol. 5505, pp. 246–261 (2009) 13. Chen, F., Ro¸su, G.: Parametric and termination-sensitive control dependence extended abstract. In: Static Analysis Symposium (SAS’06) (2006) 14. Chen, F., S ¸ erb˘ anut¸˘ a, T.F., Ro¸su, G.: jPredictor: a predictive runtime analysis tool for Java. In: International Conference on Software Engineering (ICSE’08). pp. 221–230. ACM, New York, NY, USA (2008) 15. Drusinsky, D.: Temporal Rover (1997–2009), http://www.time-rover.com 16. Flanagan, C., Freund, S.N.: Atomizer: a dynamic atomicity checker for multithreaded programs. In: Principles of Programming Languages (POPL’04) (2004) 17. Goldsmith, S., O’Callahan, R., Aiken, A.: Relational queries over program traces. In: OOPSLA’05. pp. 385–402. ACM (2005) 18. Havelund, K., Ro¸su, G.: Monitoring Java programs with Java PathExplorer. In: Runtime Verification(RV’01). ENTCS, vol. 55 (2001) 19. Lamport, L.: Time, clocks, and the ordering of events in a distributed system. Comm. of ACM 21(7), 558–565 (1978) 20. Martin, M., Livshits, V.B., Lam, M.S.: Finding application errors and security flaws using PQL: a program query language. In: OOPSLA’07. pp. 365–383. ACM (2005) 21. Meredith, P., Jin, D., Chen, F., Ro¸su, G.: Efficient monitoring of parametric contextfree patterns. In: Automated Software Engineering (ASE ’08). pp. 148–157. IEEE (2008) 22. O’Callahan, R., Choi, J.D.: Hybrid dynamic data race detection. In: ACM SIGPLAN Symposium on Principles and Practice of Parallel Programming (PPoPP’03) (2003) 23. von Praun, C., Gross, T.R.: Object race detection. In: Object Oriented Programming, Systems, Languages, and Applications (OOPSLA’01) (2001) 24. Savage, S., Burrows, M., Nelson, G., Sobalvarro, P., Anderson, T.: Eraser: a dynamic data race detector for multithreaded programs. ACM Transaction of Computer System 15(4), 391–411 (1997) 25. Sen, A., Garg, V.K.: Detecting temporal logic predicates in distributed programs using computation slicing. In: International Conference on Principles of Distributed Systems (OPODIS’03) (2003) 26. Sen, K., Ro¸su, G., Agha, G.: Runtime safety analysis of multithreaded programs. In: ACM SIGSOFT Symposium on Foundations of Software Engineering (FSE’03) (2003) 27. Wang, L., Stoller, S.D.: Accurate and efficient runtime detection of atomicity errors in concurrent programs. In: ACM SIGPLAN Symposium on Principles and Practice of Parallel Programming (PPoPP’06) (2006)