In our research, we aim at scalable ER approaches for Big Data that are able to ... with large data volumes and multiple data sources. .... 8 Bertha Summeahville.
Comparative Evaluation of Distributed Clustering Schemes for Multi-source Entity Resolution Alieh Saeedi, Eric Peukert, Erhard Rahm Database Group, Department of Computer Science, University of Leipzig {saeedi, peukert, rahm}@informatik.uni-leipzig.de
Abstract. Entity resolution identifies semantically equivalent entities, e.g., describing the same product or customer. It is especially challenging for big data applications where large volumes of data from many sources have to be matched and integrated. Entity resolution for multiple data sources is best addressed by clustering schemes that group all matching entities within clusters. While there are many possible clustering schemes for entity resolution, their relative suitability and scalability is still unclear. We therefore implemented and comparatively evaluate distributed versions of six clustering schemes based on Apache Flink within a new entity resolution framework called Famer. Our evaluation for different real-life and synthetically generated datasets considers both the match quality as well as the scalability for different number of machines and data sizes.
1
Introduction
Entity resolution (ER) – also called deduplication, record linkage or object matching is the task of identifying records that refer to the same real-world entity, such as specific costumers, products or publications. This problem is of key importance for improving data quality and for integrating data from multiple sources. Numerous approaches for entity resolution have been developed and investigated [4, 13]. They derive match decisions typically based on the combined similarity of several attribute values and possibly on the contextual similarity of entities (for example, two publications may match if they have both highly similar titles and co-authors). To achieve high efficiency for large datasets, one has to avoid comparing each entity to all other entities. This is achieved by so-called blocking strategies [4] where only records within the same block (partition) need to be compared with each other, e.g., only publications from the same year. Entity resolution can also be performed in parallel on multiple processors and computing nodes to achieve additional performance improvements [12]. Most previous ER approaches compare pairs of entities and determine binary match mappings consisting of all correspondences or links between two matching entities. This is a natural approach when one has to integrate only a few data sources but it does not scale well since the number of binary mappings grows quadratically with the number of sources. As a result, integrating data from 200 sources would require the determination (and maintenance) of 19.900 mappings which is not practically feasible with today’s ER tools. Grouping all matching entities within single clusters is a better approach for integrating data from multiple data sources as it allows a more compact match representation than with binary links [15, 17]. It also simplifies the fusion of the
matching entities for data integration by combining and consolidating the attributes values of the different cluster members. Furthermore, it allows an incremental integration of additional entities and data sources by comparing them with the set of previously determined clusters. In our research, we aim at scalable ER approaches for Big Data that are able to deal with large data volumes and multiple data sources. We therefore need ER approaches that support clustering matching entities and exploit both blocking and distributed (parallel) processing. For this study, we implemented distributed versions of six previously proposed clustering techniques to analyze their quality and scalability. The considered clustering schemes require as input a so-called similarity graph containing all links between matching entities and try to find additional links by considering indirect matches and to eliminate weaker links in favor of more plausible ones. The clustering schemes are part of a new framework called FAMER (FAst Multi-source Entity Resolution system) for distributed multi-source entity resolution. Famer is implemented on top of the distributed dataflow framework Apache Flink to achieve a high scalability to large amounts of data and many machines. In the next section, we briefly discuss related work. In Section 3, we provide an overview about our ER framework Famer. Section 4 describes the considered clustering algorithms and their distributed implementation. In Section 5, we evaluate the match quality and scalability of the approaches for different datasets. Section 6 concludes.
2
Related Work
There is a huge literature about ER and there are several books and surveys to provide an overview about the main methods and tools, e.g., [13, 4]. The parallel implementation of ER methods has also been studied but mainly for MapReduce (e.g., [12]). Only few studies considered more recent Big Data frameworks such as Apache Flink or Apache Spark [14] but not yet for clustering-based ER schemes. Our distributed ER framework will build on known blocking and matching techniques (see next section) and their parallel implementation using Apache Flink. Previous clustering approaches for ER [2, 3, 16, 8, 7] first determine a pairwise matching between entities and apply clustering within a post-processing step. The most straight-forward clustering approach is computing connected components based on the transitive closure of binary match links. This approach can often improve recall by identifying indirectly matching entities but may lead to poor precision since indirect matches may not be similar enough to really represent the same real-word object. For our evaluation, we use connected components as the base strategy and consider five additional clustering schemes that have proven to be effective in previous studies. In particular, we study parallel versions of correlation clustering [3], Center [8], Merge Center [8], and two versions of Star [1] clustering. Previous evaluations such as in [7] did not consider parallel clustering schemes and focused on clustering within single datasets rather than across multiple data sources.
3
Famer framework for multi-source entity resolution
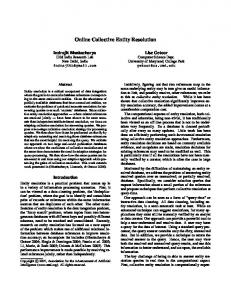
Fig. 1 illustrates the main components and processing steps of the Famer framework for distributed multi-source entity resolution. The components are similar to the ones in
Fig. 1: Overview of the Famer approach for multi-source entity resolution previous entity resolution tools but support more than two sources and are implemented in Apache Flink to achieve a parallel execution for high scalability. The input of Famer are thus multiple data sources with the entities to be matched and clustered. The output is a collection of clusters where all entities within a cluster match with each other and different clusters refer to different real-world objects. In this paper, we assume that all sources are duplicate-free1 so that we only have to find matching entities between sources. The final match clusters should thus only contain entities from different sources so that the maximal cluster size is limited by the number of sources. All entities of a cluster are assumed to match with each other, so that a cluster of m entities represents m·(m−1) match pairs. 2 Famer consists of two main parts (Fig. 1): generation of a similarity graph based on pairwise matches and clustering. The first component has several steps (blocking, pairwise comparison, match classification), which can be customized according to a configuration input. We provide more details on the different steps below. We also illustrate the workflow of our framework for the person records in Table 1 that originate from four sources and contain erroneous attribute values as typical for real-world data. The table groups already the duplicate records referring to the same person. In the first phase, we start with a blocking step to reduce the number of comparisons compared to a na¨ıve approach where each entity of a data source has to be compared against all entities of any other source. We support different blocking techniques such as Standard Blocking (SB) and Sorted Neighborhood as well as single- and multi-pass blocking [4]. For SB, which we will use in our evaluation, entities are partitioned into blocks by a predefined blocking key (to be provided in the configuration input) on attribute values such that only entities with the same blocking key need to be compared with each other. For the person records in Table 1, we assume that the two initial letters of the surnames form the blocking key. Table 2 shows the resulting blocking key values and blocks sharing the same key value. For this example, blocking reduces the number of comparisons from 55 to only 16. On the other hand, we may now miss some matches if similar entities are assigned to different blocks (e.g., entity with id 1 is not paired with entities 0, 2, and 3). Multi-pass blocking can reduce this problem (at the expense of more comparisons) by partitioning the entities according to multiple blocking keys. After blocking, all entities of a block from any of the input data sources are pairwise compared with each other. For each entity pair we compute the similarity of their 1
This is not a main restriction since we could first deduplicate the individual data sources before applying the workflow.
Table 1: Sample person entities from evaluation dataset DS3. Id 0 1 2 3 4 5 6 7 8 9 10 11
Name Surname Suburb Post code SourceId ge0rge Walker winston salem 271o6 Src1 George Alker winstom salem 27106 Src2 George Walker Winstons 27106 Src3 Geoahge Waker Winston 271oo Src4 Bernie Davis pink hill 28572 Src1 Bernie Daviis Pinkeba 2787z Src2 Bernii Davs pink hill 28571 Src3 Bertha Summercille Charlotte 28282 Src1 Bertha Summeahville Charlotte 2822 Src2 Brtha Summerville Charlotte 28222 Src4 Bereni dan’lel Pinkeba 27840 Src3 Bereni Dasniel Pinkeba 2788o Src4
Table 2: Keys Id 0 2 3 1 4 5 6 10 11 7 8 9
Key wa wa wa al da da da da da su su su
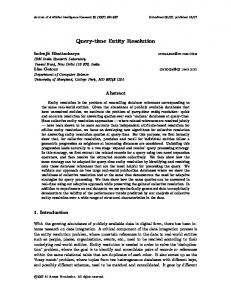
attribute values for the attributes and similarity functions specified in the configuration input. These similarity values are used in the following match classification step to decide about whether or not a pair of entities is assumed to match. The classification approach is also specified in the configuration input, e.g., by match rules specifying the required minimal similarity for the considered attributes. The output of this step is the set of matching entity pairs (links) together with a combined similarity value per link. This output is stored as a similarity graph where entities are represented as vertices and match links as edges. The clustering step of Famer aims at grouping together all matching vertices of the similarity graph based on the link structure of the graph and possibly the similarity values. Clustering algorithms typically try to group entities such that the similarity between entities within a cluster is maximized while the similarity between entities of different clusters is minimized. Compared to the similarity graph, the clustering algorithm can ideally add all missing matches (links) and remove all wrong links. The clustering algorithms we implemented and evaluated are described in Section 4. Fig. 2 illustrates the results of the described workflow for the sample entities of Table 1 and the blocking using SB as shown in Table 2. The entities are pairwise compared within the blocks and a rule-based match classification is applied resulting in the similarity graph shown in the middle of Fig. 2. Compared to the matches assumed in Table 1, the graph misses some links between matching entities, e.g., between 0 and 2. The final clustering determines five fully connected graphs (clusters) which are meant to represent different entities. For the example, the clusters include links missing in the
Fig. 2: Applying Famer to the data of Table 1.
similarity graph. Compared to Table 1, all clusters are correctly found except for the singleton cluster with entity 1 that was not matched with matching entities 0, 2 and 3 due to the assumed blocking approach. Famer is implemented using Apache Flink and a new extension for graph analytics called Gradoop [11]. Hence, all match and clustering approaches can be executed in parallel on clusters of variable size. Gradoop supports an extended property graph model so that we store the attribute values of entities as key value properties. Analogously, the similarity values of matching entity pairs are represented as edge properties. For the implementation of the parallel clustering schemes we also use the Gelly library of Flink supporting a so-called vertix-centric programming of graph algorithms (see next section).
4
Clustering approaches
In this section, we present the considered clustering approaches for entity resolution and their parallel implementation. As described in the previous section, all algorithms use as input a similarity graph with entities from multiple data sources and similarity edges indicating the computed degree of similarity. In addition to the computation of connected components, Famer supports parallel versions of the Center clustering, Merge Center clustering, two versions of Star clustering, and correlation clustering. The parallel implementations are based on a vertex-centric programming model, also known as ‘think like a vertex’, to iteratively execute a user-defined program in parallel over all vertices of a graph. In particular, we use the two-step Scatter-Gather model of Gelly that breaks up vertex programming into two functions. In the Scatter step, a value is distributed to all vertex neighbors, and in the Gather step the inputs from the neighbors are collected to update the state of a vertex. The computation proceeds in synchronized iteration steps, called supersteps. Each scatter and each gather execution is performed in a different superstep. Supersteps are executed synchronously, so that messages sent during one superstep are guaranteed to be delivered in the beginning of the next superstep [10]. The vertex functions are executed by a configurable number of worker nodes among which the graph data is partitioned, e.g., according to a hash or range partitioning on the vertex ids. We will explain the vertex-centric implementation in detail for one of the clustering schemes (Center); the other implementations follow similar approaches. 4.1 Connected components The subgraphs of a graph that are not connected to each other are called connected components. Having the input similarity graph, the connected components are easy to determine in a vertix-centric way by letting every vertex iteratively add all its direct neighbors to its cluster. The approach is therefore easy to implement with Scatter-Gather (as shown in [10]). In the evaluation, we use this approach as a baseline for the comparison with the other clustering schemes. 4.2 Center clustering In contrast to connected components, the Center clustering algorithm [8] utilizes the similarity values (weights) of the edges in the similarity graph. In the sequential algorithm, edges are first sorted based on these weights in descending order and put in a
queue. Edges are then removed from the queue and processed one by one. For each edge e(vi ,vj ) , if both vi and vj are unassigned to any cluster, one of them will be center and the other will belong to the cluster of that center. If one of them is center and the other is unassigned, the unassigned vertex will belong to the cluster of the center vertex. If both vertices are centers or both of them are non-centers, or one of them is non-center and the other is unassigned, that edge is ignored. Algorithm 1: Parallel Center 1
2 3 4 5
Data: G = (V, E) assignVertexPriorities(V ) /* priority according to a random permutation of vertices */ Center ← {} for vi ∈ V in Parallel do repeat vnn ← argmax(e(vi ,vj ) ) j
6 7 8
if (vnn ∈ Center) then vi .SetClusterId(nn) V ← V − {vi }
10
else if (vnn ∈ / V ) then E ← E − {e(vi ,vnn ) }
11
else
9
12
vk ← argmax(e(vnn ,vj ) )
13
if ((i = k ∧ i > nn) ∨ (vnn = N ull)) then Center ← Center ∪ {vi } vi .SetClusterId(i) V ← V − {vi }
j
14 15 16 17
until (vi ∈ V )
We propose and implemented a parallel version of the Center algorithm (see Algorithm 1). In each round of the algorithm for all unassigned vertices, the outgoing edge with the highest weight must be found. The vertices on both sides of this edge are then processed. If one of them is center, the other will belong to the cluster of that vertex (lines 6-8). If one of them is assigned to another cluster (line 9), i.e, both vertices belong to different clusters, the edge between these two vertices is removed (line 10). If both vertices are unassigned and the edge between them is for both the outgoing edge with the highest weight (line 13, i = k), then one of them is assumed as center (line 14) and the other will belong to the same cluster in the next round. For selecting the center in this case we make use of initially assigned (line 1) vertex priorities as done in the sequential algorithm. Hence, the vertex with higher priority is considered as center (line 16, i > nn). If a vertex is not connected to any other vertex (line 13, vnn = N ull), it is a singleton. The algorithm iterates until all vertices are assigned to a cluster (line 17). We implemented parallel Center using the Scatter-Gather model (see Algorithm 2). The algorithm applies two phases that are iteratively executed for all vertices. Phase 1 (Scatter1, Gather1) finds for each vertex vi its neighboring vertex with the currently
Algorithm 2: Parallel Center with ScatterGather Data: G = (V, E)
1 2
3 4 5 6 7 8 9 10 11 12 13 14 15 16 17 18
19
20 Procedure Scatter2 (Vertex v) Algorithm Center 21 msg.Src ← v.getId() assignVertexPriorities(V ) 22 msg.N N ← v.getN N () /* set priority according to a 23 msg.P riority ← v.getP riority() random permutation of vertices */ 24 for (e ∈ getOutEdges()) do for (vi ∈ V ) do 25 msg.W eight ← e.getW eight() vi .K ← 1 26 sendM essageT o(edge.target(), msg) end 27 end repeat 28 Procedure Gather2 (Vertex v, MessageIterator messages) Phase1: Scatter1 (Vertex) 29 Array ← messages.Sort() Gather1 (Vertex, MessageIterator) /* sorted based on weights Phase2: Scatter2 (Vertex) descendingly */ Gather2 (Vertex, MessageIterator) 30 for (i : v.K → Array.Size()) do until (V 6= {}) 31 m ← Array[i] 32 if (m.getSrc().isCenter()) then Procedure Scatter1 (Vertex v) for (e ∈ getOutEdges()) do 33 v.ClustereId ← m.getId() msg.Src ← v.getId() 34 v.assigned ← true msg.W eight ← e.getW eight() 35 break sendM essageT o(edge.target(), msg) 36 end end 37 else if (m.getSrc().isAssigned()) then v.K + + Procedure Gather1 (Vertex v, MessageIterator messages) 38 39 end Array ← messages.Sort() 40 else if (v.NN= Null ∨ (v.NN = m.getSrc() ∧ /* Messages are sorted based on v.Priority > m.getPriority()) ) then their weights descendingly */ 41 v.ClustereId ← m.getSrc() v.N N ← Array[v.K].getSrc() 42 v.center ← true 43 v.assigned ← true 44 break 45 end 46 end
highest edge weight, and phase 2 (Scatter2, Gather2) processes the status of the found vertex and assigns vi to an existing cluster or considers it as a center. Again, we initially assign a priority per vertex (line 3). In phase 1, for each vertex vi the neighbor with the K-highest edge weight (nearest neighbor NN) is found (lines 13-21). K is a helper variable. It helps to prevent that already assigned vertices are chosen again as neighbor. It is attached to each vertex and initialized with 1 (lines 5-7). It will be incremented in phase 2 when a vertex neighbor has been assigned to a cluster (lines 39-41). In phase 2, all neighbors of a vertex vi are sorted and processed in descending order of the edge weights (for the edge to vi ) (lines 32-38). Then vertex vi is set as center similar to Algorithm 1 (lines 42-47). 4.3 Merge Center The Merge Center clustering algorithm [8] is a modified version of Center. In contrast to Center, it merges two clusters if a vertex in one cluster is similar to the center of another cluster. Our parallel implementation for Merge Center is very similar to parallel Center but applies an extra iteration for merging clusters. This iteration is initiated right after all vertices are assigned to a cluster. The merge processing is repeated until there are no further cluster changes. 4.4 Star clustering The Star clustering algorithm [1] initially computes the degree for each vertex of the similarity graph. Then in each iteration, the unassigned vertex with the highest degree
Algorithm 3: Parallel Star 1
2 3 4 5
Data: G = (V, E) V ← {v1 , ..., vn } /* A random permutation of vertices Center ← {} repeat for (vi ∈ V ) in Parallel do vmax ← argmax (ComputeDegree(vj )))
*/
vj ∈{vj |e(vi ,vj )∈E}∪{vi }
6 7 8 9 10 11 12
13
if (vi = vmax ) then Center ← Center ∪ {v} for (vi ∈ V ) in Parallel do for (e(vi , vj ) ∈ E) do if (vj ∈ Center) then vi .addClusterId(vj .getId()) V ← V − {vi } until (V 6= {})
becomes center and all its direct neighbors are assigned to its cluster. The algorithm terminates when all vertices are assigned to a cluster. In contrast to all other clustering approaches, Star clustering can result in overlapping clusters. As a consequence, it introduces the need of a post-processing to select the best cluster for entities that have been assigned to several clusters. Our parallel version of the Star algorithm is described in Algorithm 3. Initially, the degree of all vertices is computed and if the degree of a vertex is greater than the degree of all its neighbors, that vertex becomes a center (lines 4-7). If the degree of two adjacent vertices is equal, the one with higher priority is assumed as center. Similar to the previous parallel algorithms, vertex priority is initially determined by generating a random permutation of vertices (line 1). Then each center and all its neighbors are considered as a cluster. (lines 8-12). The Scatter-Gather version of Algorithm 3 uses three phases. In the first phase the degree of each vertex is computed. In the second phase, centers are selected, and in the final phase, clusters are grown around centers. We use two methods for computing the degree of vertices resulting into algorithms Star-1 and Star-2. For Star-1, we count the number of outgoing edges of a vertex, while Star-2 is based on the average similarity degrees of the outgoing edges of a vertex. 4.5 Correlation Clustering The original correlation clustering approach [2] uses a graph with positive and negative edge weights to indicate whether two vertices are similar (positive edge weight) or dissimilar (negative edge weight). The goal is to find a clustering that either maximizes agreements (sum of positive edge weights within a cluster plus the absolute value of the sum of negative edge weights between clusters) or minimizes disagreements (absolute value of the sum of negative edge weights within a cluster plus the sum of positive edge weights across clusters). Gionis et al. propose an approximate and iterative solu-
tion for this optimization problem [6] that randomly selects an unassigned vertex as a cluster center in each round. Then all unassigned neighbors of the selected center are added to the cluster and marked as assigned. The algorithm terminates when there is no unassigned vertex left. This simple algorithm suffers from too many rounds making it unsuitable for very large graphs. Some studies therefore proposed parallel solutions [3, 16] that select multiple centers in each round. They also address the newly introduced concurrency problem to avoid that a vertex is assigned to more than one center at a time. We implemented the parallel pivot approach of [3], called CCPivot, since it fits well the Scatter-Gather paradigm. In each round of this algorithm, several vertices are considered as active nodes, i.e., as candidates for becoming a cluster center (or pivot). In the next step, active nodes that are adjacent to each other are removed from the set of active nodes; the remaining vertices become centers. Then adjacent vertices of each center are assigned to that center and form a cluster. If one vertex is adjacent of more than one center at the same time, it will belong to the one with higher priority. As in the other algorithms, the vertex priorities are determined in a preprocessing phase. Our Scatter-Gather implementation of this algorithm uses three Scatter-Gather phases: one for computing the current maximum degree of the graph, one for selecting active nodes and applying the concurrency-aware rule to select final centers, and one for growing clusters around centers.
5
Evaluation
The goal of our evaluation is to comparatively evaluate the effectiveness and efficiency of the considered clustering approaches and their distributed implementations for different datasets and configurations. We first describe the used datasets from three domains and the considered configurations. We then analyze the relative match and clustering effectiveness of the clustering schemes. Finally we evaluate the runtime performance and scalability of the approaches. 5.1 Datasets and configuration setup For our evaluation we use datasets from three domains for different numbers of duplicatefree sources. Table 3 shows the main characteristics of the datasets in particular the number of clusters and match pairs of the perfect ER result. The smallest dataset DS1 contains geographical real-world entities from four different data sources (DBpedia, Geonames, Freebase, NYTimes) and has already been used in the OAEI competition2 . For our evaluation we focused on a subset of settlement entities as we had to manually determine the perfect clusters and thus the perfect match pairs. For the two larger evaluation datasets DS2 and DS3 we applied advanced data generation and corruption tools [9] to be able to evaluate the ER quality and scalability for larger datasets and a controlled degree of corruption. DS2 is based on real records about songs from the MusicBrainz database but uses the DAPO data generator to create duplicates with modified attribute values [9]. The generated dataset consists of five sources and contains duplicates for 50% of the original records in two to five sources. All duplicates are generated with a high degree of corruption to stress-test the ER and 2
OAEI 2011 IM: http://oaei.ontologymatching.org/2011/instance/
Table 3: The specifications of datasets. domain
attributes
#entities
#sources
#clusters
4
#perfect match pairs 4,391
geographical (DS1) music (DS2) persons (DS3)
label, longitude, latitude
3,054
title, length, artist, album, year, language name, surname, suburb, postcode
20,000
5
16,250
10,000
5,000,000 10,000,000
5 10
3,331,384 14,995,973
3,500,840 6,625,848
820
clustering approaches. DS3 is based on real person records from the North-Carolina voter registry and synthetically generated duplicates using the tool GeCo [5]. We consider two configurations with either 5 or 10 sources each having 1 million entities; i.e. we process up to 10 million person records. Each source is duplicate free, but 50% of the entities are replicated in all sources without any corruption. Moreover, 25% of entities are corrupted and replicated in all sources, and the remaining 25% are corrupted but present in only some sources. For the generation of corrupted records we applied a moderate corruption rate of 20%, i.e., most attribute values remained unchanged. To generate the similarity graphs for the different datasets as the input of the clustering schemes we experimented with a large spectrum of blocking and match configurations. Due to space restrictions, we will mostly report results only for the default configurations specified in Table 4 that resulted already in good match quality even without clustering. All configurations apply standard blocking with different blocking keys. The match rules compute different attribute similarities using either string similarity functions (Jarowinkler, 3gram) or geographical distance as well as variable similarity thresholds θ. 5.2 Match quality of clustering approaches To evaluate the ER quality of our clustering results we use the standard metrics precision, recall and their harmonic mean, F-Measure. These metrics are determined by comparing the computed match pairs (derived from the computed clusters assuming that all entities in a cluster match) with the perfect match results. In Fig. 3, we compare the obtained precision, recall and F-measure results for the six clustering schemes, different similarity thresholds θ and our three datasets using the default configurations from Table 4 to determine the initial similarity graphs. On the left, we also show the precision, recall and F-measure values obtained already with the similarity graphs. We observe that for DS1 and DS3 we achieve a relatively high Fmeasure of more than 0.9 and 0.8 for the considered θ range between 0.75 and 0.9. By contrast, for the noisy data records of DS2 we had to lower the similarity thresholds to Table 4: Default blocking and match configuration for different datasets. dataset DS1 DS2 DS3
blocking key prefixLength1(label) prefixLength1(album) prefixLength3(surname)
similarity functions sim1: Jarowinkler (name) sim2: geographical distance sim1: 3Gram (title) sim1: Jarowinkler (name) sim2: Jarowinkler (surname) sim3: Jarowinkler (suburb) sim4: Jarowinkler (postcode)
match rule sim1 ≥ θ & sim2 ≤ 1358 km sim1 ≥ θ sim1≥ 0.9 & sim2 ≥ 0.9 & sim3 ≥ θ & sim4 ≥ θ
values between 0.35 and 0.45 and still could not exceed a maximal F-measure of 0.73 underlining that DS2 represents a more difficult match problem than DS1 or DS3. Comparing the clustering schemes, we observe that there are substantial differences in their relative match quality. Connected components reaches the lowest F-measure for all datasets and almost all threshold values because it suffers from very poor precision values. Merge Center (MCenter) shows a similar behavior in terms of poor precision and F-measure, indicating that the merging of clusters can often lead to wrong cluster decisions. From the four better clustering schemes, Star-1 has the lowest F-measure (especially for lower values of the similarity threshold values) while the other three are close together and relatively robust against changes in the threshold value. These approaches, Center, Star-2 and CCPivot, achieve not only a high recall but also a good precision for lower thresholds. For higher thresholds they can further improve precision by smartly eliminating only wrong matches while keeping almost all correct ones. The high quality of Center comes from its initial focus on edges with high weights thereby ignoring edges with lower similarity. Star-2 is better than Star-1 since its degree-based selection of cluster centers is based on a high degree of similarity to neighbors rather than only the number of neighbors. CCPivot is apparently also able to select high quality clusters.
Precision
Recall
DS3-10 Parties
DS2
DS1
Input Graph
Fig. 3. Match quality of clustering-based ER approaches.
F-Measure
DS1
DS2
DS3
Fig. 4. Average F-measure results with range between minimal and maximal values
These observations are confirmed by Fig. 4 showing the average F-measure results of the clustering schemes over all threshold configurations. The vertical lines also show the F-measure spread between the minimal and maximal value. We again observe the low and highly variable match quality of connected components and MergeCenter. By contrast, the algorithms CCPivot, Center, and Star-2 are more robust and achieve the highest F-measure values. 5.3 Runtimes and speedup We determined the runtimes of the clustering algorithms on a cluster with 16 worker nodes. Each worker consists of an E5-2430 6(12) 2.5 Ghz CPU, 48 GB RAM, two 4 TB SATA disks and runs openSUSE 13.2. The nodes are connected via 1 Gigabit Ethernet. Our evaluation is based on Hadoop 2.6.0 and Flink 1.1.2. We run Apache Flink
dataset #workers ConCom CCPivot Center MCenter Star-1 Star-2
Table 5: Runtimes (seconds) DS3 - 5 parties DS3 - 10 parties 4 8 16 4 8 16 51 57 55 101 79 79 1530 1008 688 – – 1303 390 208 117 1986 864 423 640 349 194 3767 1592 695 288 149 85 783 367 197 214 124 67 720 317 173
a. Speedup (DS3-5 parties)
b. Speedup (DS3-10 parties)
Fig. 5. Runtimes and speedup
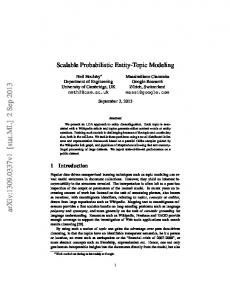
standalone with 6 threads and 40 GB memory per worker. In our experiments, we vary the number of workers by setting the parallelism parameter to the respective number of threads (e.g., 4 workers correspond to 24 threads). The runtime of all algorithms is measured for the largest dataset DS3 with 5 and 10 parties applying the configuration from Table 4 with θ = 0.80. The DS3 input datasize is thus doubled for 10 parties compared to 5 parties. We only evaluate the runtimes for the clustering algorithms since the time to determine the similarity graphs is the same for all clustering approaches. Some clustering approaches could not be executed for 1 or 2 workers only due to high memory requirements. We thus evaluate the runtimes for configurations between 4 and 16 workers. Table 5 shows that the runtimes for the two DS3 datasets. The increased dataset size for 10 parties leads to higher runtimes for all algorithms although to different degrees. As expected, the fastest runtimes are achieved by the simple connected components approach. By contrast, CCPivot has the worst runtimes due to large memory requirements and a high message overhead. For the bigger dataset (10 parties) the approach suffered from out-of-memory errors and could only be executed for 16 workers. From the three clustering schemes achieving the best matching quality (Star-2, Center, CCPivot), Star2 achieves by far the fastest runtimes in all configurations making it a good default strategy for clustering. Except for connected components, all algorithms can reduce their runtimes by applying more workers, especially for the larger dataset with 10 parties. Fig. 5 shows the resulting speedup values. For DS3 with 5 parties, all algorithms except the slow CCPivot achieve an almost linear speedup. For the bigger dataset with 10 parties, speedup values are even better and partly super-linear. The latter, however, is an artifact for the slower algorithms like MCenter that perform poorly for 4 workers because of memory bottlenecks (its runtime for 4 workers is almost 6 times higher for 10 parties than for 5 parties). The substantially increased aggregate memory capacity for 8 and 16 workers thus enabled super-linear runtime improvements but without reaching the absolute runtimes of fast algorithms like Star-2.
6
Conclusions and outlook
We presented a new framework called Famer enabling the parallel execution of ER workflows using the Big Data framework Apache Flink. Famer supports entity resolution for multiple data sources and groups all matching entities within clusters. For parallel clustering we currently support six approaches that have been evaluated for datasets from three domains. The evaluation showed that three clustering approaches (Center, Star-2 and CCPivot correlation clustering) achieve a similarly high match quality that is clearly superior to a simple connected components scheme. The parallel implementations of the clustering approaches mostly achieve good speedups, especially for larger datasets thereby supporting high scalability. Star-2 achieves lower runtimes than Center and especially CCPivot so that it is a good default approach for clustering-based ER. In future work, we will further extend and improve Famer, e.g., by post-processing cluster results to find additional matches or resolve overlapping clusters for Star clustering. We also aim at developing incremental ER strategies that can incorporate new entities and data sources into already existing clusters.
Acknowledgement This work was partly funded by the German Federal Ministry of Education and Research within the project Competence Center for Scalable Data Services and Solutions (ScaDS) Dresden/Leipzig (BMBF 01IS14014B). Also, evaluations partly performed on the Galaxy-Infrastructure at Leipzig University.
References 1. J. Aslam, E. Pelekhov, and D. Rus. The star clustering algorithm for static and dynamic information organization. J. Graph Algorithms Appl., 8:95–129, 2004. 2. N. Bansal, A. Blum, and S. Chawla. Correlation clustering. In Proc. Foundations of Computer Science, pages 238–247. IEEE, 2002. 3. F. Chierichetti, N. Dalvi, and R. Kumar. Correlation clustering in MapReduce. In Proc. ACM SIGKDD conf., pages 641–650, 2014. 4. P. Christen. Data matching: concepts and techniques for record linkage, entity resolution, and duplicate detection. Springer, 2012. 5. P. Christen and D. Vatsalan. Flexible and extensible generation and corruption of personal data. In Proc. CIKM, pages 1165–1168, 2013. 6. A. Gionis, H. Mannila, and P. Tsaparas. Clustering aggregation. ACM Trans. on Knowledge Discovery from Data (TKDD), 1(1):4, 2007. 7. O. Hassanzadeh, F. Chiang, H. Lee, and R. Miller. Framework for evaluating clustering algorithms in duplicate detection. PVLDB, 2(1):1282–1293, 2009. 8. O. Hassanzadeh and R. Miller. Creating probabilistic databases from duplicated data. The VLDB Journal, 18(5):1141–1166, 2009. 9. K. Hildebrandt, F. Panse, N. Wilcke, and N. Ritter. Large-scale data pollution with Apache Spark. IEEE Transactions on Big Data, 2017. 10. M. Junghanns, A. Petermann, M. Neumann, and E. Rahm. Management and analysis of big graph data: Current systems and open challenges. In Handbook of Big Data Technologies, pages 457–505. 2017. 11. M. Junghanns, A. Petermann, N. Teichmann, K. G´omez, and E. Rahm. Analyzing extended property graphs with Apache Flink. In Proc. ACM SIGMOD Workshop on Network Data Analytics, 2016. 12. L. Kolb, A. Thor, and E. Rahm. Dedoop: Efficient deduplication with Hadoop. PVLDB, 5(12):1878–1881, 2012. 13. H. K¨opcke and E. Rahm. Frameworks for entity matching: A comparison. Data & Knowledge Engineering, 69(2):197–210, 2010. 14. D. Mestre, C. Pires, D. Nascimento, A. deQueiroz, V. Santos, and T. Araujo. An efficient Spark-based adaptive windowing for entity matching. Journal of Systems and Software, 128:1–10, 2017. 15. M. Nentwig, A. Groß, and E. Rahm. Holistic entity clustering for linked data. In IEEE ICDMW, 2016. 16. X. Pan, D. Papailiopoulos, S. Oymak, B. Recht, K. Ramchandran, and M. Jordan. Parallel correlation clustering on big graphs. In Advances in Neural Information Processing Systems, pages 82–90, 2015. 17. E. Rahm. The case for holistic data integration. In Proc. ADBIS, pages 11–27. Springer LNCS, 2016.