from telecommunications, automotive electronics, robotics, industrial control to .... for current and future industrial practice, as the time interval between successive ..... in the TDMA round slot S3 on which node N3 communicates. Thus, the ...
(1) TVLSI-00246-2002.R1
Scheduling and Mapping in an Incremental Design Methodology for Distributed Real-Time Embedded Systems Paul Pop, Petru Eles, Zebo Peng, Traian Pop Dept. of Computer and Information Science Linköping University, Sweden E-mail: {paupo, petel, zebpe, trapo}@ida.liu.se Abstract—In this paper we present an approach to mapping and scheduling of distributed embedded systems for hard realtime applications, aiming at a minimization of the system modification cost. We consider an incremental design process that starts from an already existing system running a set of applications. We are interested to implement new functionality such that the timing requirements are fulfilled, and the following two requirements are also satisfied: the already running applications are disturbed as little as possible, and there is a good chance that, later, new functionality can easily be added to the resulted system. Thus, we propose a heuristic which finds the set of already running applications which have to be remapped and rescheduled at the same time with mapping and scheduling the new application, such that the disturbance on the running system (expressed as the total cost implied by the modifications) is minimized. Once this set of applications has been determined, we outline a mapping and scheduling algorithm aimed at fulfilling the requirements stated above. The approaches have been evaluated based on extensive experiments using a large number of generated benchmarks as well as a real-life example. Index Terms—Distributed embedded systems, real-time systems, process scheduling, process mapping, incremental design.
I. INTRODUCTION Complex embedded systems with multiple processing elements are becoming common in various application areas from telecommunications, automotive electronics, robotics, industrial control to medical equipment and multimedia. Such systems have to fulfil strong requirements in terms of performance and cost efficiency. There are several complex design steps to be considered during the development of such a system: the underlying architecture has to be allocated (which implies the allocation of components like processors, memories, and buses together with the decision on a certain interconnection topology), tasks and communication channels have to be mapped on the architecture, and all the activities in the system have to be scheduled. The design process usually implies an iterative execution of these steps until a solution is found such that the resulted system satisfies certain design constraints [10, 24, 25, 12, 39, 42]. Several notable results have been reported, aimed at supporting the designer with methodologies and tools during the hardware/software co-synthesis of embedded systems. Initially, researchers have considered architectures consisting of a single programmable processor and an ASIC. Their goal was to partition the application between the hardware and software domain, such that performance constraints are satisfied while the total hardware cost is kept at a minimum [7, 9, 11, 15].
Currently, similar architectures are becoming increasingly interesting, with the ASIC replaced by a dynamically re-configurable hardware coprocessor [21]. As a result of fast technological development and of an increasing demand for reliable embedded systems with highly complex functionality, new, more sophisticated architectures, consisting of a large number of interconnected programmable components and ASICs, are now widely used. Such complex systems can be integrated on a single chip (Systems on Chip) or can be physically distributed over a smaller or wider area (distributed embedded systems). One of the first attempts to address the problems of allocation, mapping, and scheduling in the context of such a complex architecture has been published in [33]. The approach is based on a mixed integer linear programming (MILP) formulation and has the disadvantage of the huge complexity inherent to solving such a model. Therefore, alternative problem formulations and solutions based on efficient heuristics have been proposed [40, 20, 41, 5, 1, 2]. Although much of the above work is dedicated to specific aspects of distributed systems, researchers have often ignored or very much simplified issues concerning the communication infrastructure. One notable exception is [37], in which system synthesis is discussed in the context of a distributed architecture based on arbitrated buses. Many efforts dedicated to communication synthesis have concentrated on the synthesis support for the communication infrastructure but without considering hard real-time constraints and system level scheduling aspects [16, 26, 27]. Another characteristic of research efforts concerning the codesign of embedded systems is that authors concentrate on the design, from scratch, of a new system optimised for a particular application. For many application areas, however, such a situation is extremely uncommon and only rarely appears in design practice. It is much more likely that one has to start from an already existing system running a certain application and the design problem is to implement new functionality on this system. In such a context it is very important to operate no, or as few as possible, modifications to the already running application. The main reason for this is to avoid unnecessarily large design and testing times. Performing modifications on the (potentially large) existing application increases design time and, even more, testing time (instead of only testing the newly implemented functionality, the old application, or at least a part of it, has also to be retested). However, this is not the only aspect to be considered. Such an incremental design process, in which a design is periodically upgraded with new features, is going through several iterations. Therefore, after new functionality has been implemented, the resulting system
(2) TVLSI-00246-2002.R1 has to be structured such that additional functionality, later to be mapped, can easily be accommodated [31, 32]. In one recent paper [14], Haubelt et al. consider the requirement of flexibility as a parameter during design space exploration. However, their goal is not incremental design, but the generation of an architecture which, at an acceptable cost, is able to implement different applications or variants of a certain application. In this paper we use a non-preemptive static-cyclic scheduling policy for processes and messages. Using such a scheduling policy is strongly recommended for many types of applications, e.g., hard real-time safety critical applications [17]. In [29] we have discussed the implications of an incremental design process in the context of a fixed-priority preemptive scheduling policy.
systems, most of the results are also valid in the context of this design paradigm. This paper is organized as follows. The next section presents some preliminary discussion concerning the system architecture we consider and our abstract system representation. In Section III we formulate the problem we are going to solve. Section IV introduces our approach to quantitatively characterize certain features of both currently running and future applications. In Section V we introduce the metrics we have defined in order to capture the quality of a given design alternative and, based on these metrics, we give an exact problem formulation. Our mapping and scheduling strategy is described in Section VI and the experimental results are presented in Section VII. Finally, Section VIII presents our conclusions.
A. Contributions The contribution of the present paper is twofold. 1) First, we consider mapping and scheduling for hard realtime embedded systems in the context of a realistic communication model based on a time division multiple access (TDMA) protocol as recommended for applications in areas like, for example, automotive electronics [18]. We accurately take into consideration overheads due to communication and consider, during the mapping and scheduling process, the particular requirements of the communication protocol. 2) As our main contribution, we have considered, for the first time to our knowledge, the design of distributed embedded systems in the context of an incremental design process as outlined above. This implies that we perform mapping and scheduling of new functionality on a given distributed embedded system, so that certain design constraints are satisfied and, in addition: (a) The already running applications are disturbed as little as possible. (b) There is a good chance that, later, new functionality can easily be mapped on the resulted system. We propose a new heuristic, together with the corresponding design criteria, which finds the set of old applications which have to be remapped and rescheduled at the same time with mapping and scheduling the new application, such that the disturbance on the running system (expressed as the total cost implied by the modifications) is minimized. Once this set of applications has been determined, mapping and scheduling is performed according to the requirements stated above. Supporting such a design process is of critical importance for current and future industrial practice, as the time interval between successive generations of a product is continuously decreasing, while the complexity due to increased sophistication of new functionality is growing rapidly. The goal of reducing the overall cost of successive product generations has been one of the main motors behind the, currently very popular, concept of platform-based design [19, 23]. Although, in this paper, we are not explicitly dealing with platform-based
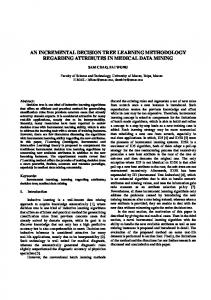
II. PRELIMINARIES A. System Architecture 1) Hardware Architecture: We consider architectures consisting of nodes connected by a broadcast communication channel (Figure 1a). Every node consists of a TTP controller, processor, memory, and an I/O interface to sensors and actuators. Communication between nodes is based on the time-triggered protocol (TTP) [18]. TTP was designed for distributed real-time applications that require predictability and reliability (e.g., drive-by-wire). It integrates all the services necessary for fault-tolerant real-time systems. The communication channel is a broadcast channel, so a message sent by a node is received by all the other nodes. The bus access scheme is time-division multiple-access (TDMA) (Figure 1b). Each node Ni can transmit only during a predetermined time interval, the so called TDMA slot Si. In such a slot, a node can send several messages packed in a frame. A sequence of slots corresponding to all the nodes in the architecture is called a TDMA round. A node can have only one slot in a TDMA round. Several TDMA rounds can be combined together in a cycle that is repeated periodically. The sequence and length of the slots are the same for all TDMA rounds. However, the length and contents of the frames may differ. Every node has a TTP controller that implements the protocol services and runs independently of the node’s CPU. Communication with the CPU is performed through a shared
Node
a)
...
Slot
b)
S0
S1
S2
TDMA Round
S3
S0
S1
S2
S3 Frames
Cycle of two rounds
Figure 1. System Architecture
(3) TVLSI-00246-2002.R1
N0
CPU P2 P1 m2 m1 m1
CPU P3
N1
m2
RT-Kernel m2
RT-Kernel m2
MBI TTP Controller
MBI
TTP Controller m2
S1
S0
Round 2
S1
Figure 2. Message passing mechanism
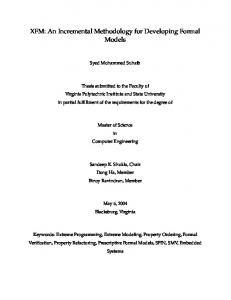
memory, the message base interface (MBI) in Figure 2. The TDMA access scheme is imposed by a so called message descriptor list (MEDL) that is located in every TTP controller. The MEDL serves as a schedule table for the TTP controller which has to know when to send or receive a frame to or from the communication channel. The TTP controller provides each CPU with a timer interrupt based on a local clock synchronized with the local clocks of the other nodes. Clock synchronization is done by comparing the a priori known time of arrival of a frame with the observed arrival time. Thus, TTP provides a global time-base of known precision, without any overhead on the communication. 2) Software Architecture: We have designed a software architecture which runs on the CPU in each node, and which has a real-time kernel as its main component. Each kernel has a schedule table that contains all the information needed to take decisions on activation of processes and transmission of messages, at the predetermined time moments. The message passing mechanism is illustrated in Figure 2, where we have three processes, P1 to P3. P1 and P2 are mapped to node N0 that transmits in slot S0, and P3 is mapped to node N1 that transmits in slot S1. Message m1 is transmitted between P1 and P2 that are on the same node, while message m2 is transmitted from P1 to P3 between the two nodes. We consider that each process has its own memory locations for the messages it
sends or receives and that the addresses of the memory locations are known to the kernel through the schedule table. P1 is activated according to the schedule table, and when it finishes it calls the send kernel function in order to send m1, and then m2. Based on the schedule table, the kernel copies m1 from the corresponding memory location in P1 to the memory location in P2. When P2 will be activated it finds the message in the right location. According to our scheduling policy, whenever a receiving process needs a message, the message is already placed in the corresponding memory location. Thus, there is no overhead on the receiving side, for messages exchanged on the same node. Message m2 has to be sent from node N0 to node N1. At a certain time, known from the schedule table, the kernel transfers m2 to the TTP controller by packaging it into a frame in the MBI. Later on, the TTP controller knows from its MEDL when it has to take the frame from the MBI, in order to broadcast it on the bus. In our example the timing information in the schedule table of the kernel and the MEDL is determined in such a way that the broadcasting of the frame is done in the slot S0 of Round 2. The TTP controller of node N1 knows from its MEDL that it has to read a frame from slot S0 of Round 2 and to transfer it into the MBI. The kernel in node N1 will read the message m2 from the MBI. When P3 will be activated based on the local schedule table of node N1, it will already have m2 in its right memory location. In [30] we presented a detailed discussion concerning the overheads due to the kernel and to every system call. We also presented formulas for derivation of the worst case execution delay of a process, taking into account the overhead of the timer interrupt, the worst case overhead of the process activation and message passing functions. B. Abstract Representation As the basis for abstract modelling we use a directed, acyclic, polar graph G(V, E), called process graph (Figure 3). Each node Pi ∈ V represents a process. A process is a sequence of computations (corresponding to several building blocks in a programming language), which starts when all its inputs are available and it issues its outputs when it terminates. As mentioned in the introduction, we consider safety-critical applications
P1 P13
P9 P3
P2
P20
P4 P10
P5
P17
P6
P7
P11
P14
P12
P15
G2
G3
P16
P18 P19
P21
P22 P23
P8
Process graph G1 Application Γ1
G4 Application Γ2
System functionality Figure 3. Abstract Representation
G5
G6 Application Γ3
(4) TVLSI-00246-2002.R1 where not meeting a timing constraint could potentially lead to catastrophic consequences. Hence, each process Pi is characterized by a worst-case execution time Ci. Estimation of the worst-case execution time for a given process has been extensively discussed in the literature [34]. Moreover, we consider a non-preemptive execution environment. Hence, once activated, a process executes until it completes. An edge in the process graph, eij ∈ E from Pi to Pj indicates that the output of Pi is the input of Pj. Each process graph G is characterized by its period TG and its deadline DG ≤ TG. Deadlines can also be placed locally on processes. Release times of some processes as well as multiple deadlines can be easily modelled by inserting dummy nodes between certain processes and the source or the sink node respectively. These dummy nodes represent processes with a certain execution time but which are not allocated to any processing element. A process graph is polar, which means that there are two nodes, called source and sink, that conventionally represent the first and last process. If needed, these nodes are introduced as dummy processes so that all other nodes in the graph are successors of the source and predecessors of the sink, respectively. As shown in Figure 3, an application Γ is modelled as a set of process graphs Gi ∈ Γ. The whole functionality of the system is represented as a set of applications. According to our representation model, all processes interacting with each other through time critical messages belong to the same process graph. If processes have different periods, this is solved by generating several instances of processes and building a process graph which corresponds to a set of processes that occur within a time period equal to the least common multiple of the periods of the involved processes. Potential communication between processes in different applications is not part of the model. Technically, such a communication is implemented by the kernels based on asynchronous nonblocking send and receive primitives. Such messages are considered non-critical and are not affected by real-time constraints. They will use bus slots that have not been assigned to time-critical messages. Therefore, communications of this nature will not be addressed in this paper.
The maximum number of bits transferred in such a message is also known. In order to implement an application, represented as a set of process graphs, the designer has to map the processes to the system nodes and to derive a static cyclic schedule such that all deadlines are satisfied. We first illustrate some of the problems related to mapping and scheduling, in the context of a system based on a TDMA communication protocol, before going on to explore further aspects specific to an incremental design approach. Let us consider the example in Figure 4 where we want to map an application consisting of four processes P1 to P4, with a period and deadline of 50 ms. The architecture is composed of three nodes that communicate according to a TDMA protocol, such that Ni transmits in slot Si. For this example we suppose that there is no other previous application running on the system. According to the specification, processes P1 and P3 are constrained to node N1, while P2 and P4 can be mapped on nodes N2 or N3, but not N1. The worst case execution times of processes on each potential node and the sequence and size of TDMA slots, are presented in Figure 4. In order to keep the example simple, we suppose that the message sizes are such that each message fits into one TDMA slot. We consider two alternative mappings. If we map P2 and P4 on the faster processor N3, the resulting schedule length (Figure 4a) will be 52 ms which does not meet the deadline. However, if we map P2 and P4 on the slower processor N2, the schedule length (Figure 4b) is 48 ms, which meets the deadline. Note, that the total traffic on the bus is the same for both mappings and the initial processor load is 0 on both N2 and N3. This result has its explanation in the impact of the communication protocol. P3 cannot start before receiving messages m2,3 and m4,3. However, slot S2 corresponding to node N2 precedes in the TDMA round slot S3 on which node N3 communicates. Thus, the messages which P3 needs are available sooner in the P1
N1 P2
N3 (fast)
P4 P3
S1
T = D = 50ms
C. Application Mapping and Scheduling Considering a system architecture like the one presented in Section II-A, the mapping of a process graph G(V, E) is given by a function M: V→PE, where PE = {N1, N2, .., Nnpe} is the set of nodes (processing elements). For a process Pi ∈ V, M(Pi) is the node to which Pi is assigned for execution. Each process Pi can potentially be mapped on several nodes. Let NPi ⊆ PE be the set of nodes to which Pi can potentially be mapped. For each Ni ∈ NPi, we know the worst-case execution time tNPii of process Pi, when executed on Ni. Messages transmitted between processes mapped on different nodes are communicated through the bus, in a slot corresponding to the sending node.
N2 (slow)
S2
S3
N1
N2
P1
4ms
–
–
P2
–
12ms
8ms
P3
4ms –
–
–
12ms
8ms
P4
TDMA round: Slot lengths: S1 = S2 = S3 = 4 ms
Process execution times
0ms4ms
Node1 Node3
52ms
P1
P3 P4
P2
Bus S1
N3
S2
m1,2 S3 S1
S2 S3
m2,3 m1,4 m4,3 S1 S2 S3 S1 S2 S3 S1
a) Processes P2 and P4 are mapped on the fast node 0ms 4ms
Node1 Node2
48ms
P1
P3
Bus S1
S2
m1,2 S3 S1
P2
P4
S2 S3
m1,4 m2,3 S1 S2 S3
m4,3 S1 S2 S3
S1
b) Processes P2 and P4 are mapped on the slow node
Figure 4. Mapping and Scheduling Example
(5) TVLSI-00246-2002.R1 Application ψ tP1 = tP2 = 10ms Tψ = Dψ = 90ms
P1
P3 P4
P2
P6 Application Γ2
Application Γ1 tP3 = tP4 = tP5 = 10ms TΓ1 = 90 ms; DΓ1 = 80ms
P7
tP6 = 10ms; tP7 = 30ms TΓ2 = DΓ2 = 90ms
P5
90ms P1
P2
a) Initial system, running application ψ P3
P1
P5
P4
90ms P2
b1) Application Γ1 on top of ψ: 1 alternative st
P1
P6
P3
P2
P5
P4
b2) Application Γ2 on top of the 1 alternative: P7 cannot be mapped. 80ms
ed as in Figure 5c1 or 5d1, Γ2 can be correctly mapped and scheduled on top of ψ and Γ1. There are two aspects which should be highlighted based on this example: 1. If application Γ1 is implemented like in Figure 5c1 or 5d1, it is possible to implement Γ2 on top of the existing system, without performing any modifications on the implementation of previous applications. This could be the case if, during implementation of Γ1, the designers have taken into consideration the fact that, in future, an application having the characteristics of Γ2 will possibly be added to the system. 2. If Γ1 has been implemented like in Figure 5b1, Γ2 can be added to the system only after performing certain modifications on the implementation of Γ1 and/or ψ. In this case, of course, it is important to perform as few as possible modifications on previous applications, in order to reduce the development costs.
st
P1
P3
P4
P5
P2
c1) Application Γ1 on top of ψ: 2nd alternative P1
P3
P6
P7
P4
P5
P2
c2) Application Γ2 on top of the 2 alternative: successful implementation. nd
P1
P3
P4
P5
P2
d1) Application Γ1 on top of ψ: 3rd alternative P1
P3
P6
P7
P4
P5
P2
d2) Application Γ2 on top of the 3rd alternative: successful implementation. Figure 5. Application Γ2 Implemented on Top of ψ and Γ1
case P2 and P4 are, counter-intuitively, mapped on the slower node. But finding a valid schedule is not enough if we are to support an incremental design process as discussed in the introduction. In this case, starting from a valid design, we have to improve the mapping and scheduling so that not only the design constraints are satisfied, but also there is a good chance that, later, new functionality can easily be mapped on the resulted system. To illustrate the role of mapping and scheduling in the context of an incremental design process, let us consider the example in Figure 5. For simplicity, we consider an architecture consisting of a single processor. The system is currently running application ψ (Figure 5a). At a particular moment application Γ1 has to be implemented on top of ψ. Three possible implementation alternatives for Γ1 are depicted in Figure 5b1, 5c1, and 5d1. All three are meeting the imposed time constraint for Γ1. At a later moment, application Γ2 has to be implemented on the system running ψ and Γ1. If Γ1 has been implemented as shown in Figure 5b1, there is no possibility to map application Γ2 on the given system (in particular, there is no time slack available for process P7). If Γ1 has been implement-
III. PROBLEM FORMULATION As shown in Section II, we capture the functionality of a system as a set of applications. An application Γ consists of a set of process graphs Gi ∈ Γ. For each process Pi in a process graph we know the set NPi of potential nodes on which it could be mapped and its worst case execution time on each of these nodes. We also know the maximum number of bits to be transmitted by each message. The underlying architecture is as presented in Section II-A. We consider a non-preemptive static cyclic scheduling policy for both processes and message passing. Our goal is to map and schedule an application Γcurrent on a system that already implements a set ψ of applications, considering the following requirements: • Requirement a: All constraints on Γcurrent are satisfied and minimal modifications are performed to the implementation of applications in ψ. • Requirement b: New applications Γfuture can be mapped on top of the resulting system. We illustrate such an incremental design process in Figure 6. The product is implemented as a three processor system and its version N-1 consists of the set ψ of two applications (the processes belonging to these applications are represented as white and black disks, respectively). At the current moment, application Γcurrent is to be added to the system, resulting in version N of the product. However, a new version, N+1, is very likely to follow and this fact is to be considered during implementation of Γcurrent1. If it is not possible to map and schedule Γcurrent without modifying the implementation of the already running applications, we have to change the scheduling and mapping of some applications in ψ. However, even with remapping and rescheduling all applications in ψ, it is still possible that certain con-
1 The design process outlined here also applies when Γcurrent is a new version of an application Γold ∈ ψ. In this case, all the processes and communications belonging to Γold are eliminated from the running system ψ, before starting the mapping and scheduling of Γcurrent.
(6) TVLSI-00246-2002.R1
Version N−1
Version N
Application to be added to the system: Γcurrent
Existing applications:
ψ
Implement Γcurrent so that: 1. constraints on Γcurrent are satisfied; 2. modifications of ψ are minimized; 3. good chance to implement Γfuture;
Version N+1
Possible future application to be added: Γfuture
Figure 6. Incremental Design Process
straints are not satisfied. In this case the hardware architecture has to be changed by, for example, adding a new processor, and the mapping and scheduling procedure for Γcurrent has to be restarted. In this paper we will not further elaborate on the aspect of adding new resources to the architecture, but will concentrate on the mapping and scheduling aspects. Thus, we consider that a possible mapping and scheduling of Γcurrent which satisfies the imposed constraints can be found (with minimizing the modification of the already running applications), and this solution has to be further improved in order to facilitate the implementation of future applications. In order to achieve our goal we need certain information to be available concerning the set of applications ψ as well as the possible future applications Γfuture. What exactly we have to know about these applications will be discussed in Section IV. In Section V we then introduce the quality metrics which will allow us to give a more rigorous formulation of the problem we are going to solve. The processes in application Γcurrent can interact with the previously mapped applications ψ by reading messages generated on the bus by processes in ψ. In this case, the reading process has to be synchronized with the arrival of the message on the bus, which is easy to model as an additional time constraint on the particular receiving process. This constraint is then considered (as any other deadline) during scheduling of Γcurrent. IV. CHARACTERIZING EXISTING AND FUTURE APPLICATIONS A. Characterizing the Already Running Applications To perform the mapping and scheduling of Γcurrent, the minimum information needed, concerning the already running applications ψ, consists of the local schedule tables for each processor node. Thus, we know the activation time for each process previously mapped on the respective node and its worst case execution time. As for messages, their length as well as their place in the particular TDMA frame are known. If the initial attempt to schedule and map Γcurrent does not succeed, we have to modify the schedule and, possibly, the mapping of applications belonging to ψ, in the hope to find a valid solution for Γcurrent. The goal is to find that minimal mod-
ification to the existing system which leads to a correct implementation of Γcurrent. In our context, such a minimal modification means remapping and/or rescheduling a subset Ω of the old applications, Ω ⊆ ψ, so that the total cost of re-implementing Ω is minimized. Remapping and/or rescheduling a certain application Γi ∈ ψ can trigger the need to also perform modifications of one or several other applications because of, for example, the dependencies between processes belonging to these applications. In order to capture such dependencies between the applications in ψ, as well as their modification costs, we have introduced a representation called the application graph. We represent a set of applications as a directed acyclic graph G(V, E), where each node Γi ∈ V represents an application. An edge eij ∈ E from Γi to Γj indicates that any modification to Γi would trigger the need to also remap and/or reschedule Γj, because of certain interactions between the applications1. Each application in the graph has an associated attribute specifying if that particular application is allowed to be modified or not (in which case, it is called “frozen”). To those nodes Γi ∈ V representing modifiable applications, the designer has associated a cost RΓi of re-implementing Γi. Given a subset of applications Ω ⊆ ψ, the total cost of modifying the applications in Ω is: RΓ . R( Ω) = i
∑
Γi ∈ Ω
Modifications of an already running application can only be performed if the process graphs corresponding to that application, as well as the related deadlines (which have to be satisfied also after remapping and rescheduling), are available. However, this is not always the case, and in such situations that particular application has to be considered frozen. In Figure 7 we present the graph corresponding to a set of ten applications. Applications Γ6, Γ8, Γ9 and Γ10, depicted in black, are frozen: no modifications are possible to them. The rest of the applications have the modification cost RΓi depicted on their left. Γ7 can be remapped/rescheduled with a cost of 20. If Γ4 is to be re-implemented, this also requires the modification of Γ7, with a total cost of 90. In the case of Γ5, although not frozen, no remapping/rescheduling is possible as it would trigger the need to modify Γ6, which is frozen. To each application Γi ∈ V the designer has associated a cost RΓi of re-implementing Γi. Such a cost can typically be expressed in man-hours needed to perform retesting of Γi and 150
Γ1
Γ8
70
Γ2
50
Γ3
Γ9
70
Γ4
50
Γ5
Γ6
Γ10
20
Γ7
Figure 7. Characterizing the Set of Already Running Applications 1
If a set of applications have a circular dependence, such that the modification of any one implies the remapping of all the others in that set, the set will be represented as a single node in the graph.
(7) TVLSI-00246-2002.R1 other tasks connected to the remapping and rescheduling of the application. If an application is remapped or rescheduled, it has to be validated again. Such a validation phase is very time consuming. In the automotive industry, for example, the time-to-market in the case of the powertrain unit is 24 months. Out of these, 5 months, representing more than 20%, are dedicated to validation. In the case of the telematic unit, the time to market is less than one year, while the validation time is two months [38]. However, if an application is not modified during implementation of new functionality, only a small part of the validation tasks have to be re-performed (e.g., integration testing), thus reducing significantly the time-to-market, at no additional hardware or development cost. How to concretely perform the estimation of the modification cost related to an application is beyond the topic of this paper. Several approaches to cost estimation for different phases of the software life-cycle have been elaborated and are available in the literature [6, 35]. One of the most influential software cost models is the Constructive Cost Model (COCOMO) [3]. COCOMO is at the core of tools such as REVIC [43] and its newer version SoftEST [44], which can produce cost estimations not only for the total development but also for testing, integration, or modification related retesting of embedded software. The results of such estimations can be used by the designer as the cost metrics assigned to the nodes of an application graph. In general, it can be the case that several alternative costs are associated to a certain application, depending on the particular modification performed. Thus, for example, we can have a certain cost if processes are only rescheduled, and another one if they are also remapped on an alternative node. For different modification alternatives considered during design space exploration, the corresponding modification cost has to be selected. In order to keep the discussion reasonably simple, we present the case with one single modification cost associated to an application. However, the generalization for several alternative modification costs is straightforward. B. Characterizing Future Applications What do we suppose to know about the family Γfuture of applications which do not exist yet? Given a certain limited application area (e.g. automotive electronics), it is not unreasonable to assume that, based on the designers’ previous experience, the nature of expected future functions to be implemented, profiling of previous applications, available incomplete designs for future versions of the product, etc., it is possible to characterize the family of applications which possibly could be added to the current implementation. This is an assumption which is basic for the concept of incremental design. Thus, we consider that, with respect to the future applications, we know the set St = {tmin,...ti,...tmax} of possible worst case execution times for processes, and the set Sb = {bmin,...bi,...bmax} of possible message sizes. We also assume that over these sets we know the distributions of probability fSt(t) for t ∈ St and fSb (b) for b ∈ Sb. For example, we might have predicted possible worst case execution times of different processes in future applications St = {50, 100, 200,
300, 500 ms}. If there is a higher probability of having processes of 100 ms, and a very low probability of having processes of 300 ms and 500 ms, then our distribution function fSt(t) could look like this: fSt(50) = 0.20, fSt(100) = 0.50, fSt(200) = 0.20, fSt(300) = 0.05, and fSt(500) = 0.05. Another information is related to the period of process graphs which could be part of future applications. In particular, the smallest expected period Tmin is assumed to be given, together with the expected necessary processor time tneed, and bus bandwidth bneed, inside such a period Tmin. As will be shown later, this information is treated in a flexible way during the design process and is used in order to provide a fair distribution of available resources. The execution times in St, as well as tneed, are considered relative to the slowest node in the system. All the other nodes are characterized by a speedup factor relative to this slowest node. A normalization with these factors is performed when computing the metrics C1P and C2P introduced in the following section. V. QUALITY METRICS AND OBJECTIVE FUNCTION A designer will be able to map and schedule an application Γfuture on top of a system implementing ψ and Γcurrent only if there are sufficient resources available. In our case, the resources are processor time and the bandwidth on the bus. In the context of a non-preemptive static scheduling policy, having free resources translates into having free time slots on the processors and having space left for messages in the bus slots. We call these free slots of available time on the processor or on the bus, slack. It is to be noted that the total quantity of computation and communication power available on our system after we have mapped and scheduled Γcurrent on top of ψ is the same regardless of the mapping and scheduling policies used. What depends on the mapping and scheduling strategy is the distribution of slacks along the time line and the size of the individual slacks. It is exactly this size and distribution of the slacks that characterizes the quality of a certain design alternative from the point of view of flexibility for future upgrades. In this section we introduce two criteria in order to reflect the degree to which one design alternative meets the requirement (b) presented in Section III. For each criterion we provide metrics which quantify the degree to which the criterion is met. The first criterion reflects how well the resulted slack sizes fit to a future application, and the second criterion expresses how well the slack is distributed in time. A. Slack Sizes (the first criterion) The slack sizes resulted after implementation of Γcurrent on top of ψ should be such that they best accommodate a given family of applications Γfuture, characterized by the sets St, Sb and the probability distributions fSt and fSb, as outlined in Section IV-B. Let us go back to the example in Figure 5 where Γ1 is what we now call Γcurrent, while Γ2, to be later implemented on top of ψ and Γ1, is Γfuture. This Γfuture consists of the two processes P6 and P7. It can be observed that the best configuration from
(8) TVLSI-00246-2002.R1 the point of view of accommodating Γfuture, taking in consideration only slack sizes, is to have a contiguous slack after implementation of Γcurrent (Figure 5d1). However, in reality, it is almost impossible to map and schedule the current application such that a contiguous slack is obtained. Not only is it impossible, but it is also undesirable from the point of view of the second design criterion, to be discussed next. However, as we can see from Figure 5b1, if we schedule Γcurrent such that it fragments too much the slack, it is impossible to fit Γfuture because there is no slack that can accommodate process P7. A situation as the one depicted in Figure 5c1 is desirable, where the resulted slack sizes are adapted to the characteristics of the Γfuture application. In order to measure the degree to which the slack sizes in a given design alternative fit the future applications, we provide two metrics, C1P and C1m . C1P captures how much of the largest future application which theoretically could be mapped on the system can be mapped on top of the current design alternative. C1m is similar relative to the slacks in the bus slots. How does the largest future application which theoretically could be mapped on the system look like? The total processor time and bus bandwidth available for this largest future application is the total slack available on the processors and bus, respectively, after implementing Γcurrent. Process and message sizes of this hypothetical largest application are determined knowing the total size of the available slack, and the characteristics of the future applications as expressed by the sets St and Sb, and the probability distributions fSt and fSb. Let us consider, for example, that the total slack size on the processors is of 2800 ms and the set of possible worst case execution times is St={50, 100, 200, 300, 500 ms}. The probability distribution function fSt is defined as follows: fSt(50) = 0.20, fSt(100) = 0.50, fSt(200) = 0.20, fSt(300) = 0.05, and fSt(500) = 0.05. Under these circumstances, the largest hypothetical future application will consist of 20 processes: 10 processes (half of the total, ft(100) = 0.50) with a worst case execution time of 100 ms, 4 processes with 50 ms, 4 with 200 ms, one with 300 and one with 500 ms. After we have determined the number of processes of this largest hypothetical Γfuture and their worst case execution times, we apply a bin-packing algorithm [22] using the best-fit policy in which we consider processes as the objects to be packed, and the available slacks as containers. The total execution time of processes which are left unpacked, relative to the total execution time of the whole process set, gives the C1P metric. The same is the case with the metric C1m, but applied to message sizes and available slacks in the bus slots. Let us consider the example in Figure 5 and suppose a hypothetical Γfuture consisting of two processes like those of application Γ2. For the design alternatives in Figure 5c1 and 5d1, C1P = 0% (both alternatives are perfect from the point of view of slack sizes). For the alternative in Figure 5b1, however, C1P = 30/40 = 75%—the worst case execution time of P7 (which is left unpacked) relative the total execution time of the two processes.
B. Distribution of Slacks (the second criterion) In the previous section we defined a metric which captures how well the sizes of the slacks fit a possible future application. A similar metric is needed to characterize the distribution of slacks over time. Let Pi be a process with period TPi that belongs to a future application, and M(Pi) the node on which Pi will be mapped. i) The worst case execution time of Pi is tM(P Pi . In order to schedM(Pi) ule Pi we need a slack of size tPi that is available periodically, within a period TPi, on processor M(Pi). If we consider a group of processes with period T, which are part of Γfuture, in order to implement them, a certain amount of slack is needed which is available periodically, with a period T, on the nodes implementing the respective processes. During implementation of Γcurrent we aim for a slack distribution such that the future application with the smallest expected period Tmin and with the necessary processor time tneed, and bus bandwidth bneed, can be accommodated (see Section IV-B). Thus, for each node, we compute the minimum periodic slack, inside a Tmin period. By summing these minima, we obtain the slack which is available periodically to Γfuture. This is the C2P metric. The C2m metric characterizes the minimum periodically available bandwidth on the bus and it is computed in a similar way. In Figure 8 we consider an example with Tmin = 120 ms, tneed = 90 ms, and bneed = 65 ms. The length of the schedule table of the system implementing ψ and Γcurrent is 360 ms (in Section VI we will elaborate on the length of the global schedule table). Thus, we have to investigate three periods of length Tmin each. The system consists of three nodes. Let us consider the situation in Figure 8a. In the first period, Period 0, there are 40 ms of slack available on Node1, in the second period 80 ms, and in the third period no slack is available on Node1. Thus, the total slack a future application of period Tmin can use on Node1 is min(40, 80, 0) = 0 ms. Neither can Node2 provide slack for this application, as in Period 1 there is no slack available. However, on Node3 there are at least 40 ms of slack available in each period. Thus, with the configuration in Figure 8a we have C2P = 40 ms, which is not sufficient to accommodate Period 0 Tmin
360 ms Period 1
Period 2 P1 min(40, 80, 0) = 0ms
Node1 Node2
min(40, 0, 80) = 0ms min(80, 80, 40) = 40ms
Node3 S1 S2 S3 S1 S2 S3 S1 S2 S3 S1 S2 S3
Bus
Round 0
Round 1
Round 2
Round 3
C2P = 40 + 0 + 0 = 40ms Cm 2 = min(60,120, 90) = 60ms
a) min(40, 40, 40) = 40ms
Node1 Node2
min(40, 40, 40) = 40ms min(80, 80, 40) = 40ms
Node3 Bus
S1 S2 S3 S1 S2 S3 S1 S2 S3 S1 S2 S3 Round 0
Round 1
Round 2
Round 3
Time slots occupied by ψ and Γcurrent
C2P = 40 + 40 + 40 = 120ms Cm 2 = min(90, 90, 90) = 90ms
b) Slack
Figure 8. Example for the Second Design Criterion
(9) TVLSI-00246-2002.R1 tneed = 90 ms. The available periodic slack on the bus is also insufficient: C2m = 60 ms < bneed. However, in the situation presented in Figure 8b, we have C2P = 120 ms > tneed, and C2m = 90 ms > bneed. C. Objective Function and Exact Problem Formulation In order to capture how well a certain design alternative meets the requirement (b) stated in Section III, the metrics discussed before are combined in an objective function, as follows: P P 2 m m 2 C = w 1 ( C 1 ) + w1 ( C 1 ) P
P
m
m
+ w 2 max ( 0, t need – C 2 ) + w 2 max ( 0, b need – C 2 ) where the metric values introduced in the previous section are weighted by the constants w1P, w2P, w1m, and w2m. Our mapping and scheduling strategy will try to minimize this function. The first two terms measure how well the resulted slack sizes fit to a future application (the first criterion), while the second two terms reflect the distribution of slacks (the second criterion). In order to obtain a balanced solution, that favours a good fitting both on the processors and on the bus, we have used the squares of the metrics. We call a valid solution, that mapping and scheduling which satisfies all the design constraints (in our case the deadlines) and meets the second criterion (C2P ≥ tneed and C2m ≥ bneed)1. At this point we can give an exact formulation of our problem. Given an existing set of applications ψ which are already mapped and scheduled, and an application Γcurrent to be implemented on top of ψ, we are interested to find the subset Ω ⊆ ψ of old applications to be remapped and rescheduled such that we produce a valid solution for Γcurrent ∪ Ω and the total cost of modification R(Ω) is minimized. Once such a set Ω of applications is found, we are interested to optimise the implementation of Γcurrent ∪ Ω such that the objective function C is minimized, considering a family of future applications characterized by the sets St and Sb, the functions fSt and fSb as well as the parameters Tmin, tneed, and bneed. A mapping and scheduling strategy based on this problem formulation is presented in the following section.
MappingSchedulingStrategy Step 1: try to find a valid solution that minimizes R(Ω) Find a mapping and scheduling of Γcurrent ∪ Ω on top of ψ \ Ω so that: 1.constraints are satisfied; 2.modification cost R(Ω) is minimized; 3.the second criterion is satisfied: CP2 ≥ tneed and Cm2 ≥ bneed if Step1 has not succeeded then if constraints are not satisfied then change architecture else suggest new Tmin, tneed or bneed end if go to Step 1 end if Step 2: improve the solution by minimizing objective function C Perform iteratively transformations which improve the first criterion (the metrics C1P and C1m ) without invalidating the second criterion. end MappingSchedulingStrategy
Figure 9. Mapping and Scheduling Strategy (MS)
the second step aims at minimizing the value of w1P(C1P)2 + w1m(C1m)2. If the first step has not succeeded in finding a solution such that the imposed time constraints are satisfied, this means that there are not sufficient resources available to implement the application Γcurrent. Thus, modifications of the system architecture have to be performed before restarting the mapping and scheduling procedure. If, however, the timing constraints are met but the second design criterion is not satisfied, a larger Tmin (smallest expected period of a future application, see Section IV-B) or smaller values for tneed and/or bneed are suggested to the designer. This, of course, reduces the frequency of possible future applications and the amount of processor and bus resources available to them. In the following section we briefly discuss the basic mapping and scheduling algorithm we have used in order to generate an initial solution. The heuristic used to iteratively improve the design with regard to the first and the second design criteria is presented in Section VI-B. In Section VI-C we describe three alternative heuristics which can be used during the first step in order to find the optimal subset of applications to be modified. A. The Initial Mapping and Scheduling
VI. MAPPING AND SCHEDULING STRATEGY As shown in the algorithm in Figure 9, our mapping and scheduling strategy (MS) consists of two steps. In the first step we try to obtain a valid solution for the mapping and scheduling of Γcurrent ∪ Ω so that the modification cost R(Ω) is minimized. Starting from such a solution, the second step iteratively improves the design in order to minimize the objective function C. In the context in which the second criterion is satisfied after the first step, improving the cost function during
1 This definition of a valid solution can be relaxed by imposing only the satisfaction of deadlines. In this case, the algorithm in Figure 9 will look after a solution which satisfies the deadlines and R(Ω) is minimized; the additional second criterion is, in this case, only considered optionally.
As shown in Figure 11, the first step of MS consists of an iteration that tries different subsets Ω ⊆ ψ with the intention to find that subset Ω = Ωmin of old applications to be remapped and rescheduled which produces a valid solution for Γcurrent ∪ Ω such that R(Ω) is minimized. Given a subset Ω, the InitialMappingScheduling function (IMS) constructs a mapping and a schedule for the applications Γcurrent ∪ Ω on top of ψ \ Ω, that meets the deadlines, without worrying about the two criteria introduced in Section V. The IMS is a classical mapping and scheduling algorithm for which we have used as a starting point the Heterogeneous Critical Path (HCP) algorithm, introduced in [13]. HCP is based on a list scheduling approach [4]. We have modified the HCP algorithm in three main regards: 1. We consider that mapping and scheduling does not start with an empty system but a system on which a certain num-
(10) TVLSI-00246-2002.R1 source TG1
DG1 n1
Process graph: TG = DG G1∈Γcurrent ∪ Ω (=23T )2 G1 period: TG1 deadline: DG1
TGcurrent = 3TG1
n2
n3
Process graph: G2∈Γcurrent ∪ Ω Execution times of dummy processes: tn1 = TG1tn4 = 2TG1 − DG1 tn2 = 2TG1tn5 = TG1 − DG1 tn3 = 3TG1 − DG1tsource = tsink = 0
n4 n5 sink
Merged process graph Gcurrent: period = deadline = 3TG1
Figure 10. Graph Merging
ber of processes already are mapped. 2. Messages are scheduled into bus-slots according to the TDMA protocol. The TDMA-based message scheduling technique has been presented by us in [8]. 3. As a priority function for list scheduling we use, instead of the CP (critical path) priority function employed in [13], the MPCP (modified partial critical path) function introduced by us in [8]. MPCP takes into consideration the particularities of the communication protocol for calculation of communication delays. These delays are not estimated based only on the message length, but also on the time when slots assigned to the particular node which generates the message will be available. For the example in Figure 4, our initial mapping and scheduling algorithm will be able to produce the optimal solution with a schedule length of 48 ms. However, before performing the effective mapping and scheduling with IMS, two aspects have to be addressed. First, the process graphs Gi ∈ Γcurrent ∪ Ω have to be merged into a single graph Gcurrent, by unrolling of process graphs and insertion of dummy nodes as shown in Figure 10. The period TGcurrent of Gcurrent is equal to the least common multiplier of the periods TGi of the graphs Gi. Dummy nodes (depicted as black disks in Figure 10) represent processes with a certain execution time but that are not to be mapped to any processor or bus. In addition, we have to consider during scheduling the mismatch between the periods of the already existing system and those of the current application. The schedule table into which we would like to schedule Gcurrent has a length of Tψ\Ω which is the global period of the system ψ after extraction of the applications in Ω. However, the period Tcurrent of Gcurrent can be different from Tψ\Ω. Thus, before scheduling Gcurrent into the existing schedule table, the schedule table is expanded to the least common multiplier of the two periods. A similar procedure is followed in the case Tcurrent > Tψ\Ω. B. Iterative Design Transformations Once IMS has produced a mapping and scheduling which satisfies the timing constraints, the next goal of Step 1 is to improve the design in order to satisfy the second design criterion (C2P ≥ tneed and C2m ≥ bneed). During the second step, the design is then further transformed with the goal of minimizing the
value of w1P(C1P)2 + w1m(C1m)2, according to the requirements of the first criterion, without invalidating the second criterion achieved in the first step. In both steps we iteratively improve the design using a transformational approach. These successive transformations are performed inside the (innermost) repeat loops of the first and second step, respectively (Figure 11). A new design is obtained from the current one by performing a transformation called move. We consider the following two categories of moves: 1. moving a process to a different slack found on the same node or on a different node; 2. moving a message to a different slack on the bus. In order to eliminate those moves that will lead to an infeasible design (that violates deadlines), we do as follows. For each process Pi, we calculate the ASAP(Pi) and ALAP(Pi) times considering the resources of the given hardware architecture. ASAP(Pi) is the earliest time Pi can start its execution, while ALAP(Pi) is the latest time Pi can start its execution without causing the application to miss its deadline. When moving Pi we will consider slacks on the target processor only inside the [ASAP(Pi), ALAP(Pi)] interval. The same reasoning holds for messages, with the addition that a message can only be moved to slacks belonging to a slot that corresponds to the Step 1: try to find a valid solution that minimizes R(Ω) Ω=∅ repeat succeeded = InitialMappingScheduling(ψ \ Ω, Γcurrent ∪ Ω) -- compute ASAP-ALAP intervals for all processes ASAP(Γcurrent ∪ Ω); ALAP(Γcurrent ∪ Ω) if succeeded then-- if time constraints are satisfied -- design transformations in order to satisfy -- the second design criterion repeat -- find set of moves with the highest potential to -- maximize C2P or C2m move_set = PotentialMoveC2P(Γcurrent ∪ Ω) ∪ PotentialMoveC2m(Γcurrent ∪ Ω) -- select and perform move which improves most C2 move = SelectMoveC2(move_set); Perform(move) succeeded =C2P ≥ tneed and C2m ≥ bneed until succeeded or maximum number of iterations reached end if if succeeded and R(Ω) smallest so far then Ωvalid = Ω; solutionvalid = solutioncurrent end if Ω=NextSubset(Ω) -- try another subset until termination condition Step 2: improve the solution by minimizing objective function C solutioncurrent = solutionvalid; Ωmin = Ωvalid -- design transformations in order to satisfy the first design criterion repeat -- find set of moves with highest potential to minimize C1P or C1m move_set = PotentialMoveC1P(Γcurrent ∪ Ωmin) ∪ PotentialMoveC2m(Γcurrent ∪ Ωmin) -- select move which improve w1P(C1P)2 + w1m(C1m)2, -- and does not invalidate the second criterion move = SelectMoveC1(move_set); Perform(move) until w1P(C1P)2 + w1m(C1m)2 has not changed or maximum number of iterations reached
Figure 11. Step 1 and Step 2 of the Mapping and Scheduling Strategy in Figure 9
(11) TVLSI-00246-2002.R1 sender node (see Section II-A). Any violation of the data dependency constraints caused by a move is rectified by shifting processes or messages concerned in an appropriate way. If such a shift produces a deadline violation, the move is rejected. At each step, our heuristic tries to find those moves that have the highest potential to improve the design. For each iteration a set of potential moves is selected by the PotentialMoveX functions. SelectMoveX then evaluates these moves with regard to the respective metrics and selects the best one to be performed. We now briefly discuss the four PotentialMoveX functions with the corresponding moves. 3) PotentialMoveC2P and PotentialMoveC2m: Consider Figure 8a. In Period 2 on Node1 there is no available slack. However, if we move process P1 with 40 ms to the left into Period 1, as depicted in Figure 8b, we create a slack in Period 2 and the periodic slack on node N1 will be min(40, 40, 40) = 40 ms, instead of 0 ms. Potential moves aimed at improving the metric C2P will be the shifting of processes inside their [ASAP, ALAP] interval in order to improve the periodic slack. The move can be performed on the same node or to the less loaded nodes. The same is true for moving messages in order to improve the metric C2m. For the improvement of the periodic bandwidth on the bus, we also consider movement of processes, trying to place the sender and receiver of a message on the same processor and, thus, reducing the bus load. 4) PotentialMoveC1P and PotentialMoveC1m: The moves suggested by these two functions aim at improving the C1 metric through reducing the slack fragmentation. The heuristic is to evaluate only those moves that iteratively eliminate the smallest slack in the schedule. Let us consider the example in Figure 12, where we have three applications mapped on a single processor: ψ, consisting of P1 and P2, Γcurrent, having processes P3, P4 and P5, and Γfuture, with P6, P7 and P8. Figure 12 presents three possible schedules; processes are depicted with rectangles, the width of a rectangle representing the worst case execution time of that process. The PotentialMoveC1 functions start by identifying the smallest slack in the schedule table. In Figure 12a, the smallest slack is the slack between P1 and P3. Once the smallest slack has been identified, potential moves are investigated which either remove or enlarge the slack. For example, the slack between P1 and P3 can be removed by attaching P3 to P1, and it can be enlarged by moving P3 to the right in the schedule table. Moves that remove the slack are considered only if they do not lead to an invalidation of the second design criterion, measured by the C2 metric improved in the previous step (see Figure 11, Step 1). Also, the slack can be enlarged only if it does not create, as a result, other unusable slack. A slack is unusable if it cannot hold the smallest object of the future application, in our case P6. In Figure 12a, the slack can be removed by moving P3 such that it starts from time 20, immediately after P1, and it can be enlarged by moving P3 so that it starts from 30, 40, or 50 (considering an increment which here was set by us to 10, the size of P6, the smallest object in Γfuture). For each move, the improvement on the C1 metric is calculated, and that move is selected by the
Γfuture:
P6
P7
P8
0 10 20 30 40 50 60 70 80 90 100 110 120 130 140 150 160170 160 180 Smallest slack
a)
P1
P6
P3
P4
P7
P5
P2
P8 cannot be mapped; move P3 to start from 20 Smallest slack
b)
P1
P3
P6
P4
P7
P5
P2
P8 cannot be mapped; move P5 to start from 90 c)
P1
P3
P7
P4
P5
P6
P8
P2
Successful implementation a) Smallest slack: between P1 and P3 Potential moves: P3 starting at 20, having C1P =50% (denoted with 20/ 50%), 30/50%, 40/50%, 50/50%. Selected move: P3 to 20, with C1P= 50%.
b) Smallest slack: between P5 and P2 Potential moves: P4 to 40/37.5%, 50/ 37.5%, 60/37.5%, 80/37.5%, 90/ 37.5%, 100/37.5%; P5 to 90/0%, 100/ 0%, 110/50%, 130/50%, 140/50%, 150/0%, 160/0%. Selected move: P5 to 90 with C1P= 0%.
Figure 12. Successive Steps with Potential Moves for Improving C1 SelectMoveC1 function to be performed, which leads to the largest improvement on C1 (which means the smallest value). For all the previously considered moves of P3, we are not able to map P8 which represents 50% of the Γfuture, therefore C1 = 50%. Consequently, we can perform any of the mentioned moves, and our algorithm selects the first one investigated, the move to start P3 from 20, thus removing the slack. As a result of this move, the new schedule table is the one in Figure 12b. In the next call of the PotentialMoveC1 function, the slack between P5 and P2 is identified as the smallest slack. Out of the potential moves that eliminate this slack, listed in Figure 12 for case b, several lead to C1 = 0%, the largest improvement. SelectMoveC1 selects moving P5 to start from 90, and thus we are able to map process P8 of the future application, leading to a successful implementation in Figure 12c. The previous example has only illustrated movements of processes. Similarly, in PotentialMoveC1m, we also consider moves of messages in order to improve C1m. However, the movement of messages is restricted by the TDMA bus access scheme, such that a message can only be moved into a slot corresponding to the node on which it is generated.
C. Minimizing the Total Modification Cost The first step of our mapping and scheduling strategy, described in Figure 11, iterates on successive subsets Ω searching for a valid solution which also minimizes the total modification cost R(Ω). As a first attempt, the algorithm searches for a valid implementation of Γcurrent without disturbing the existing applications (Ω = ∅). If no valid solution is found, successive subsets Ω produced by the function NextSubset are considered, until a termination condition is met. The performance of the algorithm, in terms of runtime and quality of the solutions produced, is strongly influenced by the strategy employed for the function NextSubset and the termi-
(12) TVLSI-00246-2002.R1 nation condition. They determine how the design space is explored while testing different subsets Ω of applications. In the following we present three alternative strategies. The first two can be considered as situated at opposite extremes: The first one is potentially very slow but produces the optimal result while the second is very fast and possibly low quality. The third alternative is a heuristic able to produce good quality results in relatively short time, as will be demonstrated by the experimental results presented in Section VII. 5) Exhaustive Search (ES): In order to find Ωmin, the simplest solution is to try successively all the possible subsets Ω ⊆ ψ. These subsets are generated in the ascending order of the total modification cost, starting from ∅. The termination condition is fulfilled when the first valid solution is found or no new subsets are to be generated. Since the subsets are generated in ascending order, according to their cost, the subset Ω that first produces a valid solution is also the subset with the minimum modification cost. The generation of subsets is performed according to the graph G that characterizes the existing applications (see Section IV-A). Finding the next subset Ω, starting from the current one, is achieved by a branch and bound algorithm that, in the worst case, grows exponentially in time with the number of applications. For the example in Figure 7, the call to NextSubset(∅) will generate Ω = {Γ7} which has the smallest non-zero modification cost R({Γ7}) = 20. The next generated subsets, in order, together with their corresponding total modification cost are: R({Γ3}) = 50, R({Γ3, Γ7}) = 70, R({Γ4, Γ7}) = 90 (the inclusion of Γ4 triggers the inclusion of Γ7), R({Γ2, Γ3}) = 120, R({Γ2, Γ3, Γ7}) = 140, R({Γ3, Γ4, Γ7}) = 140, R({Γ1}) = 150, and so on. The total number of possible subsets according to the graph G in Figure 7 is 16. This approach, while finding the optimal subset Ω, requires a large amount of computation time and can be used only with a small number of applications. 6) Greedy Heuristic (GH): If the number of applications is larger, a possible solution could be based on a simple greedy heuristic which, starting from Ω = ∅, progressively enlarges the subset until a valid solution is produced. The algorithm looks at all the non-frozen applications and picks that one which, together with its dependencies, has the smallest modification cost. If the new subset does not produce a valid solution, it is enlarged by including, in the same fashion, the next application with its dependencies. This greedy expansion of the subset is continued until the set is large enough to lead to a valid solution or no application is left. For the example in Figure 7 the call to NextSubset(∅) will produce R({Γ7}) = 20, and will be successively enlarged to R({Γ7, Γ3}) = 70, R({Γ7, Γ3, Γ2}) = 140 (Γ4 could have been picked as well in this step because it has the same modification cost of 70 as Γ2 and its dependence Γ7 is already in the subset), R({Γ7, Γ3, Γ2, Γ4}) = 210, and so on. While this approach finds very quickly a valid solution, if one exists, it is possible that the resulted total modification cost is much higher than the optimal one. 7) Subset Selection Heuristic (SH): An intelligent selection heuristic should be able to identify the reasons due to which a
valid solution has not been produced and to find the set of candidate applications which, if modified, could eliminate the problem. The failure to produce a valid solution can have two possible causes: an initial mapping which meets the deadlines has not been found, or the second criterion is not satisfied. Let us investigate the first reason. If an application Γi is to meet its deadline Di, all its processes Pj ∈ Γi have to be scheduled inside their [ASAP, ALAP] intervals. InitialMappingScheduling (IMS) fails to schedule a process inside its [ASAP, ALAP] interval if there is not enough slack available on any processor, due to other processes scheduled in the same interval. In this situation we say that there is a conflict with processes belonging to other applications. We are interested to find out which applications are responsible for conflicts encountered during the mapping and scheduling of Γcurrent, and not only that, but also which ones are flexible enough to be moved away in order to avoid these conflicts. If it is not able to find a solution that satisfies the deadlines, IMS will determine a metric ∆Γi that characterizes both the degree of conflict and the flexibility of each application Γi ∈ ψ in relation to Γcurrent. A set of applications Ω will be characterized, in relation to Γcurrent, by the following metric: ∆( Ω) =
∑
∆Γ . i
Γi ∈ Ω
This metric ∆(Ω) will be used by our subset selection heuristic in the case IMS has failed to produce a solution which satisfies the deadlines. An application with a larger ∆Γ is more i likely to lead to a valid schedule if included in Ω. In Figure 13 we illustrate how this metric is calculated. Applications A, B and C are implemented on a system consisting of the three processors Node1, Node2 and Node3. The current application to be implemented is D. At a certain moment, IMS comes to the point to map and schedule process D1 ∈ D. However, it is not able to place it inside its [ASAP, ALAP] interval, denoted in Figure 13 as I. The reason is that there is not enough slack available inside I on any of the processors, because processes A1, A2, A3 ∈ A, B1 ∈ B, and C1 ∈ C are scheduled inside that interval. We are interested to determine which of the applications A, B, and C are more likely to lend free slack for D1, if remapped and rescheduled. Therefore, we calASAP(C1)
ASAP(D1)
|I| = ALAP(D1) − ASAP(D1) A1
Node1
ALAP(D1) ALAP(C1)
B1
|C1|
Node2 Node3
|C1| CL1
CR1
C1
A2
A3 D1
D
D
δB1 = max(|I| − |A1| − min(|BL1|, |BR1 |) − |D1 |, 0); δC1 = max(|I| − min(|CL1|, |CR1 |) − |D1 |, 0) D1 mapped on Node1
D1 mapped on Node3
D
δA1 = max(max(|I| − |B1| − min(|AL1|, |AR1 |), |I| −min(|AL2|, |AR2 |) − min(|AL3|, |AR3 |)) − |D1 |, 0)
Figure 13. Metric for the Subset Selection Heuristic
(13) TVLSI-00246-2002.R1 culate the slack resulted after we move away processes belonging to these applications from the interval I. For example, the resulted slack available after modifying application C (moving C1 either to the left or to the right inside its own [ASAP, ALAP] interval) is of size |I| − min(|C1L|, |C1R|). With C1L(C1R) we denote that slice of process C1 which remains inside the interval I after C1 has been moved to the extreme left (right) inside its own [ASAP, ALAP] interval. |C1L| represents the length of slice C1L. Thus, when considering process D1, ∆C D will be incremented with δC 1 = max(|I| − min(|C1L|, |C1R|) − |D1|, 0). This value shows the maximum theoretical slack usable for D1, that can be produced by modifying application C. By relating this slack to the length of D1, the value δCD1 also captures the amount of flexibility provided by that modification. The increments δBD1 and δAD1 to be added to the values of ∆B and ∆A respectively, are also presented in Figure 13. IMS then continues the evaluation of the metrics ∆ with the other processes belonging to the current application D (with the assumption that process D1 has been scheduled at the beginning of interval I). Thus, as result of the failed attempt to map and schedule application D, the metrics ∆A, ∆B, and ∆C will be produced. If the initial mapping was successful, the first step of MS could fail during the attempt to satisfy the second criterion (Figure 11). In this case, the metric ∆Γi is computed in a different way. What ∆Γi will capture in this case, is the potential of an application Γi to improve the metric C2 if remapped together with Γcurrent. Therefore, we consider a total number of moves from all the non-frozen applications. These moves are determined using the PotentialMoveC2 functions presented in Section VI-B. Each such move will lead to a different mapping and schedule, and thus to a different C2 value. Let us consider δmove as the improvement on C2 produced by the currently considered move. If there is no improvement, δmove = 0. Thus, for each move that has as subject Pj or mj ∈ Γi, we increment the metric ∆Γi with the δmove improvement on C2. As shown in the algorithm in Figure 11, MS starts by trying an implementation of Γcurrent with Ω = ∅. If this attempt fails, because of one of the two reasons mentioned above, the corresponding metrics ∆Γi are computed for all Γi ∈ ψ. Our heuristic SH will then start by finding the solution ΩGH produced with the greedy heuristic GH (this will succeed if there exists any solution). The total modification cost corresponding to this solution is RGH=R(ΩGH) and the value of the metric ∆ is ∆GH = ∆(ΩGH). SH now continues by trying to find a solution with a more favourable Ω than ΩGH (a smaller total cost R). Therefore, the thresholds Rmax=RGH and ∆min=∆GH/n (for our experiments we considered n = 2) are set. Sets of applications not fulfilling these thresholds will not be investigated by MS. For generating new subsets Ω, the function NextSubset now follows a similar approach like in the exhaustive search approach ES, but in a reverse direction, towards smaller subsets (starting with the set containing all non-frozen applications), and it will consider only subsets with a smaller total cost then Rmax and a larger ∆ than ∆min (a small ∆ means a reduced potential to eliminate the cause of the initial failure). Each time a valid solution
is found, the current values of Rmax and ∆min are updated in order to further restrict the search space. The heuristic stops when no subset can be found with ∆ > ∆min, or a certain imposed limit has been reached (e.g., on the total number of attempts to find new subsets). VII. EXPERIMENTAL RESULTS In the following three sections we show a series of experiments that demonstrate the effectiveness of the proposed approach and algorithms. The first set of results is related to the efficiency of our mapping and scheduling algorithm and the iterative design transformations proposed in Sections VI-A and B. The second set of experiments evaluates our heuristics for minimization of the total modification cost presented in Section VI-C. As a general strategy, we have evaluated our algorithms performing experiments on a large number of test cases generated for experimental purpose. Finally, we have validated the proposed approach using a real-life example. All experiments were run on a SUN Ultra 10 workstation. A. Evaluation of the IMS Algorithm and the Iterative Design Transformations For evaluation of our approach we used process graphs of 80, 160, 240, 320 and 400 processes, representing the application Γcurrent, randomly generated for experimental purpose. Thirty graphs were generated for each graph dimension, thus a total of 150 graphs were used for experimental evaluation. We generated both graphs with random structure and graphs based on more regular structures like trees and groups of chains. We generated a random structure graph deciding for each pair of two processes if they should be connected or not. Two processes in the graph were connected with a certain probability (between 0.05 and 0.15, depending on the graph dimension) on the condition that the dependency would not introduce a loop in the graph. The width of the tree-like structures was controlled by the maximum number of direct successors a process can have in the tree (from 2 to 6), while the graphs consisting of groups of chains had 2 to 12 parallel chains of processes. Furthermore, the regular structures were modified by adding a number of 3 to 30 random cross-connections. Execution times and message lengths were assigned randomly using both uniform and exponential distribution within the 10 to 100 ms, and 2 to 8 bytes ranges, respectively. We considered an architecture consisting of 10 nodes of different speeds. For the communication channel we considered a transmission speed of 256 kbps and a length below 20 meters. The maximum length of the data field in a bus slot was 8 bytes. Throughout the experiments presented in this section we have considered an existing set of applications ψ consisting of 400 processes, with a schedule table of 6s on each processor, and a slack of about 50% of the total schedule size. The mapping of the existing applications has been done using a simple heuristic that tries to balance the utilization of processors while minimizing communication. The scheduling of the ap-
(14) TVLSI-00246-2002.R1 Table 1. Evaluation of the Initial Mapping and Scheduling HCP
IMS
No. of Procs.
avg.
max.
better
avg.
max.
better
80
2.04%
31.57%
10%
0.35%
1.47%
30%
160
3.12%
48.89%
10%
1.18%
5.44%
33.33%
240
5.53%
61.27%
13.33%
1.38%
14.52%
36.66%
320
6.12%
88.57%
16.66%
2.79%
24.33%
40%
400
11.02%
120.77%
13.33%
2.78%
22.52%
36.66%
plications ψ has been performed using list scheduling, and the schedules obtained have then been stretched to their deadline by introducing slacks distributed uniformly over the schedule table. In this section we have also considered that no modifications of the existing set of applications ψ are allowed when implementing a new application. We will concentrate on the aspects related to the modification of existing applications, in the following section. The first result concerns the quality of the designs produced by our initial mapping and scheduling algorithm IMS. As discussed in Section VI-A, IMS uses the MPCP priority function which considers particularities of the TDMA protocol. In our experiments we compared the quality of designs (in terms of schedule length) produced by IMS with those generated with the original HCP algorithm proposed in [13]. Results are depicted in Table 1 where we have three columns for both HCP and IMS. In the columns labelled “average” we present the average percentage deviations of the schedule length produced with HCP and IMS from the length of the best schedule among the two. In the “maximum” column we have the maximum percentage deviation, and the column with the heading “better” shows the percentage of cases in which HCP or IMS was better than the other. For example, for 240 processes, HCP had an average percentage deviation from the best result of 5.53%, compared to 1.38% for IMS. Also, in the worst case, the schedule length obtained with HCP was 61.27% larger than the one ob-
tained with IMS. There were four cases (13.33%) in which HCP has obtained a better result than IMS, compared to 11 cases (36.66%) where IMS has obtained a better result. For the rest of the 15 cases, the schedule lengths obtained were equal. We can observe that, in average, the deviation from the best result is 3.28 times smaller with IMS than with HCP. The average execution times for both algorithms are under half a second for graphs with 400 processes. For the next set of experiments we were interested to investigate the quality of the design transformation heuristic discussed in Section VI-B, aiming at the optimization of the objective function C. In order to compare this heuristic, implemented in our mapping and scheduling approach MS, we have developed two additional heuristics: 1. A Simulated Annealing strategy (SA) [36], based on the same moves as described in Section VI-B. SA is applied on the solution produced by IMS and aims at finding the nearoptimal mapping and schedule that minimizes the objective function C. The main drawback of the SA strategy is that in order to find the near-optimal solution it needs very large computation times. Such a strategy, although useful for the final stages of the system synthesis, cannot be used inside a design space exploration cycle. 2. A so called ad-hoc approach (AH) which is a simple, straight-forward solution to produce designs that, to a certain degree, support an incremental process. Starting from the initial valid schedule of length S obtained by IMS for a graph G with N processes, AH uses a simple scheme to redistribute the processes inside the [0, D] interval, where D is the deadline of process graph G. AH starts by considering the first process in topological order, let it be P1. It introduces after P1 a slack of size max(smallest process size of Γfuture, (D - S) / N), thus shifting all descendants of P1 to the right (towards the end of the schedule table). The insertion of slacks is repeated for the next process, with the current, larger value of S, as long as the resulted schedule has a length S ≤ D. Processes are moved only as long as their in-
50 Average Execution Time [min]
Average Percentage Deviation [%]
140 AH
120
MH S
100
SA
80 60 40 20 0 40
80 160 240 Number of processes
320
a) Deviation of the objective function obtained with MS and AH from that obtained with SA
AH
40
MH S SA
30 20 10 0 40
80 160 240 Number of processes
b) Execution times
Figure 14. Evaluation of the Design Transformation Heuristics
320
(15) TVLSI-00246-2002.R1 dividual deadlines (if any) are not violated. Our heuristic (MS), proposed in VI-B, as well as SA and AH have been used to map and schedule each of the 150 process graphs on the target system. For each of the resulted designs, the objective function C has been computed. Very long and expensive runs have been performed with the SA algorithm for each graph and the best ever solution produced has been considered as the near-optimum for that graph. We have compared the objective function obtained for the 150 process graphs considering each of the three heuristics. Figure 14a presents the average percentage deviation of the objective function obtained with the MS and AH from the value of the objective function obtained with the near-optimal scheme (SA). We have excluded from the results in Figure 14a, 37 solutions obtained with AH for which the second design criterion has not been met, and thus the objective function has been strongly penalized. The average run-times of the algorithms are presented in Figure 14b. The SA approach performs best in terms of quality at the expense of a large execution time: The execution time can be up to 45 minutes for large graphs of 400 processes. The important aspect is that MS performs very well, and is able to obtain good quality solutions, very close to those produced with SA, in a very short time. AH is, of course, very fast, but since it does not address explicitly the two design criteria presented in Section V it has the worst quality of solutions, as expressed by the objective function. The most important aspect of the experiments is determining to which extent the design transformations proposed by us, and the related heuristic, really facilitate the implementation of future applications. To find this out, we have mapped graphs of 80, 160, 240 and 320 nodes representing the Γcurrent application on top of ψ (the same ψ as defined for the previous set of experiments). After mapping and scheduling each of these graphs we have tried to add a new application Γfuture to the resulted system. Γfuture consists of a process graph of 80 processes, randomly generated according to the following specifications: St = {20, 50, 100, 150, 200 ms}, ft(St) = {10, 25, 45, 15, 5%}, Sb = {2, 4, 6, 8 bytes}, fb(Sb) = {20, 50, 20, 10%}, Tmin = 250 ms, tneed = 100 and bneed = 20 ms. The experiments have been performed three times: using MS, SA and AH for mapping Γcurrent. In all three cases we were interested
Percentage of successful implementations of Γfuture [%]
100
SA MS AH
80 60 40 20 0 80
160 240 320 Number of processes in Γcurrent
Figure 15. Percentage of Future Applications Successfully Implemented
if it is possible to find a correct implementation for Γfuture on top of Γcurrent using the initial mapping and scheduling algorithm IMS (without any modification of ψ or Γcurrent). Figure 15 shows the percentage of successful implementations of Γfuture for each the three cases. In the case Γcurrent has been implemented with MS and SA, this means using the design criteria and metrics proposed in the paper, we were able to find a valid schedule for 65% and 68% of the total cases, respectively. However, using AH to map Γcurrent, has led to a situation where IMS is able to find correct solutions in only 21% of the cases. Another conclusion from Figure 15 is that when the total slack available is large, as in the case Γcurrent has only 80 processes, it is easy for MS and, to a certain extent, even for AH to find a mapping that allows adding future applications. However, as Γcurrent grows to 240 processes, only MS and SA are able to find an implementation of Γcurrent that supports an incremental design process, accommodating the future application in more than 60% of the cases. If the remaining slack is very small, after we map a Γcurrent of 320 processes, it becomes practically impossible to map new applications without modifying the current system. Moreover, our mapping heuristic MH performs very well compared to the simulated annealing approach SA which aims for the near-optimal value of the objective function. B. Evaluation of the Modification Cost Minimization Heuristics For this set of experiments we first used the same 150 process graphs as in the previous section, consisting of 80, 160, 240, 320 and 400 processes, for the application Γcurrent. We also considered the same system architecture as presented there. The first results concern the quality of the solution obtained with our mapping strategy MS using the search heuristic SH compared to the case when the simple greedy approach GH and the exhaustive search ES are used. For the existing applications we have generated five different sets ψ, consisting of different numbers of applications and processes, as follows: 6 applications (320 processes), 8 applications (400 processes), 10 applications (480 processes), 12 applications (560 processes), 14 applications (640 processes). The process graphs in the applications as well as their mapping and scheduling were generated as described in the introduction of Section VII-A. After generating the applications we have manually assigned modification costs in the range 10 to 100, depending on their size. The dependencies between applications (in the sense introduced in Section IV-A) were such that the total number of possible subsets Ω resulted for each set ψ were 32, 128, 256, 1024, and 4096 respectively. We have considered that the future applications, Γfuture, are characterized by the following parameters: St = {20, 50, 100, 150, 200 ms}, ft(St) = {10, 25, 45, 15, 5%}, Sb = {2, 4, 6, 8 bytes}, fb(Sb) = {20, 50, 20, 10%}, Tmin = 250 ms, tneed = 100 ms and bneed = 20 ms. MS has been used to produce a valid solution for each of the 150 process graphs representing Γcurrent, on each of the target configurations ψ, using the ES, GH and SH approaches to sub-
1200 1200 G AH
1000 1000
SH
800 800
ES
600 600 400 400 200 200
00 320(6)
320
400(8)
480(10)
560(12)
640(14)
Average Execution Time [min]
Average Modification Cost R(Ω)
(16) TVLSI-00246-2002.R1 140 140 120 120
G AH
100 100
SH
400 480 560 640 Number of Processes (applications) in ψ
ES
80 80
60 60 40 40 20 20 00
320(6) 320
400(8) 400
480(10) 480
560(12) 560
640(14) 640
Number of Processes (applications) in ψ
a) Modification Cost obtained with the GH, SH, and ES heuristics
b) Execution times
Figure 16. Evaluation of the Modification Cost Minimization
set selection. Figure 16a compares the three approaches based on the total modification cost needed in order to obtain a valid solution. The exhaustive approach ES is able to obtain valid solutions with an optimal (smallest) modification cost, while the greedy approach GH produces in average 3.12 times more costly modifications in order to obtain valid solutions. However, in order to find the optimal solution ES needs large computation times, as shown in Figure 16b. For example, it can take more than 2 hours in average to find the smallest cost subset to be remapped that leads to a valid solution in the case of 14 applications (640 processes). We can see that the proposed heuristic SH performs well, producing close to optimal results with a good scaling for large application sets. For the results in Figure 16 we have eliminated those situations in which no valid solution could be produced by MS. Finally, we have repeated the last set of experiments discussed in the previous section (the experiments leading to the results in Figure 15). However, in this case, we have allowed the current system (consisting of ψ ∪ Γcurrent) to be modified when implementing Γfuture. If the mapping and scheduling heuristic is allowed to modify the existing system then we are able to increase the total number of successful attempts to implement application Γfuture from 65% to 77.5%. For the case with Γcurrent consisting of 160 processes (when the amount of available resources for Γfuture is small) the increase is from 60% to 92%. Such an increase is, of course, expected. The important aspect, however, is that it is obtained not by randomly selecting old applications to be modified, but by performing this selection such that the total modification cost is minimized.
that the CC will operate in an environment consisting of several nodes interconnected by a TTP channel (Figure 17). There are four nodes which functionally interact with the CC system: the Anti-lock Braking System (ABS), the Transmission Control Module (TCM), the Engine Control Module (ECM), and the Electronic Throttle Module (ETM). It has been decided to map the functionality (processes) of the CC over these four nodes. The ECM and ETM nodes have an 8-bit Motorola M68HC11 family CPU with 128 Kilobytes of memory, while the ABS and TCM are equipped with a 16-bit Motorola M68HC12 CPU and 256 Kilobytes of memory. The 16-bit CPUs are twice faster than the 8-bit ones. The transmission speed of the communication channel is 256 kbps and the frequency of the TTP controller was chosen to be 20 MHz. We have modelled the specification of the CC system using a set of 32 processes and 17 messages as described in [28]. The period was 300 ms, equal to the deadline. The system ψ, representing the applications already running on the four nodes mentioned earlier, has been modelled as a set of 80 processes with a schedule table of 300 ms and leaving a total of 40% slack. We have assigned to each application a modification cost proportional to the number and size of processes. The CC is the Γcurrent application to be implemented. We have also generated 30 future applications of 40 processes each, with the general characteristics close to those of the CC, which are typical for automotive applications. We have first mapped and scheduled the CC on top of ψ, using the
Future application
C. The Vehicle Cruise Controller A typical safety critical application with hard real-time constraints, to be implemented on a TTP based architecture, is a vehicle cruise controller (CC). We have considered a CC system derived from a requirement specification provided by the industry. The CC delivers the following functionality: it maintains a constant speed for speeds over 35 km/h and under 200 km/h, offers an interface (buttons) to increase or decrease the reference speed, and is able to resume its operation at the previous reference speed. The CC operation is suspended when the driver presses the brake pedal. The specification assumes
Cruise Controller
ABS TTP
TCM TTP
ECM TTP
ETM TTP
...
TTP
TTP bus Figure 17. Implementation of the Cruise Controller
(17) TVLSI-00246-2002.R1 ad-hoc strategy (AH) and then our MS algorithm. On the resulted systems, consisting of ψ ∪ CC, we tried to implement each of the 30 future applications. First we considered a situation in which no modifications of the existing system are allowed when implementing the future applications. In this case, we were able to implement 21 of the 30 future applications after implementing the CC with MS, while using AH to implement the CC, only 4 of the future applications could be mapped. When modifications of the current system were allowed, using MS, we were able to map 24 of the 30 future applications on top of the CC. For the CC example SA has obtained the same results as MS.
REFERENCES [1]
[2]
[3] [4]
[5]
VIII. CONCLUSIONS We have presented an approach to the incremental design of distributed hard real-time embedded systems. Such a design process satisfies two main requirements when adding new functionality: already running applications are disturbed as little as possible, and there is a good chance that, later, new functionality can easily be mapped on the resulted system. Our approach assumes a non-preemptive static cyclic scheduling policy and a realistic communication model based on a TDMA scheme. We have introduced two design criteria with their corresponding metrics that drive our mapping strategy to solutions supporting an incremental design process. These solutions are obtained using an efficient transformation based heuristic. Three algorithms have been proposed to produce a minimal subset of applications which have to be remapped and rescheduled in order to implement the new functionality. ES is based on a, potentially slow, branch and bound strategy which finds an optimal solution. GH is very fast but produces solutions that could be of too high cost, while SH is able to quickly produce good quality results. The approach has been evaluated based on extensive experiments using a large number of generated benchmarks as well as a real-life example. Although the concrete architecture used to illustrate our approach is a distributed embedded system, typically used in automotive applications, the proposed strategy and heuristics can as well be used for on-chip architectures and platforms. There are several aspects that have been omitted from the discussion in this paper. In [29] we have extended our approach to real-time systems where process scheduling is based on a static priority preemptive approach. For the sake of simplifying the discussion, we have also not addressed here the memory constraints during process mapping and the implications of memory space in the incremental design process. An extension of the approach in order to consider memory space as another resource in addition to processor time and bus bandwidth is, however, straightforward. We have also not discussed in this paper the issue of architecture selection, considering that the designer has taken the appropriate decisions before starting the mapping and scheduling procedure.
[6]
[7]
[8]
[9]
[10] [11]
[12]
[13]
[14]
[15]
[16]
[17] [18] [19]
[20]
J. E. Beck, D. P. Siewiorek, “Automatic Configuration of Embedded Multicomputer Systems”, IEEE Transactions on CAD, Vol. 17, No. 2, 1998, pp. 84–95. T. Blicke, J. Teich, L. Thiele, “System-Level Synthesis Using Evolutionary Algorithms”, Design Automation for Embedded Systems, Vol. 4, No. 1, 1998, pp. 23–58. B. W. Boehm, et al, Software Cost Estimation with COCOMO II, Prentice-Hall, 2000. E. G. Coffman Jr. and R.L. Graham, “Optimal Scheduling for two Processor Systems”, Acta Informatica, No. 1, 1972, pp. 200–213. B. P. Dave, G. Lakshminarayana, N. K. Jha, “COSYN: Hardware-Software Co-Synthesis of Heterogeneous Distributed Embedded Systems”, IEEE Transactions on VLSI Systems, March 1999, pp. 92–104. J. A. Debardelaben, V. K. Madiseti, A. J. Gadient, “Incorporating Cost Modeling in Embedded-System Design”, IEEE Design & Test of Computers, July-September 1997, pp. 24–35. P. Eles, Z. Peng, K. Kuchcinski, A. Doboli, “System Level Hardware/Software Partitioning Based on Simulated Annealing and Tabu Search”, Design Automation for Embedded Systems, Vol. 2, No. 1, 1997, pp. 5–32. P. Eles, A. Doboli, P. Pop, Z. Peng, “Scheduling with Bus Access Optimization for Distributed Embedded Systems”, IEEE Transactions on VLSI Systems, Vol. 8, No 5, October 2000, pp. 472–491. R. Ernst, J. Henkel, T. Benner, “Hardware-Software Cosynthesis for Microcontrollers”, IEEE Design & Test of Computers, Vol. 10, Sept. 1993, pp. 64–75. R. Ernst, “Codesign of Embedded Systems: Status and Trends”, IEEE Design & Test of Computers, April-June, 1998, pp. 45–54. D. D. Gajski and F. Vahid, “Specification and Design of Embedded Hardware-Software Systems,” IEEE Design & Test of Computers, Spring 1995, pp. 53–67. R. K. Gupta, G. De Micheli, “Hardware-software cosynthesis for digital systems”, IEEE Design & Test of Computers, Vol. 10, Sept. 1993, pp. 29–41. P. B. Jorgensen, J. Madsen, “Critical Path Driven Cosynthesis for Heterogeneous Target Architectures,” Proceedings of the International Workshop on Hardware-Software Co-design, 1997, pp. 15–19. C. Haubelt, J. Teich, K. Richter, R. Ernst, “System design for flexibility”, Proceedings of the Design, Automation and Test in Europe Conference, 2002, pp. 854–861. A. Kalawade, E.A. Lee, “The Extended Partitioning Problem: Hardware/Software Mapping, Scheduling, and ImplementationBin Selection”, Design Automation for Embedded Systems, Vol. 2, 1997, pp. 125–163. P. V. Knudsen, J. Madsen, “Integrating Communication Protocol Selection with Hardware/Software Codesign”, IEEE Transactions on CAD, Vol. 18, No. 8, 1999, pp. 1077–1095. H. Kopetz, Real-Time Systems-Design Principles for Distributed Embedded Applications, Kluwer Academic Publishers, 1997. H. Kopetz, G. Grünsteidl, “TTP-A Protocol for Fault-Tolerant Real-Time Systems,” IEEE Computer, 27(1), 1994, pp. 14–23. K. Keutzer, S. Malik, R. Newton, J. Rabaey, A. SangiovanniVincentelli, “System-Level Design: Orthogonalization of Concerns and Platform-Based Design”, IEEE Transactions on Computer-Aided Design of Integrated Circuits and Systems, Vol. 19, No. 12, December 2000, pp. 1523–1543. C. Lee, M. Potkonjak, W. Wolf, “Synthesis of Hard Real-Time
(18) TVLSI-00246-2002.R1
[21]
[22] [23] [24] [25]
[26]
[27]
[28]
[29]
[30]
[31]
Application Specific Systems”, Design Automation for Embedded Systems, Vol. 4, No. 4, 1999, pp. 215–241. Yanbing Li, T. Callahan, E. Darnell, R. Harr, U. Kurkure, J. Stockwood, “Hardware-Software Co-Design of Embedded Reconfigurable Architectures”, Proceedings of the Design Automation Conference, 2000, 507–512. S. Martello, P. Toth, Kanpsack Problems: Algorithms and Computer Implementations, Wiley, 1990. G. Martin, F. Schirrmeister, “A design chain for embedded systems”, Computer, Vol. 35 Issue 3, March 2002, pp. 100–103. G. De Micheli and M.G. Sami, Eds., Hardware/Software Co-Design, NATO ASI 1995, Kluwer Academic Publishers, 1996. G. De Micheli and R.K. Gupta, “Hardware/Software Co-Design”, Proceedings of the IEEE, Vol. 85, No. 3, 1997, pp. 349– 365. S. Narayan, D.D. Gajski, “Synthesis of System-Level Bus Interfaces”, Proceedings of the European Desing and Test Conference, 1994, pp. 395–399. R.B. Ortega, G. Borriello, “Communication Synthesis for Distributed Embedded Systems”, Proceedings of the International Conference on CAD, 1998, pp. 437–444. P. Pop, Analysis and Synthesis of Communication-Intensive Heterogeneous Real-Time Systems, Linköping Studies in Science and Technology, Ph.D. Dissertation No. 833. P. Pop, P. Eles, Z. Peng, “Flexibility Driven Scheduling and Mapping for Distributed Real-Time Systems”, Proceedings of the International Conference on Real-Time Computing Systems and Applications, 2002, pp. 337–346. P. Pop, P. Eles, Z. Peng, “Scheduling with Optimized Communication for Time-Triggered Embedded Systems,” Proceedings of the International Workshop on Hardware-Software Co-Design, 1999, pp. 178–182. P. Pop, P. Eles, T. Pop, Z. Peng, “An Approach to Incremental Design of Distributed Embedded Systems,” Proceedings of the Design Automation Conference, 2001, pp. 450–455.
[32] P. Pop, P. Eles, T. Pop, Z. Peng, “Minimizing System Modification in an Incremental Design Approach”, Proceedings of the International Workshop on Hardware/Software Codesign, 2001, pp. 183–188. [33] S. Prakash, A. Parker, “SOS: Synthesis of Application-Specific Heterogeneous Multiprocessor Systems”, Journal of Parallel and Distributed Computing, V16, 1992, pp. 338–351. [34] P. Puschner, A. Burns, “A Review of Worst-Case ExecutionTime Analyses”, Real-Time Systems Journal, Vol. 18, No. 2/3, May 2000, pp 115–128. [35] D. Ragan, P. Sandborn, P. Stoaks, “A Detailed Cost Model for Concurrent Use with Hardware/Software Co-Design”, Proceedings of the Design Automation Conference, 2002, pp. 269–274. [36] C. R. Reevs, Modern Heuristic Techniques for Combinatorial Problems, Blackwell Scientific Publications, 1993. [37] D. L. Rhodes, W. Wolf, “Co-Synthesis of Heterogeneous Multiprocessor Systems using Arbitrated Communication”, Proceeding of the International Conference on CAD, 1999, pp. 339 –342. [38] A. Sangiovanni-Vincentelli, “Electronic-System Design in the Automobile Industry”, IEEE Micro, Vol. 23, Issue 3, May-June 2003, pp 8–18. [39] J. Staunstrup and W. Wolf, Eds., Hardware/Software Co-Design: Principles and Practice, Kluwer Academic Publishers, 1997. [40] W. Wolf, “An Architectural Co-Synthesis Algorithm for Distributed, Embedded Computing systems”, IEEE Transactions on VLSI Systems, June 1997, pp. 218–229. [41] T. Y. Yen, W. Wolf, Hardware-Software Co-Synthesis of Distributed Embedded Systems, Kluwer Academic Publishers., 1997. [42] W. Wolf, “Hardware-Software Co-Design of Embedded Systems”, Proceedings of the IEEE, Vol. 82, No. 7, 1994, pp. 967– 989. [43] REVIC Software Cost Estimating Model, User’s Manual, V9.09.2, US Air Force Analysis Agency, 1994. [44] SoftEST - Version 1.1, US Air Force Analysis Agency, 1997.