Available online at www.sciencedirect.com
ScienceDirect Energy Procedia 49 (2014) 1328 – 1339
SolarPACES 2013
Dynamic simulation of the operation of a molten salt parabolic trough plant, comprising draining procedures M. Falchettaa, *, A. G. Rossib a
ENEA Renewable Energy Technical Unit, V. Anguillarese 301, 00123 Roma, Italy b Scientific consultant, V. R. Fucini 54, 56127 Pisa, Italy
Abstract The dynamic simulation of a molten salt operated parabolic trough plant is presented. The simulated plant is a typical 9 MWe CSP unit comprising 10 loops with 8 collectors in series (in turn this can be a “module” of a larger CSP solar field) a Two Tanks TES and a molten salt Steam Generator. This type of plant represents a challenge due to the large extension and relative complication of piping network operating with molten salt, in comparison to e.g. a molten salt Tower. The simulation model, implemented in Isaac Dynamics environment, is able to represent the normal operation of the plant with circulating HTF at variable mass flow depending on input DNI, and night circulation at reduced mass flow. In addition, in molten salt operated CSP plants draining operations are of prominent importance, given that these operations should be operated within a due time (depending on boundary conditions) avoiding the possible freezing of the salt mixture. Moreover also emergency draining (e.g. as a consequence of faults in the pump and/or in heat trace equipment) should be analyzed. At this purpose, the model has been modified and utilized to represent also circuit draining, involving flow reversal, that normally requires use of specialized thermo-hydraulic codes like Relap (Reactor Loss of coolant Analysis Program). In conclusion, the paper shows how the simulation environment is able to represent most of the dynamics that affect the operation of a molten salt parabolic trough plant. © 2013 The Authors. Published by Elsevier Ltd. This is an open access article under the CC BY-NC-ND license
2013 The Authors. Published by Elsevier Ltd. © (http://creativecommons.org/licenses/by-nc-nd/3.0/). Selection and byby thethe scientific conference committee of SolarPACES 2013 under of PSE AG. Selection andpeer peerreview review scientific conference committee of SolarPACES 2013responsibility under responsibility of PSE AG. Final manuscript published as received without editorial corrections. Keywords: CSP; dynamic simulation; process control; molten salt
* Corresponding author. Tel.: +39-06-30484708; fax: +39-06-30486486. E-mail address:
[email protected]
1876-6102 © 2013 The Authors. Published by Elsevier Ltd. This is an open access article under the CC BY-NC-ND license
(http://creativecommons.org/licenses/by-nc-nd/3.0/). Selection and peer review by the scientific conference committee of SolarPACES 2013 under responsibility of PSE AG. Final manuscript published as received without editorial corrections. doi:10.1016/j.egypro.2014.03.142
M. Falchetta and A.G. Rossi / Energy Procedia 49 (2014) 1328 – 1339
1329
1. Introduction The paper deals with the dynamic simulation of a typical parabolic trough solar plant, using molten salt as Heat Transfer Fluid (HTF) and Storage Medium, with a typical Two Tanks storage system configuration and a 9 MWe Power Block composed by molten salt Steam Generator (SG) feeding a Steam Turbine that in turn drives an electric alternator. Nomenclature ANI DNI HTF LEC SF SG ST TES
Aperture Normal Irradiation Direct Normal Irradiation Heat Transfer Fluid Levelized Energy Cost Solar Field Steam Generator Steam Turbine Thermal Energy Storage
A molten salt parabolic trough plant – producing saturated steam for a Combined Cycle Power Station, with a 5 MWe equivalent output - has been designed, built and commissioned in 2010 in the frame of an ENEA/ENEL collaboration (Archimede) [1], and is actually operated by the ENEL electric utility. The 9 MWe stand-alone unit here studied is similar in size (roughly 50% more with respect to total collector’s active area) and it’s not optimized with respect to the component’s sizing since the main objective of the study is not the optimization of the energy yield and LEC but the insight on some of the plant’s typical operations peculiar to the use of molten salts as HTF in the troughs. Indeed, from the point of view of a larger, commercial size solar field (e.g., 50 MWe or more), the simulated unit SF can be considered as a “typical section” of the whole SF, while either the Tanks and the Power block will be similar even if with different specification data. 2. Main plant’s characteristics 2.1. Plant’s main components The simulation plant represents a typical 9 MWe size stand-alone molten salt parabolic trough plant, whose main components (fig. 1) are: ‚ Molten salt operated SF ‚ Two Tanks TES with Cold and Hot Tank ‚ Power Block with SG and ST
Fig. 1. Basic scheme of the plant
1330
M. Falchetta and A.G. Rossi / Energy Procedia 49 (2014) 1328 – 1339
2.1.1. Solar Field (SF) The SF is composed by 10 loops of collectors, each with 8 collectors in series, each 100 m. long. Nominal HTF input and output temperature to/from the loops are 290 and 550 °C, respectively. The HTF is supplied to the SF by means of a Circulation Pump; two distribution lines are provided, connecting all the collector loops in parallel. Each loop has an input valve, used also to directly control the loop’s output temperature or to equalize the output temperatures among the different loops, and output valve. Both can be used to isolate the loop in case of maintenance. 2.1.2. Thermal Energy Storage (TES) The TES is a classical Two-Tanks arrangement. The Cold tank has a nominal operating temperature of 290 °C, but depending on operating conditions its temperature is expected to vary in the range 275 – 350 °C. The Hot Tank has a nominal operating temperature of 550 °C, even if a variation in the range 530-550 °C can be normally expected depending on operating conditions. The temperature of the Hot Tank of course directly determines the Steam Temperature, so a main operational objective is to keep such temperature as high as possible. 2.1.3. Power Block The Power Block has a 25 MWth molten salt operated natural circulation Steam Generator (SG) with Economizer, Evaporator, ReHeater, SuperHeater and Drum. Nominal Steam temperature is 540 °C @100 bar. The Steam Turbine has a High Pressure Stage (100 bar) and a Medium Pressure stage (32 bar). 2.1.4. Summary of main plant’s data The main plant’s data are summarized in Table 1. Table 1. Main Plant’s data Solar Field Number of Loops
10
Number of Collectors
80
Collector’s Length (m)
100
Collector’s active area (m2)
587
Receiver diameter (mm)
70
Receiver length (m)
4.06
Loop Nominal Mass Flow (kg/s)
8
Loop Maximum Mass Flow (kg/s)
9.2
SF Nominal Mass Flow (kg/s)
80
SF Maximum Mass Flow (kg/s)
92
Tank Diameter (m)
16.5
Tank Useful Level Excursion (m)
5.6
Tank operative volume (m3)
1200
TES Storage capacity (MWh)
225
25
Nominal Electric Capacity (MWe)
9
TES
Power Block SG thermal capacity (MWth)
3. Focus and approach 3.1. Focus of the simulation The main focus of the work presented here is: ‚ the basic behavior of the solar field during a typical day, either in summer “clear sky” conditions and in a typical spring conditions with perturbed DNI ‚ the draining operation of either a single loop (e.g., for maintenance) and of the whole solar field. Indeed such operations are particularly important and critical in the case of a molten salt operated SF, since the melting temperature of the HTF is 238 °C, therefore a particular issue is to avoid salt freezing during the operation.
M. Falchetta and A.G. Rossi / Energy Procedia 49 (2014) 1328 – 1339
1331
3.2. Simulation approach The simulation is performed using the Isaac Dynamics [5] simulation environment, that allows a fully dynamic approach whose description and application to CSP plants is reported in previous papers (see [2,3,4]). In the Isaac Dynamics environment either “models” or “simulators” can be developed, the difference being that in a model all the equations are solved simultaneously, while a simulator can be composed by a number of models that are not solved simultaneously and interact introducing a small delay time; such approach is useful in order to limit the total number of equations to be treated simultaneously when the physical systems includes basically decoupled phenomena. In the specific case, three models have been developed: ‚ the model of the Solar Field and Thermal Storage for normal operation ‚ the model of the Solar Field and Thermal Storage for draining purposes ‚ the model of the Power Block (SG and ST) In turn, the models of the Solar Field and of the Power Block can be combined to form a full plant simulator. Indeed the Solar Field and the Power Block operation are highly decoupled by the Thermal Storage, considering that the typical time step in Isaac Dynamics CSP approach is in the order of 1 sec. On the other hand, draining operation are performed only for maintenance or in case of major faults, so in this case the inclusion of the Power Block operation is nor necessary nor significant. 4. Model description The following description will include also the Power Block for completeness even if the simulations examples will be concentrated on SF operation, with particular emphasis on draining. 4.1. Solar Field As said above, two basic Solar Field models have been developed: a model for “normal” (N) plant operation and a model (D) for “draining” operations. The basic difference is the ability of the D model to additionally treat reverse flow and draining of the piping elements, comprising the collector receivers. Of course the drawback of D model is its increased complexity and reduction of computational speed. In both cases, 5 complete loops (A to E), on left side of the SF are represented, while the other 5 (F to J), on the right side, are represented as an “equivalent loop”, as shown in fig. 2.
Fig. 2. Solar Field Scheme
1332
M. Falchetta and A.G. Rossi / Energy Procedia 49 (2014) 1328 – 1339
4.1.1. N model The N model is adopted for normal operation. The Loop model is shown in fig. 3, where only 4 collectors over 8 are represented for clarity. Each loop model comprises collectors, receivers, input and output valves, passive connection and distribution piping. Each receiver is divided into four 25 m. long sections, comprising pipe and glass envelope. Mass flow in each loop is controlled by a PID controller acting on the input valve in order to equalize the temperature. Such choice is not adopted normally – only global mass flow control is adopted instead but such feature was added just in order to evaluate its performance in principle. The DNI to the collectors is derived from a dataset of a year of experimental data sampled at 5’. The SUN submodel, visible at the upper left corner, calculate all angles and tracking position according to astronomic calculations based on plant’s position and time. Tracking errors can be introduced individually or collectively if needed. 4.1.2. D model The D Loop model, used for draining, is represented in fig. 4. D model also has 5 complete loops and one equivalent loop connected in parallel to the distribution lines. In this model all piping (e.g., the receivers) allows for reverse flow and draining. Some components are added, representing the intermediate flexible hoses that can act as siphons. Draining valves are added, and air can enter from the vent valve located at half loop position, automatically opened as internal pressure falls below atmospheric pressure. Indeed during drainage each loop branch drains individually, while air enters from the vent valve, substituting the draining molten salt. Receivers quotes above ground are calculated according to tracking angle. Another feature of the D model is the presence of Joule effect power sources for receiver heating, if needed, and the exact representation of piping quotes above ground, in order to calculate the draining flow. At this purpose, the receivers quotes are calculated in relation to the collector tracking position. Collectors in D model are divided into two sections in order to speed-up the calculations. 4.1.3. TES and Power Block models Thermal Storage model, with both Cold and Hot Tanks, piping, pumps and valves is comprised in both the N and D Solar Field models. While during production the HTF flows from the Cold to the Hot Tank through the SF, recirculation of the HTF in the Cold Tank is provided, by commutating two valves, if the output temperature from the Solar Field falls below a limit, typically 520 °C, in order to maintain as possible the nominal temperature in the Hot Tank. The Power Block model comprises all the major molten salt and water/steam components, with connected regulation, and the two Steam Turbine sections (High Pressure and Medium Pressure). It features also innovative architectural and control solutions that have been previously discussed in [3]. Since the focus of the paper is not the operation of the TES and of the power Block, only a section of the Steam Generator (SG) is shown in fig. 5, just to give an idea of the approach.
M. Falchetta and A.G. Rossi / Energy Procedia 49 (2014) 1328 – 1339
Fig. 3. Loop representation, N model; only 4 over 8 collectors are represented for clarity
1333
1334
M. Falchetta and A.G. Rossi / Energy Procedia 49 (2014) 1328 – 1339
Fig. 4. Loop representation, D model; only 4 over 8 collectors are represented for clarity
1335
M. Falchetta and A.G. Rossi / Energy Procedia 49 (2014) 1328 – 1339
Fig. 5. Medium Pressure Evaporator, Drum and Economizer section of the SG model
5. Simulation results 5.1. Normal operation The N model of the SF with TES has been used to simulate a typical day operation, with real DNI data sampled at 5’. The simulation sampling time is 0.5 sec., that allows typically a 5X computation speed (5 times the real-time) with a quite old 2.66 GHz-core 2 PC. The results show a perturbed DNI day, actually the 1 st of April, since in this case is more interesting from the dynamics point of view than a “clear sky” day in June. DNI and mass flow are shown in fig. 6. The highly variable DNI forces the mass flow to be controlled in a significant range in order to keep the output temperature as close as possible to the set-point (550 °C). The resulting temperatures are shown in fig. 7. Total HTF mass flow in Solar Field
DNI data - 1st April 1000
90
900
80
800
70
HTF mass flow (kg/s)
700
W/m2
600 500 400 300
60 50 40 30
200
20
100
10
0
6
8
10
12
14
16
18
20
0
6
8
Time (hours)
10
12
14
Time (hours)
Fig. 6. left: DNI; right: HTF mass flow in solar Field
16
18
20
1336
M. Falchetta and A.G. Rossi / Energy Procedia 49 (2014) 1328 – 1339
Output Temperatures - 1st April 600 Solar Field Equivalent Loop L Loop A Loop E 550
Output Temperature (°C)
500
450
400
350
300
250
6
8
10
12
14
16
18
20
Time (hours)
Fig. 7. Output Temperatures
It can be observed that the behavior of the “equivalent Loop” (formed by Loops F, G, H, I, L) is quite different from the 5 Loops A to E, especially at low temperatures, where the control algorithm does not operate and since the distribution line real topology has an effect that cannot be easily simulated by an “equivalent” loop. The temperature control algorithm is not optimized yet; indeed an overshoot can be observed after temperature rapidly increases towards the set-point; such overshoot can be reduced or avoided adopting lees efficient but slower control, or more complex predictive strategies and/or introducing also partial defocus actions in the collectors. These actions will be evaluated in the next phase of the research. 5.2. Draining operations The D model is used for draining. Either service draining of one Loop and draining of the full SF have been simulated; two examples are detailed here. 5.2.1. Service draining of one Loop The first test is a service draining of a loop while the rest of the Solar Field remains in operation. The draining operation sequence on a generic Loop X can be described in relation to the scheme in fig. 8, left side, as follows. The first operation is to defocus the collectors, then gently close the Input/Output valves of the Loop (V1X and V2X), thus “bottling” the HTF inside the loop. Then opening the draining valves (V1X_DR and V2X_DR) and the vent valve V4X, the HTF will drain by gravity. Temperatures must be monitored and proper heat trace equipment must be present in order to avoid freezing if initial temperatures are too low. Fig. 8, right side, illustrate the simulation of the maneuver on Loop E (the closer to the central position of the SF) at the beginning of the draining operation. Valve V2E is fully closed before closing valve V1E. Collectors are kept at 0° (with the receivers in vertical position), the best position to drain.
1337
M. Falchetta and A.G. Rossi / Energy Procedia 49 (2014) 1328 – 1339 Loop E - Valve opening
Valve opening
1.5 V1E V1E V2E V2E V1E V1E DR DR V2E V2E DR DR
1
0.5
0
0
50
100
150
Time (sec)
Loop E - Valve mass flow 6 V1E V2E V1E DR V2E DR
Mass flow (kg/s)
5 4 3 2 1 0
0
50
100
150
Time (sec.)
Fig. 8. left: Draining scheme for the generic Loop X;
right: Loop E draining - valve maneuvers
Loop E drainage - HTF mass in receivers rec rec rec rec rec rec rec rec
600
E4 E5 E3 E6 E2 E7 E1 E8
HTF mass (kg)
500
400
E5
E4
E6
E3
E1
E2 E7
E8
300
200
100
0 100
200
300
400
500
600
700
800
900
1000
Time (sec.)
Fig. 9. left: HTF mass during draining of Loop E;
right: HTF mass flow from drain valves
Fig. 9, left, illustrates mass content in receiver lines during drainage, while the drain mass flow is illustrated on the right. Collectors sequence is from E1 to E8, from loop input to output. As it can be observed, most of the draining is concluded in 15’. Total drain, comprising the cue, lasts one hour. First elements to drain are the collectors E4 and E5, the farthest from the distribution line. It must be considered that the drainage starts from an
1338
M. Falchetta and A.G. Rossi / Energy Procedia 49 (2014) 1328 – 1339
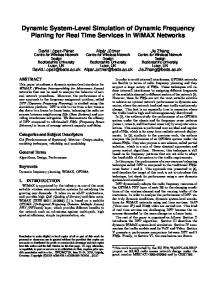
operating condition with an output temperature of 550 °C, therefore the HTF initially contained in the last collector (E8) is less than that of the other collectors, due to the lower density of the HTF. 5.2.2. Draining of the complete Solar Field Draining the whole Solar Field is not a routine operation, but it can be necessary in case of severe faults (e.g., to the main pumps) or in case of a major maintenance of the plant. Also in this case the plant is initially operative at nominal conditions and the collectors, during drainage, are kept in vertical position. The draining operation in this case requires to: ‚ Defocusing collectors and stop the SF circulation pump ‚ Full open all the Input/Output Loop valves (V1X … V2X). ‚ Open two main draining valves located at the main distribution line, that discharge the whole HTF to a service Tank. These valves drain the “hot branch” of the distribution line and the “cold branch”, respectively. Fig. 10 represents the mass content evolution in loops A (left) and E (right). As it can be seen, Loop E drains in advance with respect to Loop A, as expected, since it is closer to the draining valves. In fig. 11 (left) the HTF mass in receiver lines during draining is represented for Loop A to E. Fig.11 (right) shows the temperature evolution in Loop E. Since the draining begun from nominal operating conditions, during draining the hotter fluid coming from collector 4 in the cold branch heats the collectors 1 to 3 and prevents freezing for around 1 h even in the absence of additional Heat trace (supposing a temporary fault in the electric power supply). In less favorable conditions (e.g., during night circulation) additional heating is of course needed very quickly. On the same computer (2.66 GHz-core 2 PC), the D model runs at 0.5X speed (half than real-time) while the N Of course speed of execution depends on computer performance. The same model can model runs at 5X. anyway be used to develop real-time simulators, provided a GUI simulation interface mapping the real plant’s one and sufficient computer speed. Draining of Loop E
Draining of Loop A 700
700 collector A1 A8 A2 A7 A3 A6 A4 A5
A8
HTF mass (kg)
500
A1
A2
600
500
HTF mass (kg)
600
A7
400
A3 A6
300 A4 200
E8 400
300
200
A5
E4
100
100
0
0
0.1
Collector E1 E8 E2 E7 E3 E6 E4 E5
0.2
0.3
0.4
0.5
0.6
0.7
0.8
0.9
1
0
0
0.1
0.2
0.3
Time (hours)
Fig. 10. Left: Mass in Loop A; right: Mass in Loop E
0.4
0.5
0.6
Time (hours)
0.7
0.8
0.9
1
1339
M. Falchetta and A.G. Rossi / Energy Procedia 49 (2014) 1328 – 1339
6. Conclusions Dynamic simulation models of a 9 MWe molten salt parabolic trough plant have been developed and are actually under test at ENEA. The approach is focused on phenomena affecting plant’s process control and operation, comprising draining operations. In large molten salt parabolic trough solar plants the circuits will be normally operating overnight, therefore circuit filling will be made only at initial start-up. Actual focus is on draining, either for maintenance and following a major fault. Next step will be to explore circuit filling phenomena. Different models at different level of simplification are necessary in order to simulate different phenomena in acceptable time. Draining of Loops A-E
Temperature evolution - Loop E
14000 Cold lines Hot lines
500
12000
450
Temperature (°C)
HTF mass (kg)
10000
8000
6000
4000
400 350 300 E1-0
Freeze limit
250
2000
0
Collector E1- section 0 E2-0 E3-0 E4-0 E5-0 E6-0 E7-0 E8-0 E8-1
E8-1
200
0
0.1
0.2
0.3
0.4
0.5
0.6
Time (hours)
0.7
0.8
0.9
1
150
0.2
0.4
0.6
0.8
1
1.2
Time (hours)
1.4
1.6
1.8
2
Fig. 11. Left: HTF Mass evolution in Loops. Right: Temperature evolution in Loop E
Acknowledgements The basic simulator models have been developed by Struttura Informatica under ENEA Contract and ENEA specifications. The authors thank A. Maggi, R. Naso, M. Losito, A. Sani of Struttura Informatica for their technical contribution.
References [1] Falchetta M, Liberati G, Consoli D, Malloggi S, Mazzei D, Crescenzi T. Commissioning of the Archimede 5 MW molten salt parabolic trough solar plant. Proceeding of SolarPaces2010 Conference, September 21-24th 2010, Perpignan (FR). [2] Rossi A, Cossu A, Maccari A. Dysalt: a dynamic simulator for CSP plants focused on molten salt technology. Proceeding of SolarPaces2010 Conference, September 21-24th 2010, Perpignan (FR). [3] Rossi A, Maggi A, Falchetta M. Modeling of a typical molten salt based ISCC plant. Proceedings of SolarPaces2011 Conference, September 20-23th 2011, Granada (E). [4] Rossi A, Naso R, Falchetta M. Investigating Three Tank direct storage CSP operation by dynamic simulation. Proceedings of SolarPaces2012 Conference, September 11-14th 2012, Marrakech. [5] http://www.strutturainformatica.it/dpm/