tion and network that can be retrieved via the SDJS method is the number of active wireless devices in the environment at a given point of time. .... only on this one model and way to take advantage of SDJS. 3.1. The analytic model ..... of the state-of-the-art methods for synchronization in wired and wireless networks. In [16] ...
SDJS: Efficient Statistics in Wireless Networks Albert Krohn, Michael Beigl, Sabin Wendhack Telecooperation Office Universit¨at Karlsruhe {krohn, michael, wendhack}@teco.edu Abstract Synchronous Distributed Jam Signalling (SDJS) is a new transmission scheme targeted to highly mobile and ad hoc wireless systems. It is based on the synchronous, parallel and superimposing emission of jam signal on the physical layer. SDJS is intended to be implemented as a feature on existing standards. It enables those system with the ability to fast estimate statistical parameters. This paper presents SDJS in general and then focuses on the application to estimate the parameter number of devices in a mobile setting. We studied SDJS and its application through a mathematical model and simulations and proved the idea in a realworld implementation on a mobile network, where we estimated the number of devices in real time (within 5ms), increasing the estimation speed compared to traditional approaches by factor 1000.
1. Introduction Communication in pervasive and wearable computing scenarios has to cover tasks that are normally summarized under the name ad hoc networks or sensor networks. The typical properties of those settings are that many devices (which are in this paper also referred to as stations or nodes) work together in a spontaneous peer-to-peer manner without a central access point or master device. The participating devices are highly mobile which requires adequate and very flexible connection methods and data exchange schemes. Communication is normally cell-oriented and supported by routing like surveyed in [1]. The high mobility leads as well to fast changing communication settings. The number of devices working together, their position and many other parameters vary constantly in such settings. For a network protocol this makes it difficult to fix values for elementary parameters. Traditionally, these parameters - e.g. the number of retries for a send, the maximum waiting slot for accessing a channel - are fixed in the protocol and found through empirical studies. This approach is appropriate in many
networks where basic situation parameters do not change too much. In networks where these parameters constantly change - e.g. because network nodes have to work in very different environment and are very mobile - there is a need to adjust such parameters while the network is running. A prerequisite for the adjustment of parameters is the knowledge of the conditions in the environment. Dependent on the protocol used, the number of nodes in a cell, the number of nodes moving, the number of nodes weighted with the distance, or other parameters, may be useful. This finding was validated by an analysis of typical setting in the area of ubiquitous computing, pervasive computing and mobile sensor networks. During various settings in e.g. the Smart-Its [2] project, we designed, simulated, implemented and tested a wireless, RF based sensor and communication platform which is now used in many other projects as well. Typically, the setting contains many nodes - several dozens to hundreds - while at least a part of the nodes is highly mobile and moves very frequently. The nodes are mostly battery powered and therefore sensitive to energy consuming system components. For this reason, the nodes are sometimes in sleep mode but often wake up at the very same moment - triggered by an external event in the environment - and start to send and receive packets. Our experience with the design shows that in such settings classical network subjects like reliable data transmission and routing are still issues, but the importance of measuring and controlling the network states and nodes conditions grows. This is due to the fact that nodes are frequently leaving or joining the network but also because environment conditions are constantly changing. Such change in the conditions influences not only the network behaviour for routing and hand-over but also influences the network behaviour in small areas like the neighbouring nodes in single hop distance. From our experience communication parameters like bit or packet error rate, throughput or channel delay vary, and the number of nodes with non-empty sending buffers or the number of nodes running low on energy influenced the network performance. Furthermore, not only the network tech-
Proceedings of the 12th IEEE International Conference on Network Protocols (ICNP’04) 1092-1648/04 $ 20.00 IEEE
nology but also applications needed to be aware of these changing conditions. For example, in these settings many applications collaborate with other devices to retrieve information from the environment. The confidence in information that is retrieved from a large group of devices can be valued higher than from a low number of devices. We follow this idea in the design of SDJS. The method presented in this paper can also be used to collaboratively read the sensor values from multiple devices in a very short period of time. A tangible example application is an interim storehouse setting with many temperature sensitive goods. Storage conditions like temperature and humidity are a complicated matter and require the use of many distributed sensors. For goods that require precise measurement, sensors will be embedded into the good itself or into the packaging. Such networked sensor systems are already in operation (e.g. [3]). As goods come and go very frequently changes in the temperature have to be captured in time to condition the climate of the room accordingly. Traditional approaches use control or data messages to inform nodes about changing conditions, sensor values etc. This approach consumes considerable amount of bandwidth and therefore energy: Any node that should send an information is requested to send this information as one packet. Even worse, the approach is quite slow and it is likely that the situation has already changed when a full inquiry into the environment has been carried out. This makes such methods inappropriate for us. The method we propose allows us to collect information in a single packet time. This new approach enables networked nodes to estimate and exchange condition parameters via RF communication in a very efficient way. The method is modelled, simulated and implemented in a real world setting with 50 wireless devices. The results of the test runs are promising and presented at the end of the paper. One of the very interesting parameters both for application and network that can be retrieved via the SDJS method is the number of active wireless devices in the environment at a given point of time. The rest of the paper will therefore focus on this use of our system to explain the method in detail beginning with a concrete example in the next section.
1.1. Example application and motivation In the Relate prototype [4] we have developed prototypes for relative positioning of tangible user interface. Relate technology consists of sensors - especially ultrasonic sensors - for determining distances and angles between objects and a wireless link to organize the measurements and to exchange results. For precise measurements it is required
to frequently - in practice several times per second - estimate the number of involved nodes within the environment. A simple approach is to use control messages and ping all devices within the environment. For our setting with large number of devices this is very inefficient. With e.g. 100 devices, the channel access has to handle 100 concurrent accesses. In [5] the mean delays of packet transmissions in a single hop networks based on IEEE 802.11 are analysed. Simulations and calculation show that the mean time necessary for 100 stations to answer would be around 5 seconds. Although the delay also depends on initial conditions of the MAC protocol (which can positively influence the overall time) this approach leads from the principle to unacceptable termination times for ad-hoc settings due to its method of collecting the information successively. Instead of using such a serial approach we propose a probabilistic transmission method allowing parallel access to the channel. The principle of this method is introduced in section 2. How to use this method for very fast estimation of the number of devices in a wireless cell is outlined in section 3. Simulations are presented and discussed in section 4. Section 5 shows a complete implementation and practical evaluation of the proposed techniques.
2. SDJS : Synchronous distributed jam signalling The Synchronous Distributed Jam Signalling is a transmission scheme that differs significantly from typical radio communication. Instead of communicating encoded (digital) data it transfers information by sending jam signals on the physical layer in a given order. The SDJS method allows to estimate parameters based on sensing the received signals and allows parallel (overlaid) sending of information thus largely reducing transmission time compared to other approaches. SDJS is in the first instance designed for single-hop networks and is not intended for transmission of data nor is it a wireless protocol. SDJS uses signalling on the physical layer to estimate conditions and parameters in wireless ad hoc networks. SDJS is especially targeted to highly mobile settings with constantly varying conditions and network parameters. The principle of SDJS works as follows: Sources of information - e.g. all devices within a network cell - emit jam signals synchronously. Signals are intended to superimpose on the channel. The transmission does not include source coding nor channel coding nor any error correction. Receivers detect the jam signals and estimate values based on statistical methods. SDJS can be integrated as a feature into nearly every existing wireless platform or protocol as it only requires few things from the platform it is implemented on:
Proceedings of the 12th IEEE International Conference on Network Protocols (ICNP’04) 1092-1648/04 $ 20.00 IEEE
1. the ability to send a jam signals (e.g. turn on the carrier and transmit noise) 2. the ability to sense jam signals from other transceivers (e.g. using the carrier sense mechanism) 3. a precise time synchronization among all participating devices 4. methods for reliable broadcasting of messages 5. methods for channel reservation (e.g. RTS/CTS) SDJS always starts with a broadcasted start signal (a normal broadcasted data packet) that all participants receive. This start signal defines the beginning of the short SDJS transmission scheme and refreshes the time synchronization between the devices. After this start signal, a known number of slots follows. In each of theses slots, each station decides to either send a jam signal or try to detect possible jam signals from other stations. Jam signals from different devices can superimpose on the channel. This transmission scheme could be interpreted as an ON/OFF keying with reception during off-times. The minimum length of the slots is given through the radio and protocol parameter of the underlying platform. The devices must be able to either switch from reception to transmission and transmit a jam signal or switch from transmission to reception and detect a jam signal from a remote transmitter within one slot. Besides, the channel delay can affect the timing scheme, as it shifts the synchronization of the devices if the synchronization is realized just through the reception of the start signal. Taking the physical layer parameters from IEEE 802.11a [6], the theoretical minimal slot time is: slottime =
max(trx/tx , ttx/rx ) + 2 · tchanneldelay +tcarriersense = max(2µs, 12µs) + 2 · 1µs + 4µs = 18µs (1)
This means that an 802.11a specified transceiver can perform the necessary action in a slot time of 18µs equal to 55kBit bandwidth. This theoretical minimum of the slot time must eventually (depending on the transceiver platform) be lengthened to deal with additional synchronization weaknesses and clock drifts. After the reception of the start signal, each station has to prepare a transmission vector carrying the information whether to send or to receive in each of the following SDJS slots. The transmission vector is a sequence of bits representing transmission of jam signal (one) or reception (zero) for the according slots. Then, during the SDJS scheme, each device generates a second vector, the reception vector which contains a one at positions, where jam signals have been detected and a zero where the channel was quiet. At positions where the station itself transmitted a jam signal, the reception vector contains a one as well (the station virtually receives its own transmission).
Summarized, SDJS uses signalling on the physical layer where each participating station uses two vectors: the transmission vector to define when to send and when to listen and the reception vector as the basis for a statistical estimation. More details of the SDJS process and timings are explained in an example in the following section.
2.1. General activity flow in SDJS The SDJS scheme can generally be evoked at any time. It begins with a broadcasted message and ends after the reservation time for the SDJS scheme. The SDJS scheme can be used for many different statistical applications in wireless networks. For this reason, the starting packet needs to contain details on the appended SDJS scheme. SDJS schemes can vary in the length of the transmission/reception vector, the slot timing, the placing of jam signals and the estimators working on the reception vectors. These essential key data of the SDJS schemes must be communicated to define a working scheme among participants. Figure 1 shows the activity flow of a SDJS scheme. To illustrate SDJS, we depict the example of a 7 slots long SDJS scheme (transmission and reception vector are 7 bits long) with two positions randomly set. The devices (A,B and C) are participating in a network cell and are SDJS enabled. They perform normal data exchange at times before t1 which is marked with packets named “data”. At t1 , station B sends out a broadcast packet with the information to start the SDJS scheme. It contains information on the SDJS scheme and reserves the channel until t6 . After the successful emission of this start signal (t2 ), all stations prepare a SDJS transmission vector (interpreted from left to right). Device A has 1001000, device B 1000010 and C has 0010100. These transmission vectors can be found in figure 1 as black and grey cells during the SDJS scheme. The SDJS slot length is t4 −t3 . The SDJS reception vector is represented as zeros and ones in the SDJS black and grey cells. After the preparation of the SDJS transmission vector, each device follows the SDJS scheme. The first steps are now explained in details: t2 : The SDJS scheme begins, the channel is reserved until t6 and all participating stations prepare their transmission vector. t3 : The first SDJS slot starts. Device A and B turn to Tx and transmit a jam signal, because they have one in their transmission vector on the first bit. Device C has zero as the first bit in the transmission vector and therefore turns its transceiver to reception and looks for a jam signal. The jam signal can be detected (both A and B signals superimpose on the channel) and Device C places a one in the first position of their reception vector. Devices A and B place as well a one in the first po-
Proceedings of the 12th IEEE International Conference on Network Protocols (ICNP’04) 1092-1648/04 $ 20.00 IEEE
2. Bad detection probability: A present jam signal is not detected because the emitting device is far away or the signal is attenuated due to multi path fading, objects in the line of sight etc.
Figure 1. SDJS scheme
t4 :
t5 :
t6 : t7 :
sition of the reception vector, because they transmitted (and therefore virtually received their own signals). All stations have a zero in their second position of the transmission vector. They all turn to Rx and try to find a jam signal. As there is no device transmitting, nothing can be detected on the channel and all three devices place zero in the second position of their reception vector. Now device C has one on third position of its transmission vector, therefore emits a jam signal. The other both turn to receive, find the jam signal from station C and place a one in the according positions of their reception vector. The SDJS schemes continues like explained until t6 . Then the reception vectors are used for further calculations. The SDJS scheme ends and the access and traffic on the channel is switched back to normal operation. The next normal data packet is exchanged.
The SDJS scheme is based on two mechanisms: using jam signals for transmission during a slot time and using a carrier sense mechanism to detect jam signals. Therefore, the timing of a slot has to be selected (see section 2) to guarantee that signals can be found including the consideration of channel delays etc. This simple mechanism of jam signalling can cause two major problems which are typical low level network issues: 1. The false alarms: A receiving device can detect a jam signal even though there is none due to noise on the channel.
These two major problems are not explicitly addressed in this paper. Nevertheless, mechanisms are used to keep those issues small in the current implementation: Both problems can be reduced by increasing the number of samples to detect a jam signal. The implementation presented in section 5 uses 192 samples per slot plus some detection algorithms and heuristics to keep the influence of both effects small to the results. Other parameters like automatic gain control and thresholds for detection where selected to be optimal for the setting. The mathematical model in section 3 could be extended for modelling the channel errors by simply multiplying them as probabilities wherever a signal reception is modelled. The following sections 3, 4 and 5 focus on the use of SDJS to estimate the number of devices in a mobile setting. This target is only one example of a possible application taking advantage of the signalling of SDJS.
3. Estimation of number of devices The introducing example from the Relate project motivated the requirement to estimate the number of devices in an ad hoc setting of mobile objects equipped with wireless radio. The technical mechanism used was presented in section 2. Now a mathematical model is presented to form the basis for a fast and accurate estimation of the number of devices. The flexibility of SDJS gives manifold possibilities to perform this estimation. One possibility (motivated from the target application) is using the SDJS scheme only a single time and then using the one reception vector as input to an estimator in each device independently. The decision to use SDJS in this way was based on the motivation to produce an especially fast estimation without the need of additional data exchange. For the following section, we focus only on this one model and way to take advantage of SDJS.
3.1. The analytic model In this model, each device sends out only one jam signal per scheme. The position of this jam signal is chosen randomly with an even distribution. The reception vector then carries at least one one (depending on the number of other devices around). The basis for the estimation is the number of ones (sum of digits) in the reception vector. If e.g. ten devices are present and they all chose different positions for one jam signal, all devices would find ten ones in their reception vector. But if e.g. two devices chose the same
Proceedings of the 12th IEEE International Conference on Network Protocols (ICNP’04) 1092-1648/04 $ 20.00 IEEE
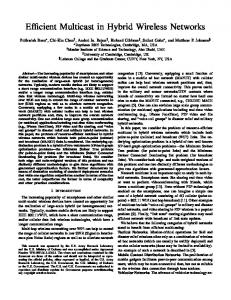
k: the actual number of devices present ˜ the estimated number of devices k: Ak : probability variable for the number of jam signals received (number of ones in the reception vector), depends on the actual number k a: the number of received jam signals in one experiment (sum of digits of a reception vector) s: the number of slots in the SDJS scheme (equal to the number of bits in a transmission/reception vector) The first mathematical question that occurs is to model the probability to see a jam signals when k devices are actually there. This problem can be modelled through basic combinatorics: k elements are to be placed into s slots. For this model, only the combinations that occupy exactly a slots are of interest. 1. the number of all combinations of k elements to be placed in s slots is sk � � 2. the number of combinations to chose a slots is as 3. taking k elements, the number of combinations to form groups of the size a is the surjective mapping from k to a: � � a � i a (a − i)k (−1) i i=0 4. now, the probability to find a combination of the size a is: �s� �a � � i a k i=0 (−1) i (a − i) a (2) P (Ak = a|k) = sk The resulting probability needs some interpretation. First of all, it’s impossible to receive more ones than devices are actually there (a ≤ k); only if errors occur which are not modelled here. Then the number of found ones is as well limited to the number of slots (a ≤ s). Figure 2 shows the probability distribution of the received number of jam signals a depending on the actual present number of devices k. This example is based on a vector length of 64 which is equal to the one used in the implementation in section 5. It is obvious that e.g. for k = 40 the number of received ones (a) has its highest probability below 40 that is to say at a = 30. This is due to the collisions. With 40 devices sending a jam
0.6
0.5
k=10
0.4 P(ak)
slot, only nine slots would be positive. The possible superposition of jam signals on the channel requires an estimation based on a model for those collisions. If the number of devices exceeds the number of slots significantly it is very likely that all positions in the reception vector are positive and the estimation is useless. The model presented here is targeted on moderate number of devices (around 250 maximum) and focusing on a very fast estimation. Other models can be targeted to other typical characteristics. Some descriptors are defined for the modelling:
k=20
0.3
k=40
0.2
k=120 k=60
k=80
k=100
0.1
0 0
10
20
30 a
40
50
64
Figure 2. Probability distribution signal on a random position, it is very likely that some collisions will always occur and it is less likely that no collisions will occur. The probability for no collisions with 40 devices can hardly be found at k = 40, a = 40. The next step is to model an estimator to find the actual number of devices only from the reception vector.
3.2. The estimator As already mentioned, the estimation will be based on the number of ones in the reception vector. As the estimator should only use a single reception vector, it is clear from the beginning that the estimation can only output s different results. The reception vector can have 1..s ones but not more. Each of those numbers will result in an estimation of the actual number of devices present. The finished estimator will therefore be a look-up table mapping a to the esti˜ The estimation used here is a mated number of devices k. maximum likelihood estimation. For a given a from the reception vector of length s, the likelihood estimator must resolve the following statement: � � �s� �a i a k ∂ i=0 (−1) i (a − i) a =0 (3) · ∂k sk Doing so, for each possible number a with 0 < a ≤ s − 1 ˜ The highest value (a = s) there is an estimation result k. cannot give a valid estimation result because the higher the actual number of devices k is, the more probable it becomes to actually receive all a = s bits in the reception vector. The table 1 shows some results from the estimator. Each possible received number of jam signals a is mapped to the according k˜ with the highest probability to produce a bits in the
Proceedings of the 12th IEEE International Conference on Network Protocols (ICNP’04) 1092-1648/04 $ 20.00 IEEE
reception vector (maximum likelihood estimation). Receiving e.g. a = 40 ones in the reception vector would result in the estimation that 62 devices are around. If an estimation is
a 1 5 10 15 20 25 30 35 40 45 46 50 55 60 61 62 63 64
k˜ 1 5 10 17 24 31 39 49 62 79 84 98 127 173 190 219 275 n/a
P (Ak = a|k) 1,000 0,855 0,481 0,328 0,245 0,231 0,209 0,173 0,175 0,175 0,176 0,177 0,182 0,257 0,274 0,324 0,409 n/a
Table 1. Some values of the Estimator for s = 64
implemented based on this table some constrains have to be considered. As the estimation is not a linear function of the found jam signals (k˜ �= c · a), the variance of the estimation increases with the number of devices. The proposed estimation is based on only a single SDJS scheme. Looking into table 1 it is clear that only certain results k˜ are possible. It is e.g. impossible to estimate the number k = 80 precisely with only one SDJS scheme. The value k˜ = 80 does not exist in the estimation table (would be around a = 45, 7) and can therefore never be a result of the estimation. For precise measurements different statistical uses of SDJS should be considered.
3.3. Alternative models There are many other models possible based on the SDJS scheme for estimations of parameters - not only the one presented above. We have discussed other approaches that focus e.g. more on the precision of estimations and less on the speed. One works with only 6 SDJS slots, but needs typically more than 100 consecutive SDJS schemes. It is based on an estimation of the probability of the presence of jam signals on those 6 slots. We found a way to include that
short period of 6 slots into the physical frame of AwareCon [7] as an inherent part of the protocol and needed only 1% of the bandwidth for it. Another possibility is to use more than 64 slots in the proposed method to improve the precision of the estimation for higher numbers of devices. Taking the 64µs slot-time from the implementation, even 512 slots would only need 33ms which can still be considered as real time for human actions.
4. Simulations The Simulation were based on a 256-slots SDJS scheme. The estimation table was calculated prior to the actual simulations. Then, different settings for k = {50, 100, 200, 400} were simulated. The detection errors were modelled with the symmetric error SER (slot error rate). SER gives the probability that a jam signal is not detected although it is there or that a jam signal is being detected although the channel was quiet. The SER was set to values up to 10−2 which is worse than normal simulations for wireless channels which assume BER (bit error rate) of better than 10−3 . Additionally, the BER is hard to compare to the SER as the detection of a slot is a different mechanism than receiving data and therefore needs different modelling. A total of over 20000 estimation form the basis of the figure 3. The xaxis shows the errors (the unit is devices) of the estimations during the simulations. Positive or negative errors are regarded equally. The y-axis shows the accumulated percentage of the occurrences. This means that e.g. on the curve for k = 100, 95% of the simulations returned with an estimation error equal or less than eight. Only for k = 400, a curve with an error (SER = 0.01) was included. It can bee seen, that the influence of bad detection is fairly small. Curves for lower number of devices (k = {50, 100, 200}) did not change when the SER was tuned from 0 to 10−2 . For higher number of devices, the quality of the estimation generally decreases. This is due to basically two reasons: 1. the estimation itself becomes worse, because for higher numbers of a, the estimation k˜ is not as precise as for smaller number. Table 1 shows the non-linear relation between a and k˜ 2. a single error (false alarm, bad detection) results in a higher absolute error again due to the estimation model.
5. Implementation and experiment The proposed SDJS physical layer function and the statistical estimator have been implemented on the Smart-Its particle computer [2], [8]. The particle computer is a system
Proceedings of the 12th IEEE International Conference on Network Protocols (ICNP’04) 1092-1648/04 $ 20.00 IEEE
accumulated percentage of occurrence
1 0.9 0.8 0.7 0.6 k=050, SER=0 k=100, SER=0 k=200, SER=0 k=400, SER=0 k=400, SER=0.01
0.5 0.4 0.3 0.2 0.1 0 0
5
10
20
30
40
50
60
70
Error of estimation [devices]
Figure 3. Simulation for s=256
of wirelessly connected small sensor nodes used for development of applications in the area of ubiquitous and pervasive computing. The particle computers have a customized wireless protocol called AwareCon [7], which guarantees time synchronization, reliable communication, access control and fulfils the SDJS requirements mentioned in section 2. Nevertheless, broadcasting messages in a reliable way is still not solved completely and a lot of research effort is invested to find solutions there for mobile networks. See section 6 for background information. To shield the effect of incomplete broadcasting in the setting, the broadcast mechanisms were supervised manually. The time for one SDJS-slot was 63µs. The AwareCon protocol uses a physical frame of the length of 13ms. Normally, one physical frame transports one packet of data. For SDJS, the starting signal plus 64 SDJS-slots could be placed in that frame which resulted in a performance time of one SDJS scheme of as well 13ms. The time actually needed for the access control, start signal, SDJS slots and estimation is only a 5ms portion of that 13ms frame time. The experiments were carried out in an office environment. The setting included different group sizes from 5 to 50 devices and different spatial arrangements with near and far devices and groups of devices within one room. More estimations were taken for higher numbers than for smaller ones. An overall number of 1820 estimation were gathered during the various settings. Figure 4 gives an example of a very dense setting on a desk in an office. In other settings the devices were more distributed in the room, attached to persons, windows, chairs and all kinds of objects in the office environment. Figure 5 shows the overall results of all the experiments carried out in our office. The z-axis shows the relative occurrence of the pairs actual number of devices - estimated
Figure 4. An experiment with over 40 particle computers
Figure 5. Experiment on estimation
number of devices. Starting from an actual number of devices, one can read out how often which number of devices was estimated. This figure gives a good impression of how good the actual estimation worked. The estimation follows the bisection line of the x-y axis. For higher number of devices, the variance obviously increases. This is due to the same reasons given for the simulations. The errors of the estimation during the experiment are summarized in figure 6. They show that for e.g. k = 20, 95% of the errors are equal or less then 3 objects. 20 Objects is a typical number for applications and setting that we built in the recent years. Therefore the good estimation
Proceedings of the 12th IEEE International Conference on Network Protocols (ICNP’04) 1092-1648/04 $ 20.00 IEEE
accumulated percentage of occurrence
1 0.9 0.8
k=10 k=20 k=30 k=50 k=30, simulation
0.7 0.6 0.5 0.4 0.3 0.2 0.1 0 0
2 3
5
10
15
20
25
Error of estimation [devices]
Figure 6. Accumulated error distribution of the experiments
result is promising and very useful. For k = 30 a curve from simulations (SER = 0.01) was added to the graph to prove the implementation and compare the actual quality of the estimation in a real-world setting to the “academic” results from simulations. The k = 30 curve from the implementation is nearly identical to the one from simulations. It only differs by one device. This is a convincing proof that the idea of SDJS really contributes useful results in the real world.
6. Related work The closest related work published on the issue to estimate the number of nodes can be found in [9]. The authors present a statistical approach to estimate the number of nodes in a sensor network based on collected data packets that carry source IDs. They provide an efficient estimator and prove their concept in simulations. However, the scheme presented there is targeted more towards large scale sensor networks whereas our work is focused on highly mobile settings and the speed (real time) of the estimation. In [10], a scheme is presented that uses signals that superimpose on the radio channel as well. The goal there is to improve the detection probability of signals with “boosting” them on the channel using overlaid jam signals. It works as well in a distributed way. A mentioned precondition for SDJS is the ability to broadcast messages in a reliable way. Different research efforts have addressed this network issue. Recently, the problems of using standard and known broadcast mechanism (like from IP) in mobile and ad hoc setting has been discovered as non-trivial. A survey of broadcast methods for
mobile networks and their typical behaviour can be found in [11]. In [12], an efficient scheme is presented that is based on the 802.11 standard but uses RTS, CTS, ACK and a new RAK packet in an optimised way to avoid unnecessary contention periods during the distributed operation in the networks. The work in [13] presents a statistical approach to the delivery of multi/broadcast messages. The protocol proposed guarantees the distribution of a message to a given area only to a certain probability. In [14], the broadcast is organized in an efficient way using piggybacked acknowledges. All that work struggles with the typical behaviour of nodes in mobile setting like fast changing and non-predictable routes for delivery and limited resources. Like the comparison in [11] shows, the “silver bullet” for reliable multi/broadcast for mobile settings has not been found yet. The deterministic approaches often have insufficient scalability and the probabilistic approaches lack in reliability. For our experimental setting, the broadcasting was based on a probabilistic scheme. Another important precondition for the use of SDJS is a precise time synchronization to guarantee the synchronous use of the slots during the SDJS scheme. Synchronization is in general as well a complex task in wireless ad-hoc networks. In [15] a tree-based method is proposed that is centralized and assumes that for most applications, the requirements for accuracy are relatively low (which is not the case for SDJS: high synchronization precision is necessary). The section Related Work in [15] gives as well a good summary of the state-of-the-art methods for synchronization in wired and wireless networks. In [16], different approaches to synchronization like diffusion, building of clusters and node based algorithms are presented and their simulation is discussed. In our real world implementation for the experiments carried out, we used the synchronization services of the AwareCon protocol on the particle computer platform. This synchronization guarantees an accuracy of better than 4µs between all active nodes in a network cell and better than 1µs after a resynchronization through a broadcast packet at the beginning of a SDJS scheme.
7. Conclusion and ongoing work In this paper we presented SDJS, a novel approach towards the estimation of parameters in mobile, wireless ad hoc networks. SDJS is a modulation scheme with superimposing and synchronous jam signals combined with a statistical evaluation. One statistical model to estimate the parameter number of present devices was proposed, formulated, simulated and proved in a real-world implementation. It estimated the number of devices in the implementation within 5ms with an error of ≤ 3 devices for 95% of the experiments with 20 devices running. The simulation re-
Proceedings of the 12th IEEE International Conference on Network Protocols (ICNP’04) 1092-1648/04 $ 20.00 IEEE
turned the same accuracy for estimating 50 devices but using a 4 times longer scheme. This shows that in general any required accuracy can be achieved by adapting the SDJS slot number. Compared to conventional processes like collection of IDs of surrounding partner devices it can accelerate the estimation by at least factor 1000 for settings greater than 100 devices. The proposed scheme has a trade-off between speed and accuracy. Better estimations need longer SDJS vectors. Improvements or alternative statistical usages of SDJS have been pictured in section 3.3. The mentioned problems of false alarm and bad detection probabilities are the most important issues to focus on in this work. The detection of jam signals must be stable and robust, correlation techniques are being discussed. The incorporation of the RSSI of the received jam signals can be helpful for weighting of signals in the statistical detection models. Further, the issue of reliable (acknowledged) broadcast in mobile settings is subject to ongoing research effort. An extension of SDJS to multi-hop settings is as well under research. SDJS can be used for settings where a many-to-one communication of redundant information needs to be processed efficiently. The parallel and overlaid transmission can be interpreted as a logic or-operation of bits on the RF channel. All data collection that uses bit wise or-combination of vectors can be realized efficiently with SDJS. A further improvement can be achieved by recombining the estimations that have been produced locally and therefore increase the statistical confidence significantly.
8. Acknowledgements This work is one of the first results of the research issues focussed and funded in the project Smart Surroundings [17].
[6]
[7]
[8] [9]
[10]
[11]
[12]
[13]
[14]
References [15] [1] S. Ramanathan and Martha Steenstrup. A survey of routing techniques for mobile communications networks. In Mobile Networks and Applications, Special issue: routing in mobile communications networks, 1996. [2] Michael Beigl, Tobias Zimmer, Albert Krohn, Christian Decker, and Philip Robinson. Smart-its – communication and sensing technology for ubicomp environments. ISSN 1432-7864 2003/2, University of Karlsruhe, 2003. [3] Anke Theke, Albrecht Schmidt, and Christian Merz. Integration of goods delivery supervision into e-commerce supply chain. In Proceedings of the second international workshop WELCOM, Heidelberg, Germany, 2001. [4] http://www.comp.lancs.ac.uk/∼hwg/relate.html, accessed: 04/2004. [5] Marcelo Carvalho and J.J. Garcia-Luna-Aceves. Delay analysis of ieee 802.11 in single-hop networks. In 11th IEEE
[16]
[17]
International Conference on Network Protocols (ICNP’03), page 146, Atlanta, USA, November 2003. LAN/MAN Standards Committee of the IEEE Computer Society. Supplement to ieee standard for information technology telecommunications and information exchange between systems - local and metropolitan area networks - specific requirements. part 11: wireless lan medium access control (mac) and physical layer (phy) specifications: high-speed physical layer in the 5 ghz band. IEEE Std 802.11a-1999, 1999. Michael Beigl, Albert Krohn, Tobias Zimmer, Christian Decker, and Philip Robinson. AwareCon: Situation Aware Context Communication. In Proceedings of Ubicomp 2003, Seattle, USA, October 2003. http://particle.teco.edu, accessed: 4/2004. C. Budianu and L. Tong. Estimation of the number of operating sensors in a wireless sensor network. In Proc. of Asilomar Conference on Signals, Systems, and Computers, Monterey, CA., November 2003. Timo Weiss, Joerg Hillenbrand, Albert Krohn, and Friedrich K. Jondral. Efficient signaling of spectral resources in spectrum pooling systems. In 10th Symposium on Communications and Vehicular Technology in the Benelux, November 2003. Einar Vollset and Paul Ezhilchelvan. A survey of reliable broadcast protocols for mobile ad-hoc networks. Technical Report CS-TR-792, University of Newcastle upon Tyne, 2003. Min-Te Sun, Lifei Huang, Anish Arora, and Te-Hwang Lai. Reliable mac layer multicast in ieee 802.11 wireless networks. In International Conference on Parallel Processing (ICPP’02), Vancouver, Canada, August 2002. Jun Luo, Patrick Th.Eugster, and Jean-Pierre Hubaux. Route driven gossip: Probabilistic reliable multicast in ad hoc networks. In InfoCom 2003, San Fransisco, USA, April 2003. IEEE. M. Mock, E. Nett, and S. Schemmer. Efficient reliable real-time group communication for wireless local area networks. In Third European Dependable Computing Conference EDCC-3, Prague, Czech Republic, Sep 1999. Springer. Jana van Greunen and Jan Rabaeay. Lightweight time synchronization for sensor networks. In Second ACM International Workshop on Wireless Sensor Networks and Applications in conjunction with ACM MobiCom 2003, San Diego, CA, USA, September 2003. Qun Li and Daniela Rus. Global clock synchronization in sensor networks. In InfoCom 2004, Hong Kong, March 2004. IEEE. http://www.smart-surroundings.org, accessed: 04/2004.
Proceedings of the 12th IEEE International Conference on Network Protocols (ICNP’04) 1092-1648/04 $ 20.00 IEEE