this paper presents an efficient mechanism for the recovery of packets ... strategies to recover the corrupted packet. The key ... at high data rates. In contrast, the ...
Efficient Packet Recovery in Wireless Networks Muhammad Naveed Aman† , Biplab Sikdar† and Wai Kin Chan‡ †Department of ECSE and ‡Department of ISE, Rensselaer Polytechnic Institute, Troy NY 12180 USA Abstract—Wireless medium access control (MAC) protocols usually provide reliability in the presence of packet errors. The efficiency of these reliability mechanisms is generally low since they require the entire packet to be retransmitted even though only parts of it may have been corrupted. To address this issue, this paper presents an efficient mechanism for the recovery of packets corrupted due to both channel errors and collisions. The proposed mechanism first determines the cause of the errors. Next, the symbols with errors are isolated by using the error vector magnitude (EVM) of received symbols as the feature for detection. Using explicit feedback about which blocks of symbols have errors, only the erroneous blocks are then retransmitted. Our results show that the proposed mechanism increases the efficiency of the MAC protocol by providing higher throughput.
I. I NTRODUCTION Wireless transmissions are susceptible to two sources of errors: (i) poor channel conditions due to fading, path loss and noise; (ii) collisions due to concurrent transmissions from other nodes. To provide reliability, most wireless MAC protocols include mechanisms to detect errors, and retransmission strategies to recover the corrupted packet. The key limitation of existing mechanisms is that when a packet is corrupted during transmission, the entire packet is retransmitted. This leads to unnecessary and costly overhead since most channel errors and collisions affect only part of the packet. To address this issue, this paper presents an efficient packet recovery mechanism for wireless networks such as IEEE 802.11 which use orthogonal frequency division multiplexing (OFDM) as the physical layer. The most common method to detect corrupted packets is through error detection codes. Mechanisms such as automatic repeat request (ARQ) are then used to retransmit the corrupted packet [1]. Most ARQ schemes provide reliability by retransmitting the entire corrupted packet. A scheme for marking bits that are likely in error is presented in [2] and it is shown that the throughput may be increased by retransmitting only these bits. However, this approach requires specialized hardware, and has a high overhead feedback strategy. A packet recovery mechanism that works by combining multiple copies of a packet from different access points is proposed in [3]. The overhead and delay associated with combining agents limits the application of this scheme. Moreover, only AWGN channels are considered in [3] and its effectiveness in more practical channels has not been established. In [4], a softwareonly solution to packet recovery based on harnessing partial packets is presented. This scheme relies on incremental redundancy and coding schemes, which can become a bottleneck c 2014 IEEE. 978-1-4799-3083-8/14/$31.00 �
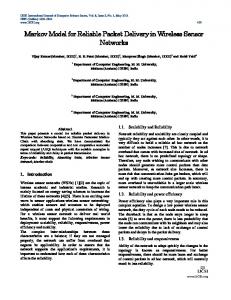
at high data rates. In contrast, the proposed packet recovery mechanism does not require any customized hardware, has lower overhead, and provides real time operation. The main contribution of this paper is a methodology that detects the symbols that were corrupted during transmission. The transmitter can then use precise retransmissions of only the corrupted symbols. The proposed methodology to localize the errors is based on calculating the EVM of the received symbol. Each received packet with errors is first classified as either a packet corrupted due to a collision or due to channel errors. Based on the cause of corruption, two slightly different methodologies are proposed to isolate the symbols with errors. The receiver then conveys the information about the corrupted symbols to the transmitter using the acknowledgment (ACK) packet. The transmitter retransmits only the corrupted symbols, which are then used by the receiver to reconstitute the packet. Extensive simulation results are used to evaluate the performance of the proposed packet recovery mechanism. The rest of the paper is organized as follows. Section II presents the proposed packet recovery mechanism. Sections III and IV present mechanisms for detecting the cause of packet errors and localizing the errors, respectively. Section V analyses the proposed mechanism, Section VI presents simulation results, and Section VII concludes the paper. II. E FFICIENT PACKET R ECOVERY M ECHANISM The proposed packet recovery mechanism is shown in Figure 1. When a packet is corrupted (as determined by the CRC check), we first establish the cause (collision or channel error) using the mechanism described in Section III. If the packet is corrupted by a collision we use a thresholding mechanism to identify the blocks in error, while K-means clustering is used if the packet is corrupted by channel errors, as described in Section IV. Once the blocks in error are identified, a bitmap indicating which blocks are corrupt is sent to the transmitter. On receiving the bitmap, the transmitter has two options for retransmission: (i) it can resend the erroneous blocks as a separate packet; (ii) it can piggyback the erroneous blocks in the next packet. The problem with the latter approach is that the receiver will be unable to differentiate between new blocks and old blocks because the MAC header in the IEEE 802.11 a/b/g has space for only one sequence number. We thus select the first approach since although it increases the overhead, we do not require any changes to the current IEEE 802.11 implementation. However, IEEE 802.11n has a frame format which can accommodate more than one sequence numbers and can support the second approach.
where P0 is the average power of all the symbols for a given modulation, and N is the number of received symbols. Let en be the error vector in the time domain i.e., en = yn − xn . We also know that en = IDFT{Ek } and yn = IDFT{Yk }. Thus, applying Parseval’s theorem, we can rewrite (4) as N −1 � 1 |en |2 . (5) Z= N · P0 n=0 Note that Z is the sum of N i.i.d. random variables. Using the central limit theorem (for large N ), we approximate Z as a Gaussian with probability density function (pdf) (z−μz )2 − 1 2 e 2σZ . (6) fZ (z) = � 2 2πσZ To obtain the pdf fZ (z) of Z in the presence and absence of 2 ) collisions, we need to find its mean (μZ ) and variance (σZ 2 for both cases. We first evaluate μZ and σZ for the case when there is no collision. In this case the error vector is given by en = Hn xn + ηn − xn = xn (Hn − 1) + ηn . Fig. 1.
1 riα ,
Proposed Packet Recovery Mechanism
As in IEEE 802.11, the sender tracks the number of retransmission attempts made for each packet. Packets are dropped if the allowed number of attempts (K) is exceeded. III. D ETECTING THE C AUSE OF PACKET C ORRUPTION
(7)
ri−α
and take as the We assume the path loss law l(r) = mean power of the Rayleigh channel (Hn ). Then, � � � � � 2 π 1 2 μZ = ε{Z} = + 1 − 2 σx2 + σ η . (8) P0 riα 2riα 2 To find σZ , we need to evaluate ε{Z 2 } given as follows:
2 N −1 N −1 N −1 � 1 1 � � Z2 = |en |2 = 2 2 |en |2 |en2 |2 . (9) N P0 n=0 N P0 n =0 n =0 1
This section presents a methodology for detecting the cause of packet errors. This information is necessary for accurately isolating the locations of the symbols with errors. We use EVM 1 2 as the metric to determine the cause of packet corruption. We now assume block fading with a block length of m If Xk denotes the reference or transmitted signal and Yk symbols. Then (9) can be re-written as denotes the received (distorted) signal, then the error vector is � m−1 m−1
m−1 −1 Ek = Yk − Xk . Let the transmitter and receiver be denoted by � � � N� 1 2 4 2 2 |en | + |en1 | |en2 | + Tx and Rx , respectively. Consider an OFDM system with Z = 2 2 N P0 n =m n =0 n =0 n =0 2 1 2 1 T subcarriers and a frequency flat multipath Rayleigh fading
−1 2m−1 2m−1 2m−1 � 2m−1 � � m−1 � � N� channel. The received time domain OFDM signal yn is 4 2 2 2 2 |en | + |en1 | |en2 | + |en1 | |en2 | y n = Hn ∗ x n + η n + ζ n (1) n1 =m n2 =m n1 =mn2 =0 n1 =mn2 =2m ⎞⎤ ⎛ where Hn is the Rayleigh channel coefficient, ηn is additive N −1 N −1 βm−1 N −1 � � � � 2 white Gaussian noise with zero-mean and variance ση , and ζn + · · · + ⎝ |en |4 + |en1 |2 |en2 |2 ⎠⎦ . (12) is the interference due to collision. The reference signal in our n1 =βm n2 =βm n1 =βm n2 =0 model is obtained from the received signal by demodulating the received symbols and then modulating them once again. Taking the expectation of (12), we get � � This re-modulated signal works as an approximation for the 1 N − m � 2 �2 2 4 th ε{Z ε{e } = } + } mε{e (13) n n transmitted signal. xn is the n time domain OFDM signal N P02 m and can be obtained from Xk , the M-QAM modulated symbol where ε{e2n } is given by at the kth subcarrier as [5], � � � T −1 � 2 π 2 2 j2πkn/N } = σ + 1 − 2 (14) ε{e + ση2 xn = IDF T {Xk } = Xk e (2) n x riα 2riα k=0
With frequency flat fading, the convolution operator in (1) may be replaced with a multiplication and (1) may be rewritten as y n = Hn x n + η n + ζ n . (3) Let us introduce a random variable Z defined as Z=
N −1 � 1 |Ek |2 . N · P0 k=0
(4)
and ε{e4n } is given by (10). Combining (8) and (13), we can 2 2 = ε{Z 2 } − (μZ ) . obtain the variance of Z as σZ Now consider the case when a packet is corrupted by collisions. We assume a network with J interferers at distance rj from Rx , that transmit with probability p independent of each other. The starting location of a collision within a packet is assumed to be uniformly distributed between 0 and N − 1.
� �
2π 2π 2 12 2 2 2 − 3α + α − 2 + 1 + 3ση + 6σx ση − +1 ri2α ri riα riα riα ri2 � � �
� 2π 2π 2 8 4 12 4 2 2 2 (3σx ) − 3α + α − 2 + 1 + 3ση + 6σx ση − +1 + ri2α ri riα riα riα ri2 ⎤ ⎡ � � � � � J J � � 2 π 1 1 2 ⎣ 2 4 ⎦ + 6pσ 6 σx2 + 1 − 2 + σ 2pσ η x x α α α ri 2ri r r2α j=0 j j=0 j
ε{e4n }
=
ε{e∗n 4 } =
8
(3σx4 )
4
If a collision starts at symbol n0 , the error vector is given by � en n < n0 e∗n = (15) en + ζJ n ≥ n0 where ζJ is given as follows ζJ =
J �
B i H r i Wi .
(16)
i=0
Here Bi ’s are i.i.d. Bernoulli random variables with parameter p, Hri is Rayleigh distributed with mean power 1/riα , and Wi is the OFDM symbol transmitted by interferer i, which is approximately i.i.d. Gaussian distributed with zero-mean and variance σx2 . We can then rewrite (5) as follows: n −1
N −1 0 � � 1 2 ∗ 2 (17) |en | + (|en | + ζJ ) . Z = N P0 n=0 n=n
and similarly, we have � �� � 1 (N − 1)3 N −1 1 ε{Z ∗ 2} = 2 2 − mε{e4n } + N P0 2 4 m � � �2 2 1 N +2 (N − 1)2 + (N − 1)m ε{e2n } + (N −1) 3 2 3 � � � 1 (N +1) 2 4 mε{e∗n } + N N 2 +5N −3 ε{e2n }ε{e∗n }+ 2 4m � !2 � � 1 1 1� ε{e∗n 2 } − 5N 2 −N +2 + m(N +1)+ (18) 3 2 4m where ε{e2n } and ε{e4n } are given by (14) and (10). respectively. ε{e∗n 2 } is given by � � � J � 2 π 1 2 2 + 2pσ ε{e∗n 2 } = σx2 α +1 − 2 + σ η x α (19) ri 2riα r j=0 j and ε{e∗n 4 } is given by (11). Thus, we can now obtain the 2 2 ∗2 } − (μZ ∗ ) . variance of Z ∗ as σZ ∗ = ε{Z A. Classifying the Cause of Packet Errors To classify the cause of each packet loss, we first calculate the EVM of each received packet and then compare it against a threshold value. If the calculated EVM is greater than the threshold, the packet is classified as a collision, and vice versa.
(11)
The optimum threshold value is determined by choosing the threshold that leads to equal false positive and false negative rates (i.e., the threshold that leads to the crossover error rate). A false positive is defined as an event where the cause of a packet loss is attributed to a collision, when the actual cause was a weak signal (not a collision). If we denote the threshold by γ, then the probability of a false positive is given by � � " γ fZ (z) dz (20) PZ [Z > γ] = Pe 1 − −∞
where Pe is the symbol error rate. Similarly a false negative is defined as an event where the cause of a packet loss is attributed to a weak signal, when the actual cause was a collision. The probability of a false negative is given by � �" γ ∗ ∗ ∗ ∗ PZ [Z ≤ γ] = Pe fZ (z ) dz . (21) −∞
0
Taking the expectation of (17), we get ⎫ ⎡ ⎧ ⎤ � J−1 ⎨2 � 1⎬ 2π 1 p(N +1) 2⎦ ⎣σ 2 ε{Z ∗ } = +1− + α ⎭ + ση P0 x ⎩riα riα N r j j=0
(10)
To obtain the threshold that leads to the crossover error rate, we can find γ by equating (20) and (21). Thus, to get the threshold we need to solve the following equation numerically: " γ " γ fZ (z) dz + fZ ∗ (z ∗ ) dz = 1. (22) −∞
−∞
IV. I DENTIFYING THE L OCATION OF E RRONEOUS B LOCKS The error identification mechanism detects blocks of symbols with errors instead of individual symbols with errors. To identify the symbols with errors, we calculate the EVM over blocks of m symbols (m ≥ 10). This block based approach serves two purposes: (i) justifying the use of (6) and (ii) lowering the overhead of the feedback sent to the transmitter. A. Error Locations in Packets Corrupted by Collisions Once a packet is classified as a collision, the receiver compares the EVM of each block with a threshold. The threshold is determined using the mechanism described in Section III. Note that the threshold for identifying blocks with errors is different from the threshold for identifying the cause of a packet loss. The difference arises because the cause of a packet loss is classified using all the symbols in the packet while blocks with errors are detected based only on the symbols within a block. The blocks with EVM greater than the threshold are tagged as erroneous blocks. The receiver then requests the transmitter to retransmit the blocks in error as shown in Figure 1. B. Error Locations in Packets Corrupted by Channel Noise To detect the locations of the errors in case of corruption due to channel noise, we perform clustering on the EVM
values of the blocks in the packet. Clustering is used instead of thresholding because the difference in the variances of the pdfs of the EVM of blocks affected by channel noise, and the blocks that are unaffected, is small. Ideally, blocks with errors should form one cluster while blocks without error form another cluster. We use K-means clustering [6] to identify the blocks in error. The process starts with two points randomly chosen as cluster centers. The EVM values of the blocks in the corrupted packet are then assigned to their closest cluster center based on the Euclidean distance. The centroid of the two resulting clusters is then calculated and used as the new cluster centers. The EVM value assignment process is then repeated, and this process continues until the cluster centers stabilize. V. E FFICIENCY OF THE R ECOVERY M ECHANISM This section evaluates the efficiency of the proposed packet recovery mechanism. We develop models for the throughput for two cases: with and without the proposed mechanism. Consider a packet with with N OFDM symbols and blocks with m symbols per block. Let K denote the maximum number of allowed retransmissions. If we denote the probability S , then we have of a symbol being corrupted by Pout S m P [block has an error] = PoutB = 1 − (1 − Pout ) S N P [packet has an error] = PoutP = 1 − (1 − Pout ) .
(23) (24)
The packet transmission overhead consists of two parts: the fixed overhead consisting of the preamble and the PLCP header, and the MAC header (which depends on the data rate). A. Throughput Without Proposed Recovery Mechanism Let X be the random variable that a packet transmission needs x attempts. Then P [X = x] = (PoutP )x−1 (1 − PoutP )
x = 1, 2, · · · . (25)
The probability of outage, i.e. the probability that the packet needs more than K transmission attempts, is given by P [X > K] =
∞ �
P [X = x] = (PoutP )K .
(26)
x=K+1
Retransmission Flow Diagram
for x = 1, 2, · · · , K. If we have n successful transmissions, the total time consumed by the transmission attempts is � � (29) T |n = X1|K + X2|K + · · · + Xn|K Ts and its expected value is ε{T |n} =
1−(PoutP )K −K(PoutP )K (1−PoutP ) nTs (30) (1−(PoutP )K )(1−PoutP )
where Ts is the time to transmit a packet (including the data and overhead). Taking the expectation of (30), we get ε{T } =
1 − (PoutP )K − K(PoutP )K (1 − PoutP ) Ts . (31) (1 − PoutP ) (1 − (PoutP )K ) (PoutP )K
Since the number of successful transmissions is geometrically distributed, its expected value is given by ε{n} =
1 (PoutP )K
.
(32)
Consider the period of unsuccessful transmissions. The number of continuous outages, n� is geometrically distributed with parameter PoutP . Then, ε{n� } =
1 . 1 − (PoutP )K
(33)
Given n� unsuccessful transmissions, the expected time T � is
Consider a long period of operation of the network. Such a period can be considered to consist of a sequence of successful packet deliveries (with or without retransmissions) followed by a sequence of one or more outages (where a packet is dropped after K retransmission attempts). This alternating sequence of successful deliveries and outages forms a renewal process and we calculate the throughput by evaluating the average duration of a renewal period. The number of successful transmissions κ in a period is geometrically distributed as � �n−1 (27) P [κ = n] = (PoutP )K 1 − (PoutP )K for n = 1, 2, · · · . If the it h packet is successful, the number of attempts it takes, Xi|S , is given by P [Xi = x|x ≤ K] =
Fig. 2.
x−1
(1 − PoutP ) (PoutP ) 1 − (PoutP )K
(28)
ε{T � |n� } = KTs n�
(34)
Unconditioning on n� , we have ε{T � }
=
KTs . 1 − (PoutP )K
(35)
Using (31), (32) and (35) the throughput without the use of the proposed packet recovery mechanism is given by T hroughput =
ε{n}Sp ε{T } + ε{T � }
(36)
where Sp is the number of bits in a packet. B. Throughput with Proposed Recovery Mechanism Let L denote the number of blocks per packet (L = m n ). With the proposed recovery mechanism, an outage is an event
Comparison of Throughputs
7
5
x 10
Comparison of Throughputs
7
6
x 10
4.5 4
5
With PPR No PPR
With PPR No PPR
4
3
Throughput
Throughput
3.5
2.5 2
3
2
1.5 1
1 0.5 0 −5 10
−4
10
−3
10 Symbol Error rate
−2
10
0 −5 10
−1
10
−4
10
−3
10 Symbol Error rate
−2
10
−1
10
Fig. 3. Comparison of efficiency with and without the proposed packet recovery (PPR) mechanism at 48 Mbps.
Fig. 4. Comparison of efficiency with and without the proposed packet recovery (PPR) mechanism at 54 Mbps.
where after K tries at least one block is still undelivered. The probability that i of L blocks in a packet are corrupted is � � L L−i B(L, i) = (PoutB )i (1 − PoutB ) (37) i
and its expected value is given by
for i = 0, 1, · · · , L. The transmission of any packet can be considered to proceed in a sequence of stages, as shown in Figure 2. The first stage always involves the transmission of L blocks. If i of these L blocks are corrupted, then the second stage consists of the transmission of i blocks. The number of blocks transmitted in stage 1 can then be expressed as follows � 1 i=L P [Y1 = i] = . (38) 0 otherwise
We can now obtain the total time required to transmit a packet. If we denote the maximum limit of retries by K, the expected number of blocks transmitted per round is given by
Similarly the number of ⎧ ⎪ ⎪ ⎪ ⎪ ⎪ ⎨ P [Y2 = i] = ⎪ ⎪ ⎪ ⎪ ⎪ ⎩
blocks transmitted in stage 2 is B(L, L) B(L, L − 1) B(L, L − 2) .. .
i=L i=L−1 i=L−2 .
B(0, 0)
i=0
L �
iPoutB P [Y2 = i] = L(PoutB )2 .
i=0
K �
K �
1 − (PoutB )K . 1 − PoutB i=1 i=1 (45) A packet is dropped if after K retransmission rounds there is still at least one block missing. If we denote the time to transmit the overhead incurred by each packet by C and the data rate by R, the throughput is given by
ε{Y } =
ε{Yi } =
L(PoutB )i−1 = L
L × bits/block × P [YK = 0] 1−(PoutB )K 1−PoutB
.
(46)
(39)
( L×bits/block + C) R
(40)
Figures 3 and 4 show the theoretical throughput with and without the proposed packet recovery mechanism at 48Mbps and 54Mbps, respectively. We observe that as the symbol error rate increases, the throughput of our proposed scheme is much higher than the throughput of the case without our scheme.
Proceeding along the same lines and using Figure 2, the number of blocks transmitted in stage 3 is given by � $L i=j B(i, j)P [Y2 = i] j = 0, 1, · · · , L . P [Y3 = j] = 0 otherwise (41) The expected value of (41) is given by ε{Y3 } =
iPoutB P [Yn−1 = i] = L(PoutB )n−1 . (44)
T hroughput =
Taking the expectation of (39), we get ε{Y2 } = LPoutB .
ε{Yn } =
L �
(42)
i=0
The general form for the number of blocks transmitted in any stage n, for n > 1 is given by � $L i=j B(i, j)P [Yn−1 = i] j = 0, · · · , L (43) P [Yn = j] = 0 otherwise
VI. R ESULTS In this section we present the simulation results to evaluate the performance of our proposed methodology. The simulations were done using a mix of MATLAB/Simulink and NS2. The transmitter and receiver models were designed according to the IEEE 802.11a specifications [7]. The network simulation was done using NS2, which in turn used the output of the channel model created using MATLAB/Simulink. The wireless nodes in the simulation are connected through a frequency flat multipath Rayleigh fading channel. The channel is realized through the Jake’s model [8]. Results were generated for BPSK, QPSK, 16QAM and 64QAM. Due to space limitations, we only show the results for 64QAM, for which two data rates were considered: 48Mbps and 54Mbps. For both cases, there
100 80
30
90
25
%
[3] [3] Proposed Proposed
70
%
80
60
48Mbps 54Mbps 48Mbps 54Mbps
40
%
[3] [3] Proposed Proposed
15
20
48Mbps 54Mbps 48Mbps 54Mbps
60
[3] [3] Proposed Proposed
40
0
0
5
50
20
10
48Mbps 54Mbps 48Mbps 54Mbps
5
10
15
20
25
30
Distance of Interferer from Reciever (m)
(a) False positive rates Fig. 5.
5
10
15
20
25
Distance of Interferer from Reciever (m)
(b) False negative rates
30
5
10
15
20
25
30
Distance of Interferer from Reciever (m)
(c) Balanced classification rates
Comparison of False positive, false negative, and balanced classification rates of the proposed mechanism and the scheme in [2].
were 6 coded bits per subcarrier and 288 coded bits per OFDM symbol. For the 48Mbps case the coding rate was 2/3 and data bits per OFDM symbol was 192. The corresponding numbers for the 54Mbps case was 3/4 and 216. A. Performance of Error Location Detection We first evaluate the mechanism to identify the blocks in error. We also compare our proposed method with the most accurate error identification scheme in existing literature [2]. The scheme in [2] uses the error vector of each symbol to identify the symbols that are in error. The mechanism proposed in [2] empirically finds the threshold for the error vector. The performance of the proposed localizing mechanism is evaluated using three metrics: false positive rate (the fraction of error free blocks classified as erroneous), false negative rate (the fraction of erroneous blocks classified as error free) and the Balanced Classification Rate (the average of the number of correct classifications in each class). Figure 5 compares the false positive, false negative, and balanced classification rates of the proposed error localization mechanism and the method from [2], as a function of the distance between the interferer and the receiver. The proposed scheme outperforms the mechanism in [2] in terms of the false negative and balanced classification rates, and their false positive rates are similar. Note that the accuracy of the mechanism in [2] depends on the training data that is used to set its thresholds. In the simulation results reported here, the training and evaluation scenarios were quite similar, and the good performance is not surprising. In contrast, our mechanism does not depend on any training data and is thus expected to be more robust in a variety of environments. In addition, the mechanism in [2] checks every symbol for an error so encoding the feedback is a significant overhead. B. Throughput Performance Table I shows the percentage improvement in the throughput achieved with and without the proposed packet recovery mechanism for various network sizes. For these simulations, saturated traffic conditions were assumed at each node. All nodes exchanged data with a single base station and the nodes were located on a circle of radius 50 meters around the
TABLE I P ERCENTAGE IMPROVEMENT IN THE THROUGHPUT ACHIEVED WITH THE PROPOSED PACKET RECOVERY MECHANISM OVER IEEE 802.11
Data Number of Nodes Rate 2 4 6 8 10 12 14 16 18 20 48 14.0 13.0 12.7 12.6 12.5 12.4 12.4 12.3 12.3 12.3 Mbps 54 13.9 13.0 12.7 12.5 12.5 12.4 12.4 12.3 12.3 12.3 Mbps base station, at regular angular intervals. We observe that the proposed mechanism provides more than 10% improvements in the throughput at all loads. This improvement increases as the distance between the source and the destination nodes increases or the channel becomes poorer. VII. C ONCLUSIONS This paper presented a mechanism for the fast and efficient recovery of corrupted packets. The proposed mechanism first divides a packet into blocks and uses the EVM values of the blocks to isolate the errors. The transmitter then retransmits only that portion of a packet which is corrupted. Using both analysis and simulations, it was shown that the throughput of the proposed packet recovery scheme is much higher than that achieved with the conventional IEEE 802.11 protocol. R EFERENCES [1] D. Bertsekas and R. Gallager, Data Networks, Englewood Cliffs, NJ: Prentice-Hall, 1987. [2] K. Jamieson and H. Balakrishnan, “PPR: partial packet recovery for wireless networks,” Proceedings of ACM SIGCOMM, pp. 409-420, Kyoto, Japan, August 2007. [3] G. Woo, P. Kheradpour, D. Shen and D. Katabi, “Beyond the bits: cooperative packet recovery using physical layer information,”Proceedings of ACM MOBICOM, pp. 147-158, Montreal, Canada, September 2007. [4] K. Lin, N. Kushman and D. Katabi, “ZipTx: harnessing partial packets in 802.11 networks,” Proceedings of ACM MOBICOM, pp. 351-362, New York, NY, September 2008. [5] Y. Choo, J. Kim, W. Yang and C. Kang, MIMO-OFDM Wireless Communications with MATLAB, Wiley-IEEE press, Singapore, 2010. [6] I. Witten and E. Frank, Data Mining: Practical Machine Learning Tools and Techniques, Morgan Kaufman, San Francisco, CA, 2005. [7] High-Speed Physical Layer in the 5 GHz Band, IEEE Standard 802.11a1999, 1999. [8] W. Jakes, Microwave Mobile Communications, New York: Wiley, 1974.