5. STATISTICAL ANALYSIS. Chaired by Drake R. Bradley, Bates College. SDT_SP, a program in Pascal for computing parameters and significance tests from.
Behavior Research Methods, Instruments, & Computers 1994, 26 (2), 15H55
5. STATISTICAL ANALYSIS Chaired by Drake R. Bradley, Bates College
SDT _SP, a program in Pascal for computing parameters and significance tests from several detection theory designs JOSE M. REALES and SOLEDAD BALLESTEROS Universidad Nacional de Educacion a Distancia, Madrid, Spain SDT _SP is a program written in Pascal that runs in IBM-compatible computers and calculates descriptive as well as inferential statistics for several experimental designs based on signal detection theory and Luce's choice theory (e.g., one-interval designs, rating designs, two-alternative forced choice [2AFCj designs and mAFC designs). The program also generates receiver operating characteristic (ROC) curves from individual as well as group d's. ROC curve plottings can be obtained merely by pressing a key on the computer keyboard. The program is accurate, menu driven, fast, and easy to use. It is available in English and in Spanish.
Detection theory is a general, widely accepted approach to the study of human performance in many experimental, as well as clinical, settings. Researchers in perception (e.g., visual, haptic, auditory), recognition memory, and cognition often ask experimental subjects to discriminate among stimuli. Their performance in these experiments is then analyzed according to the detection theory approach. Classical psychophysical methods confounded sensitivity parameters and response bias. An important advantage of signal detection theory (SDT; Green & Swets, 1966) and choice theory (Luce, 1963) is that they provide measures of sensitivity that are unaffected by bias toward a particular response (MacMillan & Kaplan, 1985). SDT, as well as Luce's choice theory, allows computation and interpretation of sensitivity, as well as bias, parameters from a number of experimental designs (oneinterval designs, rating designs, two-alternative forced choice [2AFC] designs and mAFC designs) in many areas of research. Students of perception and memory who often use detection theory methodology may find it useful to have a comprehensive software program that enables them to speed up their calculations. This work was supported by a UNED Doctoral Fellowship to J.M.R. This computer program originated in the context of haptic perception and memory research supported by DGICYT Grant PB90-0003 and by UNED Research Grants (1991, 1992, 1993) to S.B. Correspondence should be addressed to: S. Ballesteros, Departamento de Psicologfa Basica II, Universidad NacionaJde Educaci6n a Distancia, 28040 Madrid, Spain.
Overview SDT _SP is written in Pascal 6.0. The program not only computes a series of descriptive statistics from a number of different SDT designs and Luce's choice theory but also performs inferential statistical tests, providing strategies for generalizing from the experimental data. These tests can be used to answer questions about the goodness of an estimate and about whether the parameter values differ from 0 or from one another. Receiver operating characteristic (ROC) curve plottings from individual as well as from group d' can be obtained merely by pressing a key on the computer keyboard. Appendix A presents a listing of the interface section of a unit in SDT_SP. The program is accurate, menu driven, easy to use, and quick. Table 1 (top) compares results from yes/no experiments obtained with the use of (1) SDT _SP (leftmost column), (2) an independent statistical program (provided by Boice and Gardner, 1988) that generates parametric as well as nonparametric signal detection parameters (middle column), and (3) MacMillan and Creelman's (1991, p. 8) textbook, Signal detection theory: A user's guide (rightmost column). The second part of Table 1 compares (1) parameters from a rating experiment design computed with SDT _ SP with (2) results from examples in MacMillan and Creelman (1991, p. 60). The third part ofTable 1 corresponds to a nonparametric analysis (MacMillan & Creelman, 1991, p. 364). Finally, the last part of Table I presents results from significance tests for twoparameter as well as for k-parameter signal detection hy151
Copyright 1994 Psychonomic Society, Inc.
152
REALES AND BALLESTEROS Table 1 Comparison of Results from SDT _ SP and Other Sources Boice & Gardner MacMillan & (1988) Creelman Software (1991)
Measure
Marascuilo (1970, pp. 240-243)
BH
a
log a
1.09497 0.27465 0.32207 0.79167 -0.33333
1.095 0.725 0.792 -0.333 2.449 0.896
1.095
2.45 0.90 Rating Experiments
A, C,
C,
Co
C.
P(C) A'
q
BH B"
0.905 0.875 0.914 0.904 1.041 0.560 0.716 0.894 0.773 1.137 0.369 -0.811 -1.455 0.637 0.207 -0.454 -0.815 0.786 0.255 -0.560 -1.005 0.817 0.265 -0.582 -1.045
0.916 0.874 0.913 0.902 1.046 0.55 0.73 0.90 0.76 1.145 0.372 -0.817 -1.468 0.630 0.204 -0.449 -0.807 0.780 0.253 -0.557 -1.000 0.813 0.264 -0.580 -1.042
0.70 0.792 0.667 -0.571 -0.400
Nonparametric Analysis 0.70 0.79 0.667 -0.571 -0.400
Significance Tests for Two-Parameter Signal Detection Hypotheses
2.058 0.500 [0.024, 0.973]
2.06 0.50 [0.03, 0.97]
Significance Tests for k-Parameter Signal Detection Hypotheses
X' V. [ , [ , [, [ , [ , [ ,
] ] ] ] ] ]
7.81 20.5361 [-0.1801, 1.1801] [-0.900, 0.4601] [0.0117, 1.4283] [-1.3461, -0.0939] [-0.4367, 0.8767] [0.2833, 1.5967]
Motivation to Prepare the Program
A number of computer programs have been developed in recent years to calculate several SDT parameters. Usually these programs compute SDT indexes from yes/no experiments (e.g., Gardner & Boice, 1986; MacMillan & Creelman, 1991, Appendix 6) and nonparametric indexes (Boice & Gardner, 1988). Other programs provide algorithms for maximum-likelihood ROC-fitting procedures for choice theory (Ogilvie & Creelman, 1968) and for SDT (Dorfman & Alf, 1969). SDT _ SP originated in our own research on haptic discrimination of bilateral symmetry (Ballesteros, 1993; Ballesteros & Reales, 1992; Ballesteros, Manga, & Reales, 1994)-we needed to compute a number of descriptive and inferential STD parameters fast and accurately. Our starting point was the listing provided by MacMillan and Creelman (1991, Appendix 6) for computing basic (d', C, and (3) STD parameters. Our main interest now is to provide researchers in the SDT area with a general program that accurately computes parameters from a broad number of experimental designs. SDT _ SP also permits the presentation of ROC curves from yes/no designs and rating experiments on the computer screen and plots the ROC curves without one's having to change to a drawing package. The program runs on IBM-compatible personal computers. It is menu driven and very fast, and it checks for errors in data input. The outcome of a discrimination experiment can be expressed by either of two pairs of parameters: hits and false alarm rates, or sensitivity and bias. However, a new feature provided by SDT _SP is the ability to reverse the process of calculating hits and false alarms from SDT parameters as well as from choice theory. Several menus can be selected from the computer screen by just entering the option number. Researchers in detection theory can choose among the options provided by the menus according to the experimental design and the theoretical assumptions.
Yes/No Experiments d' (3 Logs A'
potheses computed with SDT _ SP, in comparison with results reported by Marascuilo (1970, pp. 240-243). As can be seen from all the comparisons, the program's computations are accurate.
7.82 20.54 [-0.18, 1.18] [-0.90, 0.46] [0.01, 1.43] [-1.35, -0.09] [-0.44, 0.88] [0.28, 1.60]
Note-The different sections of this table compare results obtained with this program with results obtained by another software program (when applicable), in a textbook, and in an article on different experimental designs and theoretical assumptions.
Experimental Designs That Can Be Analyzed With This Program
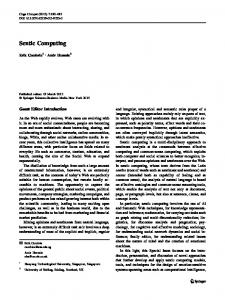
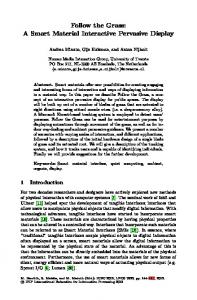
SDT _ SP computes parameters from the most common designs used in the field of detection theory. Figure 1 displays the main menu that appears on the computer screen when the program is called. From this menu, one of the following options can be selected by pressing the appropriate option number: yes/no experiments, nonparametric analysis, rating experiments, or mAFC experiments.
Yes-No Designs
The first option of SDT _ SP allows computation of parameters from yes/no designs (or one-interval designs).
A PROGRAM FOR DETECTION THEORY ANALYSIS Choose option number and 1.- Yes/No Experiments 2.- Nonparametric Analysis 3.- Rating Experiments 4.- mAFC Experiments 5.- Setup 6.- Exit Enter option number:
Figure 1. A printout of the main SDT_ SP menu, showing available options.
In these experiments, subjects are presented on each trial with a stimulus that can belong to one of two categories: noise (N) or signal + noise (SN). The subjects have to discriminate the category to which the stimulus belongs. A good way to characterize the observer's sensitivity is to compute a measure of the discrepancy between the hit rate and the false alarm rate. After entering the number of hits, false alarms, misses, and correct rejections obtained from the stimulus-response matrix of each subject in each experiment, the program generates accurately and immediately the following indexes from STD and choice theory. 1. d', the most important SDT sensitivity measure defined in terms of the distance between the noise and the signal + noise distributions. The sensitivity measure d' is defined in terms of z: d'
=
z(H) - z(F).
a
=
[H(1- F)] /[(1- H)F]1I2.
(2)
5. c (criterion), the basic SDT bias measure, defined as c
=
-0.5 [z(H)
+
z(F)].
(3)
This index is recommended by MacMillan and Creelman (1991) as a better index of subject bias because it is statistically independent of sensitivity d'. 6. c's standard deviation. 7. c', the relative criterion location. 8. The likelihood ratio. 9. b, the choice theory's bias measure computed from b = [(1- H)(1- F) / (HF)]1/2.
(4)
10. b', an analogue choice theory measure to c '. 11. IJL' the likelihood ratio, computed from
IJL = H(1-H) / [F(l-F)].
The program also provides a second option that generates the type of information just discussed, using only the hit and false alarm rates. This gives a smaller number of indexes than the use of the whole confusion matrix as input does; however, we recommend the first option whenever that is possible. Three options are available at this point: (1) to escape; (2) to present the ROC curve on the computer screen; or (3) to obtain an ASCII file of the results. The ROC curve is a graph that represents the functional relation between the proportion of hits (to say "yes" when the signal + noise is present) and the proportion of false alarms (to say "yes" when the noise is present). This program allows the ROC graph corresponding to the input data to be displayed on the screen. In order to get ROC curve prints, a graphic manager, such as GRAPHYCS.COM from MS-DOS, should be loaded before the program. The researcher must also specify the type of printer to be used (see the DOS manual). When the curve appears on the screen, press ALT + PRINT SCREEN, or only PRINT, and a plotting of the ROC curve will be obtained. Detection theory analysis of group data. SDT _ SP allows the computation of d' and c averaged across subjects (d~vg and Cavg). The formula provided by MacMillan and Kaplan (1985, Appendix A) was used to compare the variances of two statistics that estimate d' (or c) from the hit and false alarm rates of 2 subjects (subscripts a and b): var(d~vg)
(5)
= =
var
[0.5(d~
0.25 [var
+
(d~)
d~)]
+
var
(d~)],
(6)
and, generalizing this formula to n number of cases,
=
(1)
2. d' standard deviation and its confidence interval. 3. a. 4. Logo (from choice theory). Log o is calculated from
153
(1/ n)2
E var(d~).
(7)
Significance tests for one-parameter signal detection hypothesis. SDT _SP allows the significance test for hypothesis testing to be computed according to the procedure provided by Marascuilo (1970). This test can be used to estimate the following null hypotheses:
=0 : d; = d; : d; = d; = ... =
H, : d' Ho H Ok
d~.
The same rationale was used to compute the significance test of c. Nonparametric Analysis The program provides indexes for each particulartheory. From the single high-threshold theory, the program provides the adjusted hit rate q, where [q == (H - F) / (l - F)], and the bias index u, which equals the false alarm rate. From the high-threshold theory the program computes the proportion correct as a measure of sensitivity. The yesrate index [0.5(H + F)], and the error ratio (k) are computed as bias indices (see MacMillan & Creelman, 1991).
154
REALES AND BALLESTEROS
Several measures based on area under the ROC curve are computed. A', an index of sensitivity for experiments in which only a single data point is obtained, is calculated with Grier's (1971) formula. Three bias indexes are provided: (1) BH, the Hodos index (Hodos, 1970); (2) B", the Grier index (Grier, 1971); and (3) B'D, the Donaldson index (Donaldson, 1992), computed from
B'D =
(I-H)(I-FA) - HFA (1- H)(I- FA) + HFA'
(8)
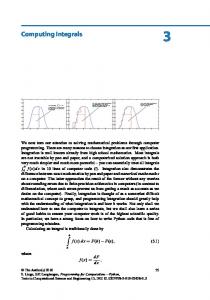
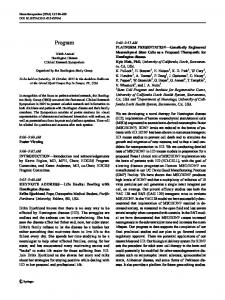
Rating Experiments In rating experiments, subjects are presented with just two events, and the number of possible responses to indicate the subject's level of confidence that one or the other stimuli is present are two or more. Whenever this option is selected, the program asks for the number of possible responses. As an example, we entered the information shown in Table 2, which appeared in MacMillan and Creelman (1991, p. 60), from a complex learning experiment in which subjects were presented with a set of ' 'grammatical" pseudowords and another set of "nongrammatical" words. In answer to the question, "How many possible responses?" we entered six as the number of possible responses. Then, one by one, from left to right and top to bottom, we introduced the data (49, 94, 75, ... 113, 113, shown in Table 2). The program then produced the measures in Table 3. These indexes are (1) theN-l d' estimated, (2) the N-l criteria (both c and (1), (3) the N -1 likelihood ratios, (4) the slope, and (5) the intercept. When the slope differs significantly from 1, SDT _SP produces the following statistics: (1) D a , the length of the hypotenuse of the equilateral right triangle whose legs' length are DYN; (2) A z , a performance index in terms of a proportion; and (3) d~, an index based on the arithmetic average of the standard deviations (see MacMillan & Creelman, 1991). The program does not accept an empty (zero) cell. When this occurs, users are prompted to pool data from adjacent cells (see McNicol, 1972). A plotting of the ROC curve can beobtained with a keystroke. Figure 2 displays the ROC generated by the program corresponding to this example. mAFC Experiments The main feature of 2AFC designs is that both alternatives of response are always present in each trial sequentially or spatially. The mAFC designs are general cases Table 2 Frequency of Each Response for Each Stimulus Response Rules-Only "Grammatical" "Nongrammatical" Condition "3" "2" "1" "1" "2" "3" Grammatical 49 94 75 60 75 22 Nongrammatical 8 37 45 60 113 113 Note-From Detection Theory: A User's Guide (p. 60, Table 3.1), by N. A. MacMillan and C. D. Creelman, 1991, New York: Cambridge University Press. Copyright Cambridge University Press. Adapted by permission.
Table 3 Results Obtained From the SDT_SP Corresponding to the Data Presented in Table 2 d' 0.905 0.875 0.914 0.904 1.041 c 1.576 0.739 0.252 -0.196 -1.043 {3 4.161 1.909 1.258 0.838 0.338 c, 1.537 0.721 0.245 -0.191 -1.018 c, 1.614 0.757 0.258 -0.200 -1.069 c. 1.574 0.739 0.251 -0.195 -1.042 c. 1.575 0.739 0.251 -0.196 -1.043 Note-Slope = 1.050; Intercept = 0.964.
of 2AFC experiments in which two stimulus classes are presented in each trial in a random order but the number of response alternatives is m. In this case, the geometrical space is m-dimensional, and the observer has to decide which distribution is closer to the observation just presented. This type of design is less prone to bias and allows measurement of smaller stimulus differences than do yes/no experiments. Before running the mAFC option from the main menu (see Figure 1), one must generate an ASCII file. The first row of this fIle must have only a number corresponding to the confusion matrix order. The next rows correspond to the matrix data. Numbers in each row of the file must be separated by at least one empty space. Conclusion SDT _ SP is a comprehensive program, written in Pascal Version 6.0, that runs in IBM-eompatible computers. The program computes a number of indexes from SDT and choice theory. A CGA, an EGA, a VGA, or a Hercules-compatible monochrome adapter is necessary if one wishes to plot ROC curves. The program is available in English and in Spanish. It is menu driven, easy to use, quick, and accurate.
W
I-
1.0
d'
= 0.'J05
0.8
d'
= 0.875
0.6
d'
= 0.'J14
0.4
d'
= 0.'JD4
O.Z
d'
=