sor network for ecological monitoring under a shrub thicket canopy on ... esting and valuable monitoring systems. .... Use the SeeMote to issue ping commands.
SeeDTV: Deployment-Time Validation for Wireless Sensor Networks H. Liu, L. Selavo, J. Stankovic Department of Computer Science University of Virginia
{hl4d|selavo|stankovic}@cs.virginia.edu Abstract Deployment of a wireless sensor network (WSN) system is a critical step because theoretical models and assumptions often differ from real environmental characteristics and performance at the deployment site. In addition, such systems are often located in areas that are difficult to reach or even inaccessible for certain periods of time. Therefore, it is imperative to verify the functionality of the system at the time of the deployment, thus lowering the risk of early failures. Coincidentally, the validation minimizes the expense of revisiting the site in the near future for re-deployment, maintenance, or repairs. In this paper we present a deployment time validation framework SeeDTV that consists of techniques and procedures for WSN status assesment and verification. SeeDTV is supported by a portable, lightweight, and low power in-situ user interface device SeeMote. SeeDTV has demonstrated the potential for early problem detection at three levels of WSN in-situ validation: sensor node devices, wireless network physical and logical integrity, and connectivity to the back-end such as a data server over the Internet. SeeDTV is presented in the context of LUSTER – an environmental sensor network for ecological monitoring under a shrub thicket canopy on islands off the coast of Virginia.
1
INTRODUCTION
The theory and design of wireless sensor networks (WSN) have progressed admirably leading to deployment of interesting and valuable monitoring systems. However, the performance of these systems after the deployment often differ considerably from the expected or observed at the time of the development. For example, Szewczyk et al. in their paper present performance of their WSN after the deployment on an island off the coast of Maine [1]. The authors used Woo et al. routing algorithms to measure the packet reception ratio (PRR) performance, and found that the multi-hop networks
Permission to make digital or hard copies of all or part of this work for personal or classroom use is granted without fee provided that copies are not made or distributed for profit or commercial advantage and that copies bear this notice and the full citation on the first page. To copy otherwise, to republish, to post on servers or to redistribute to lists, requires prior specific permission and/or a fee. EmNets’07, June 25–26, 2007, Cork, Ireland Copyright 2007 ACM 978-1-59593-694-3/07/06 ...$5.00
23
deteriorate over time, with some networks delivering under 30 percent of packets [2]. Similarly, Tolle et al. deployed a WSN on a redwood tree, but a large part of the network failed to form the routing topology [3]. Approximately 15 percent of the deployed nodes completely ceased functioning in one week because their batteries had been exhausted due to a design flaw [2]. Other evaluations of real deployments reported that reduced transmission ranges, dirty sensors and short life-time of nodes did not match the expectations obtained through simulations [4, 5]. Li et al. proposed a software environment, called POWER, for planning and deploying wireless sensor networks to real environments to reduce deployment risks [6]. Deployment Support Network (DSN) provides visibility and control with an additional backbone network [7]. Other application-cooperative management mechanisms include the Sensor Network Management System (SNMS) [8] and the Sympathy debugging tool for pre-deployment sensor networks [9]. However, POWER does not anticipate the need for low-power in-field user interfaces, DSN needs additional nodes leading to higher cost and energy consumption, SNMS is too complicated to be executed in inaccessible deployment, and Sympathy can only provide robustness guarantee before the system is deployed. Part of the discrepancy between the expected and real performance is because the communication range of a single node is hard to predict. Contrary to the assumption that the range profile is circular, as used in many calculations, it depends on the hardware design, the deployment location and the environment, and the communication link quality varies considerably as the batteries become depleted [10]. All this evidence suggests a critical issue in WSN: The deployment of a WSN is a non-trivial task and needs certain techniques and tools to validate the performance and prevent early failures of the system in the new environment. In a certain variety of WSN applications, such as large scale and hard to access systems, none of the existing solutions for performance prediction are satisfactory. In this paper we present a deployment-time validation (DTV) approach for wireless sensor networks, called SeeDTV, that consists of techniques and tools to ensure successful deployment of the WSN and assists in maintenance during the subsequent visits of the deployment site. The validation targets three levels of the system: per-node validation, communications validation, and the whole system including application specific validation.
The DTV process in WSN is as important as challenging. The deployment location might be remote and hard to access, the validation tools should be easy to use, light to cary, and have long battery lifetime while providing the user with a means of interaction with the system such as a status display. Traditional tools such as laptop computers and personal digital assistants (PDA) often have considerable size and weight or a limited battery lifetime and require attached radio gateway devices. SeeDTV is using a custom built user interface device SeeMote that responds to the required characteristics better than the typical solutions in size, weight, and power [11]. SeeMote is a small, self-contained device attached to the popular MICAz or MICA2 motes as a sensor-board providing a graphical user interface [12]. The SeeDTV framework is presented in the context of a testbed called LUSTER (Light Under Shrub Thicket for Environmental Research), which is a system featuring automatic monitoring of light and ecological conditions by sensor nodes deployed under brush on a remote island [13]. We describe and discuss the validation process and the user interface implemented on SeeMote. The next section introduces SeeDTV through a WSN validation scenario. It is followed by the discussion of the DTV enabling technology such as the SeeMote. Section 3 presents the implementation and application of SeeDTV in the context of the LUSTER WSN. The summary and future work conclude the paper.
2
SeeDTV
Since the SeeDTV approach relies on the portable, in-situ user interface device SeeMote, it is described first, followed by the deployment-time validation process, and finally, a validation scenario to demonstrate how SeeDTV and SeeMote are used together in a deployment.
2.1
SeeMote module
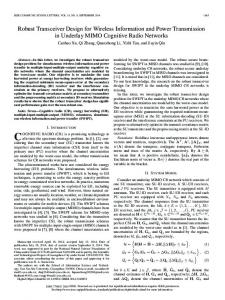
A laptop computer or a PDA are useful tools for WSN deployment verification or configuration. However, the battery lifetime and weight limit the usage of these tools or they become a burden in hard to reach places, such as the volcano observation WSN where the deployment site required several hours of hiking without reasonable means of transportation available [14]. Therefore, SeeDTV makes use of an alternative tool, the SeeMote shown in Figure 1, which is a graphical user interface and logger device that is 5 times lighter and consumes 10 times less power than an average PDA [11]. In addition to the hardware solution, SeeMote provides software support for building graphical and textual user interfaces. In our opinion, SeeMote has the following advantages that make it an extremely useful tool for in-the-field deployment validation of real applications such as the LUSTER system.
2.1.1
Hardware Platform
• Compatible design: this module is a portable and attachable sensor-board compatible with the popular MICAz and MICA2 motes available from Crossbow Technology, Inc [12]. Consequently, the SeeMote is natively compatible with the IEEE 802.15.4 standard widely used for WSN without the need for a gateway device.
24
Figure 1. SeeMote Prototype for Validation Process • Multi-color (64K) graphical user interface available on a 1.8 inch 128 × 160 pixel TFT LCD allows for rich user interfaces and data display. The module also has five-way navigation buttons for input. • Removable storage: the module provides an interface for popular secure digital and multimedia data storage cards allowing data logging on the device for subsequent retrieval on a PC, thus saving the energy and bandwidth, which would be required for the logged data access in the case of embedded storage. • Power-meter functionality: the module is capable of measuring electric power consumption by monitoring electric current and supply voltage for external low power devices. • Light and small size allows SeeMote to fit in almost any pocket and weighs about 5 times less than an average PDA. • Low power consumption: the module consumes about 10 times less current than an average PDA due to the low power display and lower processing capacity yet high enough for WSN applications.
2.1.2
Software Support
An extensible user interface library native to TinyOS has been developed to meet different application-specific requirements. It has the following features: • Textual information output allows for printing symbolic strings and numbers, and color management with a single function call. • Graphical primitives such as pixels, lines, rectangles, boxes and bitmaps are useful for efficient presentation of information. • Device driver interface currently supports three versions of hardware display devices, and can be easily adapted for new platforms, thus ensuring the portability of the SeeMote applications.
2.2
Deployment-Time Validation Process
In this subsection we observe what could go wrong with various components of the WSN and what to do about it in the context of SeeDTV. We also have a SeeMote at our disposal for issuing the test and configuration commands as well as reading the responses and status of the system. We suggest that the approach is taken starting at the node level. Let us assume that we have just placed a sensor network node and turned on the power. • Check the deployment environment. Make sure there is no radio interference or large metallic objects present
that might interfere with the radio communication. Use the Frequency Spectrum Analyzer application for SeeMote as described in [11]. • Verify that each node is reachable by a radio link. SeeDTV initiates a peer-to-peer communication with the node and performs simple echo tests. It checks the RSSI values on both ends making sure that the transmitter and receiver on the node have sufficiently strong communications signals. In our experiments we found that 2 of our 30 MICAz motes have problems with radio reception range and have to be rechecked. • Validate hardware for each WSN node. SeeDTV issues self-test commands to the subject node, such as memory, register contents, and peripherals tests. The test results are displayed on the SeeMote screen. • Check the battery charge level. Make sure that there is sufficient power for the deployment period. Check the rate of the power depletion, if the node supports current consumption measurements on-board. Although the current MICAz nodes do not support current measurements, future hardware platforms should include this feature. In addition to the accurate power consumption this may indicate a failure of the hardware, for example, when a damaged chip has increased current consumption drastically. In one case we found that a custom-built sensor node has abnormally high power consumption exceeding the expected three times. The node would be unreliable in the deployment and its lifetime would be three times less or even shorter than expected. • Query and test the sensor capabilities of the node. Verify that the sensors are enabled by the software and functional. Check the readings of ADC ports. Observe the response of the sensors, if possible. For example, observe the ADC value changing in response to an external excitation of the attached light sensor by a flashlight or by creating an artificial shade. • Perform sensor calibration as applicable. This may require additional tools, or may have been done already prior to the deployment in the lab environment. Now that a deployer is convinced that the nodes are individually functional, it is time to see how they work together. For this a system-wide initialization or configuration command may have to be issued. Note that several of the items below are specific to a system and are listed just as guidelines. • Verify that each node is connected to the network by testing that each node can reach its neighbors and the base node. Use the SeeMote to issue ping commands for individual nodes using single and multihop routes. In addition, the user could request RSSI or LQI values to evaluate the real link quality after the deployment. • Verify the connectivity to the external data sevices. Verify the connection to the external world, i.e., the connection from the base station to the Internet and finally to the data base server. Issue ping requests using SeeMote to several external Internet addresses to verify connectivity.
25
• Test the validity of time-synchronizaion, if present in the system. Monitor the timestamps in the traffic and time synchronization messages. • Observe the wireless traffic, look for patterns that might indicate a malfunction. For example, is one node loosing too many packets, or retransmitting too often? SeeDTV can show the nodes in the near neighborhood and the relevant statistics such as packets transmitted and the observed transmission rate. • Perform system-wide configuration and calibration as needed. At this level consider calibration when input from several nodes is sampled in concert. Verify the ambient signal noise thresholds for the sensor groups. • Assign local or global IDs to each node as required by the system. SeeDTV queries the node for its ID, and assigns one as needed. This can be driven by a physical location or a predetermined order of nodes. Alternatively, the ID assignment may be automated by the system during its configuration. • Finally, make the decision whether the system is ready to be autonomous based on the observations from the tests described above. Replace and recheck the hardware that was detected faulty or unreliable.
2.3
Validation Scenario
In this subsection we briefly describe how the validation process using SeeDTV works. Assuming we are in the process of deploying a WSN and have a SeeMote in our hands, the SeeDTV validation process is defined as checking the conditions of the deployed sensor system at three levels: individual nodes, interacting communications, and the whole system including the link to the external data services, such as a remote database over the Internet. During the deployment, SeeDTV is used to assist setting up the whole network. For example, SeeDTV aids in testing individual parts of each node, such as the data memory, the micro-controller, the radio component, battery, and ADC channels. If all these components work, we assign a local ID to this node and connect it to the network. Note that we prefer assigning the ID to each node at the deployment or self-configuration of the system rather than at software compilation or upload time for flexibility reasons. For example, the localization of the nodes may determine their IDs depending on their position. After verifying key aspects of the functionality of each node we test the communication link quality between the nodes. This is done by a two-stage approach. First, SeeDTV directly communicates with each node to verify the packet transmission and link quality by inspecting the node RSSI value. Second, SeeDTV listens to the wireless traffic in the network and determines the activity of each node based on its participation in the communications. If a node is seldom transmitting or, on the contrary, constantly retransmitting, it may indicate a problem due to the node or its location. Finally, SeeDTV examines the whole system to verify that it has a minimum level of capability as defined by the particular application. For example, SeeDTV aids in checking the system-wide application parameters, re-issues time synchronization, issues sample queries, and initiates system-wide in-
tegrity tests as long as the system supports these specific features to be accessed and manipulated. At last, SeeDTV tests the connection to a remote server over the Internet link to ensure that the WSN data can be exfiltrated to external clients. For large-scale sensor network applications it is often necessary to revisit the deployment site after the deployment in order to verify or troubleshoot the WSN performance. For example, it may be necessary to check whether the sensor nodes in the network have sufficient power supply. It may happen that the power consumption rate is much higher than expected. If the batteries indeed need to be changed, SeeDTV can help identify the actual device. Other checks may include whether the communication links are robust and free of collisions, and whether the obtained readings in several ADC channels truly reflect the conditions in real environments.
3 IMPLEMENTATION 3.1 LUSTER - the target system
Figure 2. Various SeeDTV displays for LUSTER
In this section, we present our proof of concept implementation of SeeDTV in the context of LUSTER sensor system, which is an environmental sciences testbed for automatic monitoring of an ecological environment by sensor nodes deployed on a remote island. The deployment of LUSTER anticipates 121 light sensors deployed on a grid under a shrub thicket. In addition, other sensors such as CO2 , air temperature, wind speed and direction should be allowed for later integration as the hardware becomes available. The system periodically collects data, reports to the mainland, and stores the data in a database connected to the Internet accessed over an amplified wireless gateway. The data is also logged in a distributed storage system for fault tolerance purposes and to implement network delay tolerance features in case the mainland link goes down. LUSTER architecture is a cluster of nodes where each cluster has nodes in a star-like one-hop communications architecture. The clusters operate on separate frequency channels to prevent interference with the neighboring clusters. LUSTER contains the following types of nodes: SensorNode that incorporates a query management system and driver code for sensor hardware support; FlashNode that is a logger node with a removable SD/MMC flash storage card that listens to the wireless traffic, filters and logs certain types of messages and/or data readings; BaseMote that is an interface between WSN and the external network infrastructure; a Stargate that acts as a gateway between the BaseMote and 802.11 wireless connection to the Internet; and a specialized Web Server that serves as a database and user interface connection between users on the Internet and LUSTER. The deployment location of this system is on an island on the Eastern Shore of Virginia. Reaching it requires considerable time of driving, boating, and hiking. Therefore the system deployment is a critical and costly step requiring assurance of long term and reliable functionality of the system after the deployment. It is also too cumbersome to bring the conventional electronics test tools to the field because of their size, cost, and the question of powering them while they are in the field. Instead, a lightweight validation tool with long battery life such as SeeMote fits all the requirements, includ-
26
ing network monitoring, maintenance, and configuration.
3.2
SeeDTV Application
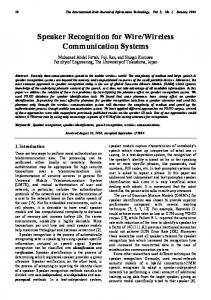
The current proof of concept implementation of SeeDTV includes a DTV application that runs on the SeeMote. The focus at this stage is a single node. By default the application assumes that the sensor nodes are switched on and ready for communication. Therefore SeeMote starts by periodically broadcasting a query message that requests the node configuration and health status, including their local ID, RSSI value, remaining battery voltage (in percentage), and ADC readings (channel 0 to 7 for MICAz motes). Once the SeeMote starts receiving the requested information, it displays the status on the LCD screen. The contents of the display depend on the current SeeDTV mode, as shown in Figure 2. The navigation between the modes is done by the user through the user interface as follows: • Statistics Screen shows all the nodes currently present in the network that are reachable by SeeMote. The information displayed includes the number of packets received from the nodes and their latest RSSI value. A user can navigate among the nodes using the SeeMote buttons and select one for closer examination, which brings them to the Option Screen. • Options Screen presents several options: ”Check Status” to query the specific sensor node, Status Screen to display the current status, ”Restart” to initialize the number of packets received from the node, ”Retimesync” to re-synchronize the time on the network, and ”Reset” to Reset the whole network system. • Status Screen displays the current parameters of a previously selected node, reflecting its status and health. The available information on this interface is the node ID, the number of packets received from this node, the RSSI value between this node and the base station, the remaining battery charge as a percentage, and a general health status as a text message. A push of a button leads to the ADC screen providing more information.
• ADC Screen is a complement to the Status Screen allowing one to observe the actual Analog to Digital Converter (ADC) channel values as they are sampled at each request. These values represent the sensor data, for example, the light intensity received at the location. Thus we can observe the change of the sensory data in real time on the SeeMote. In addition, a moving average of the ADC values over time is displayed to show the trend or average of the sampled signal. It can be used to estimate the presence of noise. The higher the noise, the more the current value will differ from the average value. One of the biggest advantages of SeeDTV validation process is to easily detect and prevent sensor node failures while they are in the field. For instance, finding that the remaining battery charge for some node is less than 20 percent indicates that it cannot last for a long time and consequently the communication quality will deteriorate significantly, and the packet loss rate will increase. By detecting this early while on-site, we can replace the battery for this node thus preventing the adverse effects mentioned above. As another example, when we find that a node with a certain ID cannot be displayed on the SeeMote, although it is nearby, we can explore further into the network and the deployment site to find out whether the node is accidently turned off or whether the radio component has been malfunctioning, which would lead to a decision that the sensor node needs to be replaced. In summary, our experience of SeeDTV in LUSTER has shown it is valuable for component validation and debugging. We found two sensor nodes with weak radio reception and one node with excessive current consumption thus preventing early failures or disfunction of the network. We also detected early crash of one sensor node right after the deployment by testing its ADC channels and realizing that they provided unexpected data values.
4
CONCLUSION
The theory and practice in WSN do not always go hand in hand. Simulation results and expected performance tend to differ significantly from the observations after the deployment of a WSN system. In addition, human error, hardware failures, or specifics of the deployment environment may disturb the system performance early or even reduce its lifetime. These facts call for deployment time validation (DTV) of WSN systems. We have developed a framework SeeDTV for this purpose that consists of procedures, techniques and tools to implement DTV. We also implemented a proof of concept, low-power user interface device SeeMote and a DTV supporting application as tools in the context of SeeDTV. The key features of these tools are to detect WSN problems early at the deployment phase. The systematic approach should be bottom-up: first, validating all the network node devices, then verifying the communication, and finally the performance of the whole system and the specific application. As a result the system has a higher chance of functioning as expected for an extended time, thus preventing early system failures resulting in frequent visits to the deployment site, saving time, effort and resources.
27
SeeDTV and SeeMote were used at the laboratory and local deployments for testing and validation. Our experiences suggest that SeeDTV can be successfully applied during the design and debug phases allowing to spot the faulty components early on. However, more work needs to be done to implement what we envision as a full-featured SeeDTV deployment-time validation approach for the future. The driving idea behind this implementation was not only to have a low-power, low-cost, in-the-field debugging tool, but also a solution to the deployment validation problem in wireless sensor networks, universally applicable for the most cases of WSN deployments as well as customizable for the specific application needs. This work was supported by NSF grants CNS-0614870, CNS-0614773, CNS-0626616 and CNS-0626632.
5
References
[1] R. Szewczyk, J. Polastre, A.Mainwaring, and D. Culler. An analysis of a large scale habitat monitoring application. In Proceedings of the Second ACM Conference on Embedded Networked Sensor Systems, 2004. [2] K. Srinivasan, P. Dutta, A. Tavakoli, and P. Levis. Understanding the causes of packet delivery success and failure in dense wireless sensor networks. In Proceedings of the 4th international conference on Embedded networked sensor systems, Boulder, USA, 2006. [3] G. Tolle, J. Polastre, R. Szewczyk, D. Culler, N. Turner, K. Tu, S. Burgess, T. Dawson, P. Buonadonna, D. Gay, and W. Hong. A macroscope in the redwoods. In Proceedings of the 2nd ACM Conferences on Embedded Networked Sensor Systems,pages 51-63, 2005. [4] P. Dutta, J. Hui, J. Jeong, S. Kim, C. Sharp, J. Taneja, G. Tolle, K. Whitehouse, D. Culler. Trio: enabling sustainable and scalable outdoor wireless sensor network deployments. In Proceeding of the fifth international conference on Information processing in sensor networks, 2006. [5] R. Szewczyk, J. Polastre, A.Mainwaring, and D. Culler. Lessons from a sensor network expedition. In First European Workshop on Sensor Networks, 2004. [6] J. Li, Y. Bai, H. Ji, J. Ma, Y. Tian, A. Qian. POWER: Planning and Deployment Platform for Wireless Sensot Networks. In Fifth International Conference on Grid and Cooperative Computing Workshops, 2006. [7] M. Dyer, J. Beutel, T. Kalt, P. Oehen, L. Thiele, K. Martin, P. Blum. Deployment Support Network -A Toolkit for the Development of WSNs. In Fourth European Workshop on Sensor Networks, 2007. [8] G. Tolle, and D. Culler. SNMS: Application-Cooperative Management for Wireless Sensor Networks. In Proceedings of the 2nd international conference on Embedded networked sensor systems, 2004. [9] N. Ramanathan, K. Chang, R. Kapur, L. Girod, E. Kohler, and D. Estrin. Sympathy for the Sensor Network Debugger. In Proceedings of the 3rd international conference on Embedded networked sensor systems, 2005. [10] G. Zhou, T. He, S. Krishnamurthy, J. Stankovic. Impact of Radio Irregularity on Wireless Sensor Networks. In Proceedings of International Conference on Mobile systems, applications, and services, 2004. [11] L. Selavo, G. Zhou, J. A. Stankovic. SeeMote: In-Situ Visualization and Logging Device for Wireless Sensor Networks. In BroadNet, 2006. [12] XBOW MicaZ Specifications. http://www.xbow.com. [13] LUSTER - Lignt Under Shrub Thicket for Environmental Research. http://www.cs.virginia.edu/˜ls2ef/wsn/enviro/. [14] G. Werner-Allen, K. Lorincz, J. Johnson, J. Lees, and M. Welsh. Fidelity and Yield in a Volcano Monitoring Sensor Network. In Proceedings of the 7th USENIX Symposium on Operating Systems Design and Implementation (OSDI 2006), Seattle, November 2006.