Semantics in Spatial Databases Bart Kuijpers1 , Jan Paredaens1, and Luc Vandeurzen2 1
University of Antwerp (UIA), Dept. Math. & Computer Sci., Universiteitsplein 1, B-2610 Antwerp, Belgium Email: {kuijpers, pareda}@uia.ua.ac.be 2 University of Limburg (LUC), Dept. WNI, Universitaire Campus, B-3590 Diepenbeek, Belgium Email:
[email protected]
Abstract. In this paper we discuss two data models for spatial database systems: the linear data model and the topological data model . Both can be used to model a wide range of applications. The linear data model is particularly suited to model spatial database applications in which exact geometrical information is required and in which this information can be approximated by linear geometrical spatial objects. The topological model on the other hand is suitable for applications in which rather than exact geometrical information the relative position of spatial objects is of importance. We will specify in each case which types of spatial data and spatial databases are under consideration. A semantics for both data models is formally defined in terms of finite representations of spatial databases in the data models. We also present languages to query spatial databases in both models and briefly investigate their expressiveness.
1
Introduction
The number of computer applications in which database systems are used to store and manage spatial or geometric information has grown rapidly during the last decades. CAD/CAM, VLSI-design, robotics, geographical information systems, and medical imaging are only a few examples of applications that use (sometimes large amounts of) two-dimensional or three-dimensional spatial information. Initially, spatial database management systems for such applications were build by extending traditional database management systems by introducing rather trivial spatial data types and by extending SQL in an application-dependent way. Current efforts in spatial database systems, however, aim at developing systems that are specifically suited to deal with spatial information, but which are nevertheless application-independent. This latter goal was set out in the following quote of [12]: “The challenge for the developers of DBMSs with spatial capabilities lies not so much in providing yet another special-purpose data structure that is marginally faster when used in a particular application, but in defining abstractions and architectures to implement systems that offer generic spatial
data management capabilities and that can be tailored to the requirements of a particular domain”.
Apart from the fact that spatial database management systems are now designed as general as possible rather than for one particular application, a number of other and more theoretical concerns dominate the current research in spatial database systems: – theoretical models are needed which support an elegant combination of spatial (or geometrical) information and thematic (or classical) information; – a formally defined semantics is needed that is closed under set-theoretic, geometric and topological operations and that is defined in terms of a finite representation; – efficient implementations of operations on n-dimensional spatial objects are desired; – the connection with visual interfaces and multimedia must be investigated. In this paper we describe two data models both of which are suited to model a wide class of spatial database applications: the linear data model and the topological data model . The linear data model is suited to model spatial database applications in which exact geometrical or geographical information on spatial objects is required and in which this information can be approximated by linear geometrical spatial objects. The topological model on the other hand is suitable for applications in which rather than exact geometrical information the relative position of spatial objects is of importance. The remainder of the paper is structured as follows. In Section 2, we describe the linear data model. First, we look at a number of applications for which this data model is suited: geographical information systems, CAD/CAM and linear decision problems. We analyze the spatial data requirements of these different applications. Next, we formalize the types of data that occur in these applications into the mathematical framework of semi-linear sets in an n-dimensional Euclidean space. We conclude this section by briefly illustrating how the representation scheme of the linear data model can be extended to a language to query spatial databases in the linear data model. In Section 3, we discuss the topological data model. First, we look at a typical example application of spatial databases in the topological data model and at the information that is characteristically contained in such spatial databases. We formally define what we mean by spatial data and spatial databases in this data model: conceptually, spatial databases consist here of points, curves between these points, and areas formed between these curves in the two-dimensional Euclidean plane. We describe a representation of spatial databases by means of a finite data structure which contains exactly the topological information of the spatial database. We conclude by giving a language to query spatial databases in the topological data model and illustrate the expressiveness of this language.
2
Linear Data Model
In this section, we concentrate on spatial database models for applications that require the knowledge of the exact geometric position in space of the spatial data they manipulate. We focus on linear spatial data, although some applications typically handle more general kinds of spatial data. The representation of a coast line, for instance, requires fractal curves. The restriction to linear data is justified however, for the following reasons: 1. at this moment there are few efficient algorithms known to implement the variety of spatial operations on curved data; 2. linear figures are perfectly suitable to approximate more general data with; and 3. the simplicity of linear data will offer us several desirable properties. As an introduction, we discuss three different kinds of spatial applications. We briefly analyze the kind of spatial data each application requires to detect all necessary and sufficient data requirements. All these requirements together will motivate the choice of our final spatial data type. We propose a general and natural data type that, in our opinion, covers all possible data requirements for the intended applications. The representation scheme based on this data type is complete, in the sense that it can deal with every n-dimensional, mathematically definable linear geometric figure. Once the representation of the spatial data is known, we describe formally the linear data model and explain its syntax and semantics. We present possible linear database instances for the discussed applications to show the effectiveness of the linear model. Finally, we conclude with extending the representation tool of linear figures to a linear spatial query language. 2.1
Data Requirements
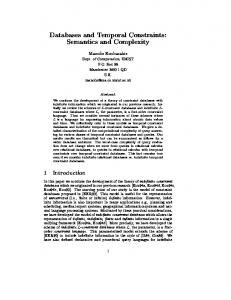
In this section, we analyze the spatial data requirements of three totally different spatial applications. In the first example, we discuss the kind of spatial data required in geographical information systems. Next, we investigate the various spatial objects used in CAD/CAM. Finally, we show how linear (decision) problems can be interpreted as intersections, unions, differences, and projections of n-dimensional linear figures. Geographical information systems [21] are one of the first applications that demanded a spatial database system. The task of the spatial database is to store a representation of some geographical area, e.g., a road map, together with text and number information as, for instance, speed limits and one way directions. Representations of geographical areas are typically two-dimensional maps graphically visualizing the relevant information. Figure 1 shows a simplified representation of Belgium. On this map, we have displayed the two most important rivers, some cities, and the three regions of Belgium. Unavoidably, we grap at the polygon data type (to represent two dimensional areas), the line-segment type
(to represent borders and rivers), and the point data type (to represent cities), for this purpose. Complex, not necessarily topologically connected, geographical objects are provided as compositions of these basic data types. The literature mentions various data models based on these primitive types [10, 13, 14, 15, 29, 31]. figure=belgie.eps,width=11truecm,height=9truecm
18 17
Antwerp
16 Bruges
15
Flanders
14
Brussels
13
Hasselt
Scheldt Brussels
12 11
Li` ege
10
Walloon Region
9 Meuse
8 Charleroi
7 6
Bastogne
5 4 3 2 1 1
2
3
4
5
6
7
8
9
10 11 12 13 14 15 16 17 18 19 20 21 22 23
Fig. 1. Spatial information map of Belgium.
The same geographical area can be viewed from various perspectives. We can focus on the road infrastructure, the land use, and weather information, for instance. All these different thematic layers of the same area cannot be displayed on the same two-dimensional representation of the area. One particular way to solve this brings all these thematic layers together and considers them as one spatial data object in higher-dimensional space. In CAD/CAM, the data requirements are somewhat different. Typically, CAD/CAM applications store and manipulate a database containing the representation and features of three-dimensional scenes and solid objects. Up to now, constructed solid geometry (CSG), together with the boundary representation method, are the most widely propagated representation tools for CAD/CAM objects. In the CSG representation scheme, a geometric object is described as a composition of primitive objects. Figure 2 shows a primitive of
Z
Y
X
Fig. 2. A solid pyramid as CSG-primitive.
type “pyramid.” The composition is achieved via motial and combinatorial operators. Under motial operators we understand affine transformations as for instance rotation and translation. Examples of combinatorial operators are the set operations union, intersection, and difference. Figure 3 shows an object with a T-shape. Using the CSG methodology, we scale the cube-primitive in each direction to obtain the two box-shape components that constitute the original object. The union of the translated boxes finally forms the representation of the object. Although solid objects are always topologically closed, it can be very helpful to use open figures to define them as illustrated by Figure 4. Two boxes are connected using a lump in the one box that precisely fits a notch in the other box. The one box can be represented as the union of the box with a small cube and the other box as the difference of the box with the topologically open interior of the same small cube. Until now, we were only concerned about the representation of real-world objects. These could all be described using at most three free parameters. The result of linear spatial queries, however, can not always be described with three free variables. Consider, e.g., the query “Compute the position of a couple of shelves in a furnitured room such that desks can still be sit at, and doors and drawers can still be opened.” The solution (the coordinates of the mass-centers of the shelves) will define an object in (at least) six-dimensional space. Moreover, that object will not be topologically closed, since open doors and drawers may not touch the shelves. In general, the solution to this kind of linear problems might be an n-dimensional, unbounded and topologically non-closed geometric figure [4].
Z
Z 1
scale rotate
1 1
Y
translate
Y
X
X
Fig. 3. Composition of two boxes into a T-shape.
2.2
Linear Representation Scheme
In this section, we try to formalize the various data types proposed in the previous section into a mathematical framework. This mathematical framework allows the representation of every semi-linear set definable in n-dimensional Euclidean space. Furthermore, the framework is safe in the sense that only linear figures can be represented. As it is more natural to represent a geometrical figure as an enumeration of all its points, the representation we use will be of type “point-set.” However, we have to represent our “point-sets” in a finite way to allow physical storage. More formally, assume a totally ordered infinite set of variables over R called real variables. Define a linear Pk term as a linear polynomial with rational coefficients, i.e., of the form i=1 ai xi , where x1 , . . . , xk are real variables and a1 , . . . , ak are rational constants. An atomic linear formula is a condition of the form T θ a where T is a linear term; θ one of the following binary comparison operators =, , ≤, ≥, and 6= ; and a a real constant. A linear formula is an arbitrary well-formed formula in first-order logic with addition, i.e., – atomic linear formulae are linear formulae; – if ϕ and ψ are linear formulae, then ϕ ∧ ψ; ϕ ∨ ψ; and ¬ϕ are linear formulae; and – if x is a real variable and ϕ is a linear formula in which x is free, then (∃x)ϕ is a linear formula.
Fig. 4. A connection between two boxes.
Every linear formula ϕ with n free variables, x1 , . . . , xn , defines a point-set {(x1 , . . . , xn ) | ϕ(x1 , . . . , xn )} in n-dimensional Euclidean space Rn . A geometrical figure in Rn will be called a semi-linear set if there exists a linear formula ϕ with n free variables such that the point-set defined by ϕ coincides with the geometrical figure. The representation of a semi-linear set is any linear formula, ϕ, that defines a point-set equal to the semi-linear set.
It is obvious that this representation scheme is not unique. In fact, any semilinear set can be represented by an infinite number of linear formulae. On the contrary, the representation scheme is unambiguous. Every linear formula ϕ defines exactly one semi-linear set. Example 1. Consider a tessellation of the two-dimensional plane R2 defined by tiles of k by l, respectively in the x- and y-direction. The tile with coordinates (m, n) can be defined as the semi-linear set {(x, y) ∈ R2 | (0 ≤ x − mk ≤ k) ∧ (0 ≤ y − nl ≤ l)} The linear formula (0 ≤ x−mk ≤ k)∧(0 ≤ y−nl ≤ l) is called the representation of the tile with coordinates (m, n). Assume in the following example that we are working in the three-dimensional Euclidean space R3 . Example 2. Assume we want to create a prism with height a in the z-direction. The representation of this prism is given by the linear formula ϕ(x, y) ∧ (0 ≤ z ≤ a), where ϕ defines the base of the prism in the xy-plane. Any prism with the same shape can now be defined in R3 as a composition of a translation and a rotation of this prism primitive. In general, any affine transformation can be applied to the prism primitive since affine transformations can be very simply expressed as linear formulae. If we consider, for instance, an affine transformation that does not affect the z-coordinate, the resulting prism may be described in terms of xnew , ynew , and znew by the linear formula (∃x)(∃y)(ϕ(x, y) ∧ (xnew = ax + by + tx) ∧ (ynew = cx + dy + ty )) ∧ (0 ≤ znew ≤ a) with a, b, c, d, e, tx, ty constants defining the affine transformation. We have explored in this example a very powerful property of the linear representation scheme: the expressibility of affine transformations with linear formulae. This, together with the basic set operations union, intersection, and difference, of which we will show semi-linear sets to be closed under, allows the definition of linear figures using the “constructed solid geometry” method. The Boolean operators appearing in linear formulae can be regarded as providing the set operations union, intersection, difference, and Cartesian product. Existential quantification of a semi-linear set can be interpreted as a geometrical projection. This allows us to deduce certain closure properties. Proposition 1. Semi-linear sets are closed under the set operations union, difference, intersection, and Cartesian product, and under projection. Example 3. Let ϕ(x, y, z) be a linear formula with three free variables, defining a three-dimensional linear figure. The projection of this figure on the xy-plane is obtained as {(x, y) ∈ R2 | (∃z)ϕ(x, y, z)}.
The above closure properties allow us to establish the equivalence between semi-linear sets and mathematically definable linear figures. A practical tool to deal with semi-linear sets are polytopes. A polytope in the Euclidean space (of arbitrary dimension) is defined as the convex hull of a non-empty finite set of points in that space [5, 23, 17]. An open polytope is the topological interior of a polytope with respect to the smallest sub-space containing the polytope. Proposition 2. Bounded semi-linear sets and finite unions of open polytopes are equivalent. For a proof of this theorem, we refer to [33]. However, since polytopes are necessarily bounded, finite unions of polytopes can only represent bounded linear figures. Therefore, we present another tool characterizing semi-linear point-sets in all their appearances. G¨ unther [11] defines polyhedral chains as a representation scheme for geometric data. A polyhedral chain in the Euclidean space (of arbitrary dimension) is defined as a finite sum of cells each of which is a finite intersection of half-spaces. Proposition 3. Semi-linear sets and polyhedral chains are equivalent. For a proof of this theorem, we again refer to [33]. Proposition 3 proves effectively the equivalence of semi-linear sets with mathematically definable linear figures. The above characterizations allow us to conclude that most spatial data types found in the literature are sub-types of the semi-linear set data type. G¨ uting [13, 14] proposes in his geo-relational algebra the spatial data types point , line, and polygon, which can be seen respectively as zero-, one-, and twodimensional polytopes.3 In his spatial data representation model Egenhofer [9] proposes simplices as basic objects , which are special kinds of polytopes. In summary, semi-linear sets constitute a very general and elegant paradigm to represent linear spatial data, which are the kind of spatial data that are most often considered. We believe semi-linear sets have the potential for efficient implementation. Brodsky et al. [4, 3] introduced canonical forms for linear formulae to make efficient implementation of operations on semi-linear sets possible. Lassez et al. [20, 16] have proposed variable elimination algorithms for sets of linear constraints. The alternative characterizations we presented offer the opportunity to use polyhedral chains or polytopes as internal representation for semi-linear sets. G¨ unther [11] has described efficient algorithms to perform set-operations on polyhedral chains. Algorithms to compute efficiently the union or intersection of n-dimensional polytopes are provided by Putnam et al. [28]. Several operations and techniques described in computational geometry, such as plane sweep and divide-and-conquer, can also be used for this purpose [22, 32, 6, 27]. Finally, the notion of semi-linear set is not bounded to any particular dimension. 3
The polygons considered by G¨ uting are not necessary convex, but can always be decomposed into convex polygons.
2.3
The Linear Data Model
The linear spatial database model is based on the relational model, because linear spatial databases require a lot of traditional database capabilities. In particular, if the linear spatial database consists purely of non-spatial flat relations, it degenerates into a traditional database for which the relational model offers a well-accepted representation. Moreover, the relational model, and the relational calculus and algebra as well, have the interesting property of being easily extendible with new data types and operators. More formally, a linear spatial database scheme consists of a finite set of relation names. Each relation name R is of some type [n, m], with n and m integers. A linear spatial database instance is a mapping that assigns a linear relation instance to each relation name appearing in the database scheme. A linear instance of R, also called a linear relation, is a finite set of linear tuples of type [n, m]. A linear tuple of type [n, m] is straightforwardly defined as a tuple of the form (c1 , . . . , cn , ϕ(x1 , . . . , xm )) where c1 , . . . , cn are thematic values from some domain U and ϕ(x1 , . . . , xm ) is a linear formula with m free real variables. The semantics of a linear tuple t = (c1 , . . . , cn , ϕ(x1 , . . . , xm )) of type [n, m] is the possibly infinite subset of U n × Rm defined as the Cartesian product {(c1 , . . . , cn )} × S, in which S ⊆ Rm is the semi-linear set {(x1 , . . . , xm ) | ϕ(x1 , . . . , xm )}. This subset of U n × Rm can be interpreted as a possibly infinite (n + m)-ary relation, denotedSI(t). The semantics of a linear relation, r, denoted I(r), is defined as I(r) = t∈r I(t). Finally, the semantics of a linear spatial database, DB, is the set of relations I(r) with r a linear relation of DB. In the remainder of this section, we give example spatial databases for the map of Belgium and the CAD/CAM objects depicted in Section 2.1. The spatial information displayed on the map of Belgium can be categorized into city, river, and region information. Therefore, we introduce three relations, each containing one of these spatial information sources (Figure 5). All three relations are of type [1, 2]. Of course we could include more thematic information, e.g., we could add to the city-relation the number of inhabitants or tourist information. Finally, we present a relation containing the spatial representation of the CAD/CAM objects defined in Section 2.1 (Figure 6). 2.4
The Linear Spatial Calculus
In this section, we present a calculus-like query language, called FO + linear. The linear calculus, FO + linear, is obtained by adding to the language of linear formulae of Section 2.2 the following: – a totally ordered infinite set of variables called thematic variables, disjoint from the set of real variables; – atomic formulae of the form v1 = v2 , with v1 and v2 non-spatial variables;
Cities Name Antwerp Bastogne Bruges Brussels Charleroi Hasselt Li`ege
Geometry (x = 10) ∧ (y = 16) (x = 19) ∧ (y = 6) (x = 5) ∧ (y = 16) (x = 10.5) ∧ (y = 12.5) (x = 10) ∧ (y = 8) (x = 16) ∧ (y = 14) (x = 17) ∧ (y = 11)
Rivers Name Geometry Meuse ((y ≤ 17) ∧ (5x − y ≤ 78) ∧ (y ≥ 12)) ∨ ((y ≤ 12) ∧ (x − y = 6) ∧ (y ≥ 11)) ∨ ((y ≤ 11) ∧ (x − 2y = −5) ∧ (y ≥ 9)) ∨ ((y ≤ 9) ∧ (x = 13) ∧ (y ≥ 6)) Scheldt ((y ≤ 17) ∧ (x + y = 26) ∧ (y ≥ 16)) ∨ ((y ≤ 16) ∧ (2x − y = 4) ∧ (y ≥ 14)) ∨ ((x ≤ 9) ∧ (x ≥ 7) ∧ (y = 14)) ∨ ((y ≤ 14) ∧ (−3x + 2y = 7) ∧ (y ≥ 11)) ∨ ((y ≤ 11) ∧ (2x + y = 21) ∧ (y ≥ 9)) Regions Name Brussels Flanders
Geometry (y ≤ 13) ∧ (x ≤ 11) ∧ (y ≥ 12) ∧ (x ≥ 10) (y ≤ 17) ∧ (5x − y ≤ 78) ∧ (x − 14y ≤ −150) ∧ (x + y ≥ 45)∧ (3x − 4y ≥ −53) ∧ (¬((y ≤ 13) ∧ (x ≤ 11) ∧ (y ≥ 12) ∧ (x ≥ 10))) Walloon Region ((x − 14y ≥ −150) ∧ (y ≤ 12) ∧ (19x + 7y ≤ 375) ∧ (x − 2y ≤ 15)∧ (5x + 4y ≥ 89) ∧ (x ≥ 13)) ∨ ((−x + 3y ≥ 5) ∧ (x + y ≥ 45)∧ (x − 14y ≥ −150) ∧ (x ≥ 13)) Fig. 5. Representation of the spatial database of Belgium shown in Figure 1.
– atomic formulae of the form R(v1 , . . . , vn ; p1 , . . . , pm ), with R a relation name of type [n, m], v1 , . . . , vn non-spatial variables, and p1 , . . . , pm linear terms; and – universal and existential quantification of non-spatial variables. A query expressed in FO + linear has the form: {(x1 , . . . , xn ) | ϕ(x1 , . . . , xn )} where ϕ(x1 , . . . , xn ) is an expression of FO+linear with x1 , . . . , xn free variables. Finally, we shall give some typical example queries, illustrating the expressive power of FO + linear. A precise characterization of the expressive power of FO + linear is still wide open. For a deeper investigation concerning the expressiveness and limitations of FO + linear, we refer to [33].
Objects Material Geometry glass (z ≥ 0) ∧ (−5y + 2z ≤ 10) ∧ (5x + 2z ≤ 10)∧ (5y + 2z ≤ 10) ∧ (−5x + 2z ≥ 10) BoxWithNotch wood (0 ≤ x ≤ 2) ∧ (0 ≤ y ≤ 10) ∧ (0 ≤ z ≤ 2)∧ ¬((0.5 < x < 1.5) ∧ (4.25 < y < 5.75) ∧ (1 < z ≤ 2) BoxWithLump wood ((0 ≤ x ≤ 2) ∧ (3.5 ≤ y ≤ 6.5) ∧ (5 ≤ z ≤ 12))∨ ((0.5 ≤ x ≤ 1.5) ∧ (4.25 ≤ y ≤ 5.75) ∧ (4 ≤ z ≤ 5) T-part steel ((−5 ≤ x ≤ 5) ∧ (−3 ≤ z ≤ 3) ∧ (0 ≤ y ≤ 2))∨ ((−5 ≤ x ≤ 5) ∧ (2 ≤ y ≤ 5) ∧ (−1 ≤ z ≤ 1) Name Pyramid
Fig. 6. Representation of the spatial database containing the CAD/CAM objects defined in Section 2.1.
Example 4. An example of a (very simple) linear spatial query on the database in Example 1 is “Find all cities that lie on a river and give their names and the names of the rivers they lie on.” This query can be expressed by the following linear calculus expression: {(c, r) | (∃x)(∃y)(Cities(c, x, y) ∧ Rivers(r, x, y))}. In all the remaining queries, we shall assume the input database consists of one relation S of type [0, n]. We shall also use point-variables instead of real variables, e.g., equations such as (x < y) should be interpreted as (x1 < y1 ) ∧ · · · ∧ (xn < yn ). In particular, (x 6= 0) means (x1 6= 0) ∧ · · · ∧ (xn 6= 0) and not (x1 6= 0) ∨ · · · ∨ (xn 6= 0)! Example 5. The following FO + linear-expression decides whether S is bounded: (∃d )(∀x )(∀y )(S(x ) ∧ S(y ) ⇒ −d < y − x < d ). Example 6. Several topological properties of a semi-linear set can be computed in FO + linear. For instance, the topological interior of S is computed by the following FO + linear expression: (∃d )((d 6= 0) ∧ (∀y )(x − d < y < x + d ) ⇒ S(y )). Similarly, the topological closure and topological boundary of S can be computed in FO + linear. In spite of all this, FO+linear can not be considered as a fully adequate query language. Afrati et al. [2] proved that the query “Does the semi-linear set S lie on a line?” is not expressible in FO + linear. The list of non-expressible FO + linear-queries is further extended in [33] with the predicate collinear(x, y, z), which checks if the three points x, y, and z are collinear, and the predicate ch(x1 , . . . , xm , y), which computes all points y belonging to the convex hull of the set of points {x1 , . . . , xm }.
3
The Topological Data Model
In this section, we focus on a spatial database model suited for applications in which knowledge about the relative positions of spatial objects is of importance rather than exact information about the geometric position of the spatial data. We limit the discussion to spatial databases that, conceptually, consist of points, curves between these points and areas formed by these curves in the two-dimensional Euclidean plane. These databases are commonly referred to as spatial databases in the topological data model. We will use a railway system as an example application that can be modeled in this way. We discuss a representation of this type of databases by means of a finite data structure that is primarily geared towards supporting queries that involve only topological properties of the spatial database. This is reflected by the fact that this data structure represents topologically equivalent spatial databases in the same way, but also represents topologically non-equivalent spatial databases in a different way. A representation that satisfies these properties corresponds to an interface which allows the user to concentrate precisely on all the topological properties of the spatial database. Finally, to conclude this section, we present a language to query spatial databases in the topological data model. 3.1
A Typical Application
Travel information is often provided to the train traveler by means of a spatial database such as the railway map shown in Figure 7. In this map, cities (or their railway stations) are represented by points labeled with the city name and train tracks between the stations are represented by curves connecting these points. Such spatial database (or map) does not contain exact geographic information. There is no information in this map concerning the exact position of cities or railway stations. It also contains no information to answer a metric query such as “What is the distance between London and Calais?” Since the traveler’s main concern is not the longitude or latitude of cities he is also not surprised to find London shown right of Brussels in Figure 7 while in reality it is west of Brussels. On the other hand, with the help of such maps, the traveler can answer his or her typical queries such as “Is there a connection from Brussels to Liverpool with a stop in London?” or “Do I pass Dover before passing Calais when traveling from Antwerp to London?” The class of queries which are of importance to a traveler is formed by those queries involving only properties of the map which are topological in nature. Here, concepts such as adjacency, connectivity, and containment are in the focus. The topological properties of a map are exactly those properties that are shared by any two spatial databases that can be obtained from each other by a topological deformation4 . As an example of topologically equivalent spatial databases we take the map of Figure 7 and a representation of 4
The notion of topological deformation will be made precise later.
Antwerp
Brussels Calais Dover
London Sheffield
Liverpool Leeds
Manchester
Newcastle
Fig. 7. A railroad map.
the same railway system by a conventional map which corresponds more closely to reality. Since in the former map the length of lines is not related to the actual length of the trajectory, length is not a topological property. Since, however, both maps show the same connections, connectedness is a topological property. In the present section, we elaborate on the idea of topological property in the context of databases consisting of points, curves between these points, and areas formed by these curves [26]. For a survey of other application domains that can be modeled by means of a finite number of points in the plane and curves connecting them, we refer to Chapter 5 of the book by Laurini and Thompson [21] and references therein. 3.2
Spatial Databases in the Topological Data Model
In this section, we exactly define what we mean by spatial data and spatial databases in the topological data model. We work in the Euclidean plane R2 . Definition 4. A spatial database in the topological data model consists of a finite set of labeled points, a finite set of labeled curves, and a finite set of labeled areas. Each point label is assigned to a distinct point in R2 . Each curve label is assigned to a distinct non-self-intersecting continuous curve5 in R2 that starts and ends in a labeled point and does not contain any other labeled points except these. Two curves only intersect in a labeled point. Each area label is assigned to a distinct area formed by the labeled curves. 5
In topological terms, this is a simple Jordan curve [24].
G
u
H v
s
α F
β
A t B
γ I
p
δ
r w
E
η D q
C
J
Fig. 8. An example of a spatial database in the topological data model.
We remark that this definition allows curves to start and end in the same point, i.e., the database may contain loops. It also may contain multiple curves between two points. It is easily shown that for a database with n curve labels the number of area labels is bounded by n + 1. We apply the following notational convention throughout the remainder of this section: Roman lower-case characters p, q, . . . denote point labels, Roman capitals A, B, . . . denote curve labels and Greek characters α, β, . . . are used for area labels. Figure 8 gives an example of a spatial database. This database has eight points, one of which (w) is isolated. It contains ten curves, three of which (A, I, and J) are loops. There are five areas, one of which (α) is unbounded. 3.3 Representations of Spatial Databases in the Topological Data Model The example application of Section 3.1 shows that in the topological data model the interpretation of spatial data is topological in nature. In other words, spatial databases in the topological data model contain information about topological properties and contain, e.g., no information about metric properties. When we want to effectively represent spatial databases in the topological data model, and we know that only topological properties are under consideration, it may be desirable to have a representation of a spatial database which is topologically invariant, meaning that topologically equivalent databases will be represented in the same way. Ideally, a representation should also be lossless, in the sense that two databases that are not topologically equivalent will be represented differently. In order to define these concepts formally, we first have to make the notion of topologically equivalent databases precise. Figure 9 gives an example of two equivalent spatial databases. Intuitively, two spatial databases are topologically
A β
A r B
p α
D γ
β
B
C q
r
p
D
γ
α
C
q
Fig. 9. Two topologically equivalent databases.
equivalent if one can be obtained from the other by a continuous deformation. Mathematically, this continuous deformation is formalized by the notion of isotopy [24]. An isotopy h is a continuous series (ht | 0 ≤ t ≤ 1) of homeomorphisms of the plane. We thus define: Definition 5. Two spatial databases D1 and D2 are called topologically equivalent if there exists an isotopy h in R2 such that h0 (D1 ) = D1 and h1 (D1 ) = D2 , with the understanding that h respects the labels of points, curves, and areas. Definition 6. A representation of a spatial database is called topologically invariant if any two topologically equivalent spatial databases are represented in the same way. A representation of a spatial database is called lossless if any two spatial databases that are not topologically equivalent are distinguished by the representation. Example 7. As an example of a representation of spatial databases in the topological data model we take the representation underlying the cartography system of the US Bureau of the Census [8] (see also [26]). Here a spatial database is represented by means of a classical database consisting of four relations, R1 , R2 , R3 , and R4 , on the labels of points, curves, and areas. – – – –
R1 R2 R3 R4
gives for every curve its two endpoints; gives for every curve its two adjacent areas; give for each area its border of alternatingly curves and points; and gives for each point its neighborhood of alternatingly curves and areas.
For relation R3 , a clockwise order is agreed upon for outer borders of areas and a counter-clockwise order is used for holes in areas. For relation R4 , a clockwise order is used. Figure 10 illustrates the relations R1 , R2 , R3 , and R4 for the depicted spatial database.
s ε
u
D p
I C A E α β δ H r B qFγ G t
R1
R2
R3
R4
Apq
A α β
α pA1
p A α 1
Aqp
A β α
α qB2
p C δ
Bqr
B α γ
α rC3
p D β 3
Brq
B γ α
β pD1
q B α 1
Crp
C α δ
β sE2
q A β 2
Cpr
C δ α
β tF3
q F γ 3
2
Fig. 10. The relations R1 , R2 , R3 and R4 illustrated.
The following property shows that this representation can be reduced to the relation R4 only. Proposition 7. R1 , R2 , and R3 can be deduced from R4 . Proof. R1 consists of the tuples determined by the algebra expression Π215 (σ16=5 (σ2=6 (R4 × R4 ))) and the tuples (App) for which (pDβi − 1) ∈ R4 , (pAαi) ∈ R4 , (pCαj) ∈ R4 and (pAβj + 1) ∈ R4 . To deduce R2 we have the following algebra expression: R2 = Π237 (σ36=7 (σ2=6 (R4 × R4 )))
. To deduce R3 we have Π123 (R3 ) = Π312 (R4 ) and (αpAi) ∈ R3 (αqB) ∈ Π123 (R3 ) ⇒ (αqBi + 1) ∈ R3 . (ApQ) ∈ R1 ⊓ ⊔ It is more convenient to denote the relation R4 of Example 7 for each labeled point p as a circular alternating list of curve and area labels rather than as a set of tuples [19]. Actually, this alternating list of labels corresponds to the labels of the curves and areas that an observer, placed in the point p, sees when he makes a full clockwise circular scan of the environment of the point p. A formal definition of this alternating circular list was given in [19] and it was referred to as the observation of a spatial database from the point p and denoted as Obs(p). The collection of the observations of a spatial database from each of its points is called the observation of the spatial database. The observation of a spatial database satisfies the first requirement of a representation: Proposition 8. [19] The observation of a spatial database is an invariant representation of a spatial database. Is this representation, on the other hand, lossless? The answer is no. Figure 11 contains two spatial databases that can certainly not be obtained from one another by a continuous deformation. So, they are not topologically equivalent but nevertheless represented identically by means of their observation. We have for both the following: Obs(p) = (αCδDβA), Obs(s) = (εEβDδI), Obs(q) = (αAβF γB), Obs(t) = (εGγF βE), Obs(r) = (αBγHδC), Obs(u) = (εIδHγG). Hence, drastically different spatial databases can be represented in exactly the same way by means of their observations. In [19] it is shown, however, that there is a single cause for this phenomenon: by explicitly marking one of the areas as the unbounded area, losslessness is achieved. Theorem 9. [19] A spatial database is losslessly represented by its observation and the the label of the unbounded area. Indeed, the two spatial databases of Figure 11 mainly differ in the fact that for the first ε is the label of the unbounded area while it is the label for a bounded one in the second database. Theorem 9 justifies the introduction of a reserved label, α∞ , for the unbounded area.
s ε I
u
D p
A E α δ β r B q H γ F G t C
u I H
G ε s
δ C r
α B
t E
γ F
D β p A q
Fig. 11. Two spatial databases that are not topologically equivalent but that have the same observation.
3.4
Querying Spatial Databases in the Topological Data Model
To query spatial databases in the topological data model we introduce the following 3-sorted first-order language LPCA . LPCA has three sorts of variables: – boldfaced lower-case characters are used for point-variables: p, q, r, . . .; – boldfaced capitals are used for curve-variables: A, B, C, . . . ; and – boldfaced Greek characters are used for area-variables: α, β, γ, . . .. The language LPCA has one constant : α∞ , the label of the unbounded area. A term in LPCA is p = q with p and q point-variables; A = B with A and B curve-variables; α = β with α and β area-variables; α = α∞ with α an area-variable; AαB ⊂ Obs(p) with p a point-variable, A and B curve-variables and α an area-variable or the area-constant α∞ ; or – α = Obs(p) with p a point-variable, and α an area-variable or the areaconstant α∞ .
– – – – –
An expression in LPCA is – a term; – a combination of expressions using ∨, ∧, ¬, →; or – (∃p)ϕ, (∃A)ϕ and (∃α)ϕ with ϕ an expression and p a point-variable, A a curve variable and α an area-variable. A query expressed in LPCA has the form {(p1 , . . . , pn , A1 , . . . Am , α1 , . . . αk ) | ϕ(p1 , . . . , pn , A1 , . . . Am , α1 , . . . αk )},
where ϕ(p1 , . . . , pn , A1 , . . . , Am , α1 , . . . αk ) is an expression in LPCA with free point-variables p1 , . . . , pn , free curve-variables A1 , . . . , Am and free area-variables α1 , . . . αk . AαB ⊂ Obs(p) means that the observation of the database from p has the form (. . . AαB . . .). The term α = Obs(p) is redundant if a spatial database is not allowed to contain isolated labeled points. The semantics of the expressions in LPCA is clear. It should be noticed, however, that the language LPCA includes AαB ⊂ Obs(p) as a term but does not include the construction αAβ ⊂ Obs(p) as a term. The following property explains why. Proposition 10. αAβ ⊂ Obs(p) if and only if (∃B)BαA ⊂ Obs(p)∧(∃C)AβC ⊂ Obs(p) ∧ (∀γ)(∀D)AγD ⊂ Obs(p) → (γ = β ∨ γ = α). Proof. If αAβ ⊂ Obs(p), then the list Obs(p) is of the form . . . BαAβC . . .. This proofs the existence of a B and C with the desired properties. If we assume (∃γ)(∃D)AγD ⊂ Obs(p)∧¬γ = β∧¬γ = α, then there are three areas adjacent to A. This is clearly impossible. If α = β, we have the same conclusion since (∃γ)(∃D)AγD ⊂ Obs(p) ∧ ¬γ = α is in contradiction with the fact that A is not a loop in p. For the other implication, we observe that the observation of the database from p looks like . . . BαAβC . . . or like . . . BαAδ 1 D1 . . . δ n AβC . . .. The first case implies αAβ ⊂ Obs(p). In the second case, δ1 = β or δ 1 = α. The former of these two again yields the desired result. In the case δ 1 = α, we have β = α, whence the proposition. ⊓ ⊔ We note that the condition (∀γ)(∀D)AγD ⊂ Obs(p) → (γ = β ∨ γ = α) is necessary in the previous proposition. If we consider a spatial database with one point p with Obs(p) = (Bα∞ AγAα∞ Cα∞ ), we do not have α∞ Aα∞ ⊂ Obs(p) but still there exists a B and a C such that Bα∞ A ⊂ Obs(p) and Aα∞ C ⊂ Obs(p). On the other hand, we have Proposition 11. The constructions AαB ⊂ Obs(p) cannot be expressed in terms of the constructions αAβ ⊂ Obs(p). Proof. For both spatial databases in Figure 12, αAα ⊂ Obs(p), αBα ⊂ Obs(p), and αCα ⊂ Obs(p) hold. For the first, AαB ⊂ Obs(p) holds, but for the second AαB ⊂ Obs(p) does not hold. So, AαB ⊂ Obs(p) cannot be expressed in terms of the others. ⊓ ⊔ As a first example of a query expressed in LPCA we take the query “Does the spatial database contain a loop?” This is a Boolean query (n = 0, m = 0 and k = 0) and it is expressed by the formula (∃p)(∃α)(∃β)(∃A) ¬α = β ∧ αAβ ⊂ Obs(p) ∧ βAα ⊂ Obs(p), in which we use the abbreviation from Proposition 10. The relations R1 , R2 , R3 , and R4 of Section 3.3 can all be expressed in LPCA :
r
s
B
C
C A q
p
s B
A
α∞
p
α∞
q
Fig. 12. Two spatial databases with the same area-curve-area information.
– (A, p, q) ∈ R1 if and only if (¬p = q ∧ (∃α)(∃β) αAβ ⊂ Obs(p) ∧ βAα ⊂ Obs(q)) ∨ (p = q ∧ (∃α)(∃β) ¬α = β ∧ αAβ ⊂ Obs(p) ∧ βAα ⊂ Obs(p)); – (A, α, β) ∈ R2 if and only if (∃p) αAβ ⊂ Obs(p); – (α, p, A, i) ∈ R3 if and only if (∃β) βAα ⊂ Obs(p) and to determine the order of the tuples in R3 : (α, p, A, i) ∈ R3 and (α, q, B, i + 1) ∈ R3 if and only if (∃β) βAα ⊂ Obs(p) ∧ (∃β) βBα ⊂ Obs(q) ∧ BαA ⊂ Obs(q); – (p, A, α, i) ∈ R4 if and only if (∃B)AαB ⊂ Obs(p) and to determine the order of the tuples in R4 : (p, A, α, i) ∈ R4 and (p, B, β, i + 1) ∈ R4 if and only if AαB ⊂ Obs(p) ∧ αBβ ⊂ Obs(p) ∧ (∃C) BβC ⊂ Obs(p). An important query in the context of spatial databases in the topological data model is “Is the database connected?” Connectivity for a binary relation is not expressible in the first-order calculus for relational databases (see, e.g., Chapter 17 of [1]). For spatial databases in the topological data model we have Open Problem: Is connectivity expressible in LPCA ? Again following the results for the classical case, we see that connectivity is expressible in LPCA + fixpoint. We define the relation Ci for points p and q as follows: Ci (p, q) is true if and only if there is a path from p to q of length at most i in the spatial database. Clearly, C1 is expressible in LPCA . Let ϕ(T ) = C1 (p, q) ∨ T (p, q) ∨ (∃r)(T (p, r) ∨ C1 (r, q)). Then clearly Ci+1 = ϕ(Ci ). For non-inflationary fixpoint semantics, the least fixpoint C of ϕ can be used to express “Is the database connected?”: (∀p)(∀q) ¬p = q → C(p, q). Acknowledgements The results in this paper were presented by the three authors at the EDBT Summer School “Advances in Database Technology” in Gubbio, Italy, September
4–8, 1995. The authors are indebted to Marc Gyssens, Jan Van den Bussche, and Dirk Van Gucht for the collaborative research that has lead to several of the results discussed in this paper. The authors also thank Marc Gyssens for carefully proofreading the paper.
References 1. S. Abiteboul, R. Hull, and V. Vianu, Foundations of Databases, Addison-Wesley Publishing Company, 1995. 2. F. Afrati, S. Cosmadakis, S. Grumbach, and G. Kuper, “Linear Versus Polynomial Constraints in Database Query Languages,” in Proceedings 2nd Int’l Workshop on Principles and Practice of Constraint Programming (Rosario, WA), A. Borning, ed., Lecture Notes in Computer Science, vol. 874, Springer-Verlag, Berlin, 1994, 181–192. 3. A. Brodsky, J. Jaffar, and M.J. Maher, “Toward Practical Constraint Databases,” in Proceedings 19th Int’l Conf. on Very Large Databases (Dublin, Ireland), 1993, 567–580. 4. A. Brodsky and Y. Kornatzky, “The LyriC Language: Querying Constraint Objects,” in Proceedings Post-ILPS’94 Workshop on Constraints and Databases (Ithaca, NY), 1994. 5. A. Brøndsted, An Introduction to Convex Polytopes, Graduate Texts in Mathematics, vol. 90, Springer-Verlag, New York, 1983. 6. I. Carlbom, “An Algorithm for Geometric Set Operations Using Cellular Subdivision Techniques,” IEEE Computer Graphics and Applications, 7:5, 1987, 44–55. 7. A. Chandra and D. Harel, “Computable Queries for Relational Database Systems,” Journal of Computer and System Sciences, 21:2, 1980, 156–178. 8. J.P. Corbett. Topological Principles of Cartography. Technical Paper No. 48, US Bureau of the Census, Washington, DC, USA: US Government Printing Office, 1979. 9. M.J. Egenhofer, “A Formal Definition of Binary Topological Relationships,” in Proceedings Foundations of Data Organization and Algorithms, W. Litwin and H.-J. Schek, eds., Lecture Notes in Computer Science, vol. 367, Springer-Verlag, Berlin, 1989, 457–472. 10. M.J. Egenhofer, “Why not SQL!”, Int’l J. on Geographical Information Systems, 6:2, 1992, 71–85. 11. O. G¨ unther, ed., Efficient Structures for Geometric Data Management, Lecture Notes in Computer Science, vol. 337, Springer-Verlag, Berlin, 1988. 12. O. G¨ unther and A. Buchmann, Research Issues in Spatial Databases, in Sigmod Record, vol. 19, 4, 61-68, 1990. 13. R.H. G¨ uting, “Geo-Relational Algebra: A Model and Query Language for Geometric Database Systems,” in Advances in Database Technology—EDBT ’88 , Proceedings Int’l Conf. on Extending Database Technology (Venice, Italy), J.W. Schmidt, S. Ceri, and M. Missikoff, eds., Lecture Notes in Computer Science, vol. 303, Soringer-Verlag, Berlin, 1988, 506–527. 14. R.H. G¨ uting, “Gral: An Extensible Relational Database System for Geometric Applications,” in Proceedings 15th Int’l Conf. on Very Large Databases (Amsterdam, the Netherlands), 1989, 33–34. 15. R.H. G¨ uting, “An Introduction to Spatial Database Systems,” VLDB-Journal , 3:4, 1994, 357–399.
16. T. Huynh, C. Lassez, and J.-L. Lassez. Fourier Algorithm Revisited. In Proceedings 2nd Int’l Conf. on Algebraic an Logic Programming, H. Kirchner and W. Wechler, eds. Lecture Notes in Computer Science, vol. 463. Springer Verlag, Berlin, 1990, 117–131. 17. P.J. Kelly and M.L. Weiss. Geometry and Convexity: a Study in Mathematical Methods, J. Wiley and Sons, New York, 1979. 18. P.C. Kanellakis, G.M. Kuper and P.Z. Revesz, “Constraint Query Languages,” Journal of Computer and System Sciences, to appear, also in Proceedings 9th ACM SIGACT-SIGMOD-SIGART Symposium on Principles of Database Systems (Nashville, TN), 1990, 299–313. 19. B. Kuijpers, J. Paredaens, and J. Van den Bussche “Lossless representation of topological spatial data,” in Proceedings 4th Symposium on Advances in Spatial Databases, M. J. Egenhofer and J. R. Herring, eds., Lecture Notes in Computer Science, vol. 951. Springer Verlag, Berlin, 1995, 1–13. 20. J.-L. Lassez, “Querying Constraints,” in Proceedings 9th ACM SIGACTSIGMOD-SIGART Symposium on Principles of Database Systems (Nashville, TN), 1990, 288–298. 21. R. Laurini and D. Thompson. Fundamentals of Spatial Information Systems. The A.P.I.C. Series, 37, Academic Press, 1992. 22. M. Liebling and A. Prodon, “Algorithmic Geometry,” in Scientific Visualization and Graphics Simulation, D. Thalmann, ed., J. Wiley and Sons. 14–25. 23. P. McMullen and G.C. Shephard, Convex Polytopes and the Upper Bound Conjecture, University Press, Cambridge, 1971. 24. E.E. Moise. Geometric Topology in Dimensions 2 and 3. Graduate Texts in Mathematics, vol. 47, Springer-Verlag, 1977. 25. J. Paredaens, J. Van den Bussche, and D. Van Gucht, “Towards a Theory of Spatial Database Queries,” in Proceedings 13th ACM SIGACT-SIGMOD-SIGART Symposium on Principles of Database Systems (Minneapolis, MN), 1994. 279–288. 26. J. Paredaens. Spatial Databases. The Final Frontier. Database Theory - ICDT ’95, Lecture Notes in Computer Science, vol. 893, 14–32, Springer-Verlag, 1995. 27. F.P. Preparata and D.E. Muller. “Finding the Intersection of n Half-Spaces in Time O(nlogn),” Theoretical Computer Science, 8, 1979, 45–55. 28. L.K. Putnam and P.A. Subrahmanyam, “Boolean Operations on n-Dimensional Objects,” IEEE Computer Graphics and Applications, 6:6, 1986, 43–51. 29. N. Roussopoulos, C. Faloutsos, and T. Sellis, “An Efficient Pictorial Database System for PSQL,” IEEE Transactions on Software Engineering, 14:5, 1988, 639–650. 30. W. Schwabhauser, W. Szmielew, and A. Tarski. Metamathematische Methoden in der Geometrie, Springer-Verlag, Berlin, 1983. 31. P. Svensson and Z. Huang, “Geo-Sal: A Query Language for Spatial Data Analysis,” in Proceedings 2nd Symposium on Advances in Spatial Databases, O. G¨ unther and H.-J. Schek, eds. Lecture Notes in Computer Science, vol. 525. SpringerVerlag, Berlin, 1991, 119–140. 32. B. Tilove, “Set Membership Classification: a Unified Approach to Geometric Intersection Problems,” IEEE Transactions on Computers, C-29:10, 1980, 874–883. 33. L. Vandeurzen, M. Gyssens, and D. Van Gucht, “On the Desirability and Limitations of Linear Spatial Query Languages,” in Proceedings 4th Symposium on Advances in Spatial Databases, M. J. Egenhofer and J. R. Herring, eds., Lecture Notes in Computer Science, vol. 951. Springer Verlag, Berlin, 1995, 14-28.