Jul 1, 2004 - weather station networks is to provide temperature data ... Climate Center, 236 L. W. Chase Hall, Lincoln, NE 68583-0728. side the radiation ...
JULY 2004
LIN AND HUBBARD
1025
Sensor and Electronic Biases/Errors in Air Temperature Measurements in Common Weather Station Networks* X. LIN
AND
K. G. HUBBARD
School of Natural Resource Sciences, University of Nebraska at Lincoln, Lincoln, Nebraska (Manuscript received 1 August 2003, in final form 17 February 2004) ABSTRACT The biases of four commonly used air temperature sensors are examined and detailed. Each temperature transducer consists of three components: temperature sensing elements, signal conditioning circuitry, and corresponding analog-to-digital conversion devices or dataloggers. An error analysis of these components was performed to determine the major sources of error in common climate networks. It was found that, regardless of microclimate effects, sensor and electronic errors in air temperature measurements can be larger than those given in the sensor manufacturer’s specifications. The root-sum-of-squares (RSS) error for the HMP35C sensor with CR10X datalogger was above 0.28C, and rapidly increases for both lower (,2208C) and higher temperatures (.308C). Likewise, the largest errors for the maximum–minimum temperature system (MMTS) were at low temperatures (,2408C). The temperature linearization error in the HO-1088 hygrothermometer produced the largest errors when the temperature was lower than 2208C. For the temperature sensor in the U.S. Climate Reference Networks (USCRN), the error was found to be 0.28 to 0.338C over the range 2258 to 508C. The results presented here are applicable when data from these sensors are applied to climate studies and should be considered in determining air temperature data continuity and climate data adjustment models.
1. Introduction A primary goal of air temperature measurement with weather station networks is to provide temperature data of high quality and fidelity that can be widely used for atmospheric and related sciences. Air temperature measurement is a process in which an air temperature sensor measures an equilibrium temperature of the sensor’s physical body, which is optimally achieved through complete coupling between the atmosphere and air temperature sensor. The process accomplished in the air temperature radiation shield is somewhat dynamic, mainly due to the heat convection and heat conduction of a small sensor mass. Many studies have demonstrated that to reach a higher measurement accuracy both good radiation shielding and ventilation are necessary for air temperature measurements (Fuchs and Tanner 1965; Tanner 1990; Quayle et al. 1991; Guttman and Baker 1996; Lin et al. 2001a,b; Hubbard et al. 2001; Hubbard and Lin 2002). Most of these studies are strongly associated with the study of air temperature bias or errors caused by microclimate effects (e.g., airflow speed in* Agricultural Research Division, University of Nebraska at Lincoln, Journal Series Number 14228. Corresponding author address: Dr. K. G. Hubbard, University of Nebraska, Institute of Agriculture and Natural Resources, High Plains Climate Center, 236 L. W. Chase Hall, Lincoln, NE 68583-0728.
q 2004 American Meteorological Society
side the radiation shields radiative properties of sensor surface and radiation shields, and effectiveness of the radiation shields). Essentially, these studies have assumed the equation governing the air temperature to be absolutely accurate, and the investigations have focused on the measurement accuracy and its dependence on how well the sensor is brought into equilibrium with the atmospheric temperature. Such findings are indeed very important for understanding air temperature measurement errors in climate monitoring, but it is well known that all microclimate-induced biases or errors also include the electronic biases or errors embedded in their temperature sensors and their corresponding data acquisition system components. Three temperature sensors are commonly used in the weather station networks: A thermistor in the Cooperative Observing Program (COOP) that was formally recognized as a nationwide federally supported system in 1980; a platinum resistance thermometer (PRT) in the Automated Surface Observing System (ASOS), a network that focuses on aviation needs; and a thermistor in the Automated Weather Station (AWS) networks operated by states for monitoring evaporation and surface climate data. Each of these sensors has been used to observe climate data over at least a ten year period in the U.S. climate monitoring networks. The U.S. Climate Reference Network (USCRN) was established in 2001 and gradually and nationally deployed for monitoring long-term and high quality surface climate data. In the
1026
JOURNAL OF ATMOSPHERIC AND OCEANIC TECHNOLOGY
VOLUME 21
TABLE 1. Sensor characteristics of air temperature measurements in the COOP, AWS, ASOS, and USCRN networks. Network COOP MMTS
Sensing elements Sensing element model Resistance at 258C (ohms) Temperature range (8C) Sensitivity (ohms 8C 21 ) Interchangeability (68C)
at 2408C at 08C at 1408C
AWS
ASOS Sensor model
HMP35C HO-1088 Manufacturer name
Vishay Dale
Fenwal Electronics
Thermistor A 1140 20 000 250 to 50 244 980 23 340 2429 0.45 to 0.2
Thermistor UUT51J1 100 000 235 to 50 2265 500 218 950 22 196 0.45 to 0.2
USCRN system, a PRT sensor was selected for the air temperature measurements. All sensing elements in these four climate monitoring networks are temperaturesensitive resistors, and the temperature sensors are referred to as the maximum–minimum temperature system (MMTS), sensor: HMP35C, HO-1088, and USCRN PRT sensors, respectively, in the COOP, AWS, ASOS, and USCRN networks (see Table 1). The basic specifications of each sensor system including operating temperature range, static accuracy, and display/output resolution can be found in operation manuals. However, these specifications do not allow a detailed evaluation, and some users even doubt the stated specifications and make their own calibrations before deploying sensors in the network. In fact, during the operation of either the MMTS sensor in the COOP or HO-1088 hygrothermometer in the ASOS, both field and laboratory calibrations were made by a simple comparison using one or two fixed precision resistors (National Weather Service 1983; ASOS Program Office 1992). This type of calibration is only effective under the assumption of temporal nonvariant sensors with a pure linear relation of resistance versus temperature. For the HMP35C, some AWS networks may regularly calibrate the sensors in the laboratory, but these calibrations are static (e.g., calibration at room temperature for the data acquisition system). It is not generally possible to detect and remove temperature-dependent bias and sensor nonlinearity with static calibration. In the USCRN, the PRT sensor was strictly calibrated from 2508 to 1508C each year in the laboratory. However, this calibration does not include its corresponding datalogger. To accurately trace air temperature trends over the past decades or in the future in the COOP, AWS, ASOS, and USCRN and to reduce the influence of time-variant biases in air temperature data, a better understanding of electronic bias in air temperature measurements is necessary. The objective of this paper is to carefully analyze the sensor and electronic biases/errors induced by the
USCRN USCRN PRT
Temperature Specialist, Inc.
Thermometrics Corporation
PRT Class A PRT 100 at 08C 250 to 50 0.392
PRT Class A PRT 1000 at 08C 250 to 50 0.385
0.1
0.1
temperature sensing element, signal conditioning circuitry, and data acquisition system. 2. Sensor and its circuitry a. Determining air temperature from resistance The sensing elements in the MMTS and HMP35C sensors are thermistors that have a negative temperature coefficient; that is, their resistance decreases with the increase of sensing temperature. Experimental evidence shows that an individual thermistor curve can be very closely approximated through use of the Steinhart–Hart equation (Steinhart and Hart 1968): 1 5 A 1 B lnR T 1 C(lnR T ) 3 , T
(1)
where the unit of temperature T is in kelvins and the resistance of the thermistor R T is in ohms; A, B, and C are curve-fitting constants. This equation is able to fit within 60.028C of the calibration points for individual thermistors in the MMTS and HMP35C sensors. The PRT in the ASOS and USCRN is a resistance temperature detector (RTD) constructed using platinum. It has a positive temperature coefficient. Typically, the resistance of a PRT changes by 0.392% 8C21. The Callendar–Van Dusen equation describes the temperature curve within 60.0458C as follows (Nachtigal 1990):
[
1100 2 1211002 T T 2 b1 2 121 2 , 100 100
R T 5 R0 1 R0 a T 2 d
T
T
]
3
(2)
where R 0 is the resistance at T 5 08C. It should be noted that the T is in degrees Celsius in Eq. (2). The coefficients a, b, and d are constants determined by testing the PRT at four temperatures and solving the resulting
JULY 2004
1027
LIN AND HUBBARD
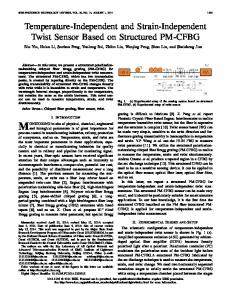
FIG. 1. Schematics of the MMTS sensor’s signal conditioning.
equations. For the HO-1088 sensor, the designer utilized an approximate linear relation for the ASOS HO-1088 hygrothermometer. The resistance sensitivity of the HO1088 and USCRN PRT is smaller than that of the thermistors in the MMTS and HMP35C sensors (Table 1). In this study, Eqs. (1) and (2) are applied to the MMTS, HMP35C, HO-1088, and USCRN PRT sensors in the following error analysis.
(VIN ) required to generate a full-scale output of 4096 counts is VIN 5 2 VREF , where the VREF is the reference voltage that is a voltage across pins 36 and 39 (Fig. 1). Therefore, the VREF here is 0.5(V1 2 2.8) V according to the voltage divider constructed by R2, R3, and the reference output (V1 2 2.8) of the ICL7109. The display count of the ICL7109 is designed as count 5 2048 3
b. Schematics of sensor signal conditioning Measurements of resistance are usually taken with a full-bridge or half-bridge circuitry (voltage divider) with either a precision reference current or voltage to excite the resistance network. Figure 1 illustrates the main circuitry for the MMTS sensor’s signal conditioning for the A1140 thermistor. It is a simple half-bridge measurement (R19 and A1140 thermistor) that is excited by a reference voltage output from ICL7109’s pin 29. The reference voltage applied here is nominally 2.8 V below the voltage V1 (pin 40, nominally 5 V generated from an LM2930-5 regulator). The analog-to-digital convertor (ADC) ICL7109 is a 12-bit high-performance integrating device with polarity and over-range outputs. The half-bridge measurement is fed into the analog input (VIN pins 34 and 35) of the ICL7109. The analog input
VIN RT 5 4096 3 . VREF R T 1 20 000
(3)
The resistance measurements in the HMP35C are configured by using a datalogger; for example, a CR10X datalogger (Campbell Scientific, Inc., Logan, Utah) is commonly selected in an AWS network. The UUT51J1 thermistor in the HMP35C is shown in Fig. 2. Its output signal is measured by a 2-V AC excitation (VREF ) provided by the CR10X datalogger. The analog signal output ranges from 0.46 to 7.05 mV with corresponding temperature from 2408 to 1 508C. Therefore, the temperature signal (V S ) related to resistance is VS 5
1000VREF . R T 1 25 000
(4)
Due to the PRT’s low sensitivity, the HO-1088 sensor signal conditioning circuitry contains two main com-
1028
JOURNAL OF ATMOSPHERIC AND OCEANIC TECHNOLOGY
VOLUME 21
and offset by U8B to a more convenient and linear scale approximately equal to 22 V at 2508C and 2 V at 1508C. The gain of U8B is set to 20 and the input offset value (20.5 V at 08C) is cancelled out by the signal through the R14, R35, and the 6.2-V reference voltage. Note that the 6.2-V reference voltage is provided by a temperature compensated zener reference diode (IN825, not shown in Fig. 3). Both amplifier gain and offset are slightly adjustable by varying the setting of two potentiometers, R34 and R35. These adjustments are used for the onboard calibration during the operation of the HO1088. The analog temperature and dewpoint temperature signals are transmitted into the same ADC (ICL7109) as used in the MMTS through an analog multiplexor. The relationship between the analog temperature signals and the PRT resistance is
FIG. 2. Voltage divider for the HMP35C temperature sensor.
ponents: one is a constant dc current generator (U8A, OP200AZ operational amplifier); the second is an inverting amplifier with zero and span adjustment (U8B) (Fig. 3). It should be noted that both air temperature and dewpoint temperature measurement in the HO-1088 sensor use exactly the same analog signal conditioning circuitry as in Fig. 3, and in both cases the same type of PRT device. A 5-mA constant dc current is generated from a 6.2-V reference voltage source through a precision 1240-ohm resistor (R13), and a feedback current of opposite polarity is equal to the U8A output voltage through the PRT of HO-1088. This configuration provides an output voltage approximately equal to 20.5 V at 08C, 20.4 V at 2508C, and 20.6 V at 1508C. These values could be used directly for measurements and display purposes; however, they are amplified, inverted,
VS 5 2
[
1
2
R16 1 R34 2VREF 3 R15 R13 3 RT 1
]
R16 1 R34 3 VREF , R14 1 R35
(5a)
where the R13, R14, R15, and R16 are fixed resistors with 0.1% tolerance, and R34 and R35 are two potentiometers (Fig. 3). Submitting nominal resistor values, determined by the gain and offset cancellation, Eq. (5a) can be simplified for the output count of the ADC ICL7109 as VS 5 3303 3 (100R T 1 1). VREF
count 5 2048
(5b)
The USCRN PRT sensor is measured by a CR23X datalogger at the USCRN site. The measurement is taken through two voltage measurements on two adjacent single-ended channels with a 1.5-V excitation (VREF ) to determine the ratio of sensor resistance to a fixed re-
FIG. 3. Schematics of the HO-1088 hygrothermometer’s signal conditioning for air temperature measurement in the ASOS.
JULY 2004
LIN AND HUBBARD
FIG. 4. Half-bridge in the USCRN PRT sensor.
FIG. 5. Temperature measurement errors in the MMTS in the COOP.
sistance (1000 ohms) (Fig. 4). This three-wire halfbridge configuration of USCRN PRT resistance measurement compensates for the lead wire resistance. The ratiometric measurement of resistance conducted in Fig. 4 by the CR23X eliminates the reference voltage errors. In addition, the excitation polarity is reversed by the CR23X datalogger to eliminate the effects of external and internal offset voltage errors. Therefore, without considering the lead wire effects and reference voltage errors, the voltage outputs range from approximately 668 to 816 mV for two outputs (‘‘High’’ and ‘‘Low’’ outputs in Fig. 4), corresponding to 2508 to 1508C, respectively. In this treatment we follow the sensitivity of output voltage to other factors by taking the following derivation from Ohm’s law: VS 5
VREF R T . R T 1 1000
1029
(6)
3. Error analysis and results Air temperature errors originating with the sensing element, analog signal conditioning, and data acquisition system include the sensor interchangeability error, polynomial and linearization errors, self-heating error, voltage or current reference (excitation) error, total offset and drift in the amplifiers and ADC (associated with stability), and lead wire error. A root-sum-of-squares (RSS) of each error component was conducted for the total error of temperature measurement in the MMTS, HMP35C, and USCRN PRT sensors and these are in addition to any errors caused by ambient microclimate factors (radiation and insufficient convection effects). The sensor interchangeability errors were obtained from the sensor manufacturers. The polynomial error refers to the error caused by a polynomial computation for temperature measurement in the HMP35C with CR10X datalogger. The linerization error represents the error
due to a linearized process conducted in the HO-1088 sensor. Any fixed resistors in the signal conditioning circuitry can produce the error of temperature measurement due to their tolerances and temperature coefficients (tempco). For the analog signal conditioning circuitry, we only presented significant errors that are caused by the fixed resistor’s tolerance or tempco. The resistance measurement taken in the CR10X dataloggers is specified to have 60.02% of full-scale range (FSR) of the input voltage on which the measurement is made in the range 2258 to 508C of the datalogger’s operating temperature. For the CR23X datalogger, there are two specifications: accuracy 60.015% of FSR for 08 to 408C and accuracy 60.02% of FSR elsewhere but still within 2258 to 1508C. There is no specification when the datalogger’s operating temperature is below 2258C. Note that the datalogger error for the HMP35C and USCRN PRT sensors was estimated by using a specification’s value at 2258C. Therefore, the datalogger error might be underestimated when the operating temperature of the datalogger is below 2258C. Because resistance measurement in the MMTS is a complete ratiometric approach (Fig. 1), the effect of stability or drift with temperatures of voltage reference (VREF ) can be negligible even though the voltage source comes from a simple LM2903-5 regulator. This point can also be found from Eq. (3); that is, the ADC output (count) depends on the R T . Furthermore, the maximum self-heating power over the MMTS measurement range is about 0.05 mW, and its effect can be ignored. The least significant bit (LSB) error in the ADC of the MMTS is a reasonable estimate (ICL7109 Data Sheet from Harris Semiconductor, Melbourne, Florida) that brings about the temperature errors shown in Fig. 5. The lower circuitry sensitivity in the lower temperature ranges of the MMTS makes the MMTS resolution in the lower temperature around 0.258C (0.278C at temperature
1030
VOLUME 21
1.5 V dc
61000
5 mA dc
62030
0 750 1.47 0.56 0.04
USCRN PRT ASOS
3.0
250 22000 67.5 62200
0 3.33 0.104 0.004 0.02
2 V ac 1.1 V dc
Temperature (8C) Analog outputs (mV) Circuitry sensitivity (mV 8C 21 ) Self-heating power (mW) 1LSB error (68C)
250 2148 21.95 0.03 0.27
0 1684 219.1 0.04 0.03
50 438 217.2 0.05 0.03
240 0.46 0.031 0.0009 0.06
HMP35C MMTS
50 7.05 0.035 0.002 0.06
Analog input range (mV)
Excitation or VREF
0 0 40 (linear) 2.0 2.5 0.01
50 2000
250 668.1 1.83 0.55 0.03
USCRN ASOS Sensor model
Network AWS COOP
TABLE 2. Analog signal conditioning characteristics of air temperature measurements in the COOP, AWS, ASOS, and USCRN networks.
50 816.3 1.2 0.56 0.05
JOURNAL OF ATMOSPHERIC AND OCEANIC TECHNOLOGY
FIG. 6. Temperature measurement errors in the HMP35C in the AWS.
2508C). This implies that the MMTS temperature observations are unable to discriminate 6 0.258C changes in the lower temperature ranges (Fig. 5 and Table 2). The interchangeability of the MMTS thermistors is from 60.28C from temperature 2408 to 1408C and 60.458C elsewhere (Fig. 4). Two fixed resistors (R2 and R3) with a 0.02% tolerance produced larger temperature errors of measurement in low temperatures, but the error caused by the fixed resistor R19 in Fig. 1 can be ignored. Therefore, the RSS errors in the MMTS are from 0.318 to 0.628C from temperature 2408 to 2508C (Fig. 5). For the HMP35C sensor, Fig. 6 shows the sensor interchangeability, polynomial error, fixed resistor error, and CR10X datalogger error. The polynomial error rapidly increases when temperature is below 2308C. Two fixed resistors (1000 and 249 000 ohms with 0.1% tolerance) resulted in larger errors in higher temperatures. The CR10X datalogger error for the HMP35C was within 0.18C. From the RSS error, the total temperature errors are quite large over 0.38C when temperatures are beyond 6308C (Fig. 6). Furthermore, the RSS error from 2308 to 2408C is dramatically increased from 0.358 to 1.078C. In the HMP35C sensor, the self-heating error is very small and can be ignored (Table 2). Like the MMTS sensor, the HO-1088 hygrothermometer is not affected by voltage reference (VREF 5 6.2 V). Two stage amplifiers (OP200AZ) have very low input bias current (I B 1 IOS 5 0.24 nA is typical value for temperatures from 2558 to 11258C) and input offset voltage (VOS 5 45 mV, typical over the same temperature range) (data sheet of OP200AZ, Analog Devices, Norwood, Massachusetts); thus, transferring these values according to the schematics in Fig. 3, air temperature errors are less than 0.018C. The major errors in the HO1088 are interchangeability, linearization error, fixed resistor error, and self-heating error (Table 2 and Fig. 7). The linearization error in the HO-1088 is relatively serious because the analog signal (Fig. 3) is simply lin-
JULY 2004
LIN AND HUBBARD
FIG. 7. Temperature measurement errors of the HO-1088 hygrothermometer in the ASOS.
earized from 2508 to 508C versus 22 to 2 V. The maximum magnitude of linerization error reached over 18C (Fig. 7). There are four fixed precision resistors: R13, R14, R15, and R16 with a 0.1% tolerance. However, the error of temperature measurement caused by the R14, R15, and R16 can be eliminated by the adjustment of amplifier gain and offsets during onboard calibration operations in the HO-1088. The error caused by the input fixed resistor R13 is illustrated in Fig. 7. Since this error was constantly varied from 20.28 to 20.38C, it can be cancelled during the onboard calibration. It is obvious that a 5-mA current flowing through the PRT in the HO-1088 is not appropriate, especially because it has a small sensing element (20 mm in length and 2 mm in diameter). The self-heating factor for the PRT in the HO-1088 is 0.258C mW 21 at 1 m s 21 airflow (Omega Engineering 1995), corresponding to the selfheating errors 0.58C when the self-heating power is 2 mW (Table 2 and Fig. 7). Compared to the linearization error and self-heating error, the interchangeability and LSB error in the HO-1088 sensor are relative small, 60.18 and 60.018C, respectively (Table 2). The RSS errors associated with using the CR23X datalogger and the USCRN PRT sensor were from 0.28 to 0.348C (Fig. 8). Results in Fig. 8 indicate that the error from the CR23X datalogger was a major source of error for the USCRN PRT sensor. It should be noted that this result does not really imply the performance of CR23X, but it reveals that the USCRN PRT sensor is not suitable for the CR23X datalogger if a higher accuracy is required in the USCRN network. This is because the half-bridge circuitry in the USCRN PRT only utilizes a very small portion (668–816 mV) of the full-scale input range (61000 mV) (Table 2). The analog output signals only use 7.4% of the full-scale input range in the USCRN PRT measurements. This suggests that to obtain a higher accuracy from the CR23X the USCRN PRT should be improved for its signal sensitivity. In
1031
FIG. 8. Temperature measurement errors of the USCRN PRT sensor in the USCRN.
addition, the self-heating power dissipated in the USCRN PRT sensor is relatively large for a standard PRT (1000 ohms) sensor (Table 2). Although the current through the USCRN PRT sensor is smaller than the 5mA current in the HO-1088 sensor it is still not appropriate for the USCRN PRT sensor. The error by the fixed resistor’s tolerance (1000 ohms, 0.01% tolerance, and 10 ppm 8C 21 in Fig. 4) increased from room temperature (258C) to 2508C. The tempco error of the fixed resistor was less than 0.0258C. 4. Conclusions and discussion This study provides a better understanding of temperature measurement errors caused by the sensor, analog signal conditioning, and data acquisition system. The MMTS sensor and the HO-1088 sensor use the ratiometric method to eliminate voltage reference errors. However, the RSS errors in the MMTS sensor can reach 0.3–0.6 under temperatures beyond 2408 to 1408C. Only under yearly replacement of the MMTS thermistor with the calibrated MMTS readout can errors be constrained within 60.28C under the temperature range from 2408 to 1408C. Because the MMTS is a calibration-free device (National Weather Service 1983), testing of one or a few fixed resistors for the MMTS is unable to guarantee the nonlinear temperature relations of the MMTS thermistor. For the HO-1088 sensor, the self-heating error is quite serious and can make temperature 0.58C higher under 1 m s 21 airflow, which is slightly less than the actual normal ventilation rate in the ASOS shield (Lin et al. 2001a). The simple linear method for the PRT of the HO-1088 causes unacceptable errors that are more serious in the low temperature range. These findings are helpful for explaining the ASOS warm biases found by Kessler et al. (1993) in their climate data and Gall et al. (1992) in the climate data archives. For the dewpoint temperature measurements in the ASOS, such self-heating effects might be
1032
JOURNAL OF ATMOSPHERIC AND OCEANIC TECHNOLOGY
cancelled out by the chill mirror mechanism: heating or cooling the chill mirror body (conductively contains the dewpoint PRT inside) to reach an equilibrium thin dew layer–dewpoint temperature. Thus, in this case, the selfheating error for dewpoint temperature measurements might not be as large as the air temperature after correct calibration adjustment. Likewise, the relative humidity data from the ASOS network, derived from air temperature and dewpoint temperature, is likely be contaminated by the biased air temperature. Both resistance measurements in the HMP35C and USCRN PRT sensors are interrogated by the dataloggers. The HMP35C is delivered from Campbell Scientific, Inc., with recommended measurement methods. Even so, the HMP35C sensor in the AWS network can experience more than 0.28C errors in temperatures from 2308 to 1308C. Beyond this range, the RSS error increases from 0.48 to 1.08C due to thermistor interchangeability, polynomial error, and CR10X datalogger inaccuracy. For the USCRN PRT sensor in the USCRN network, the RSS errors can reach 0.28–0.348C due to the inaccuracy of CR23X datalogger, which suggests that the configuration of USCRN PRT and measurement taken in the CR23X could be improved if higher accuracy is needed. Since the USCRN network is a new setup, the current configuration of the USCRN PRT temperature sensor could be reconstructed for better measurements. This reconstruction should focus on the increase of signal sensitivity, the selection of fixed resistor(s) with smaller temperature coefficient of resistance, and the decrease of the self-heating power, so that it could be more compatible with the CR23X for longterm climate monitoring. These findings are applicable to the future of temperature data generated from the USCRN network and possible modification of the PRT sensor for higher quality measurements in the reference climate network. Acknowledgments. The authors wish to acknowledge the financial support provided by the National Climatic Data Center (NCDC) and the USCRN program for this study. We are thankful for the valuable reviews of this
VOLUME 21
manuscript by Dr. George E. Meyer in the Department of Biological Systems Engineering, University of Nebraska, and Dr. Tilden P. Meyers at the Atmospheric Turbulence and Diffusion Division of the NOAA/OAR/ Air Resources Laboratory. REFERENCES ASOS Program Office, 1992: Temperature/dewpoint sensor. Automated surface observing system site technical manual S100. AAI Systems Management, Inc. Fuchs, M., and C. B. Tanner, 1965: Radiation shields for air temperature thermometers. J. Appl. Meteor., 4, 544–547. Gall, R., K. Young, R. Schotland, and J. Schmitz, 1992: The recent maximum temperature anomalies in Tucson: Are they real or an instrument problem? J. Climate, 5, 657–665. Guttman, N. B., and C. B. Baker, 1996: Exploratory analysis of the difference between temperature observations recorded by ASOS and conventional methods. Bull. Amer. Meteor. Soc., 77, 2865– 2873. Hubbard, K. G., and X. Lin, 2002: Realtime data filtering models for air temperature measurements. Geophys. Res. Lett., 29, 1425, doi:10.1029/2001GL013191. ——, ——, and E. A. Walter-Shea, 2001: The effectiveness of the ASOS, MMTS, Gill, and CRS air temperature radiation shields. J. Atmos. Oceanic Technol., 18, 851–864. Kessler, R. W., L. F. Bosart, and R. S. Gaza, 1993: Recent maximum temperature anomalies at Albany, New York: Fact or fiction? Bull. Amer. Meteor. Soc., 74, 215–226. Lin, X., K. G. Hubbard, and G. E. Meyer, 2001a: Airflow characteristics of commonly used temperature radiation shields. J. Atmos. Oceanic Technol., 18, 329–339. ——, ——, and E. A. Walter-Shea, 2001b: Radiation loading model for evaluating air temperature errors with a non-aspirated radiation shield. Trans. ASAE, 44, 1299–1306. Nachtigal, C. L., 1990: Instrumentation and Control: Fundamentals and Applications. Wiley-Interscience, 890 pp. National Weather Service, 1983: Maximum/minimum temperature system operation instructions. National Weather Service Report, 5 pp. OMEGA Engineering, 1995: The Temperature Handbook. Vol. 29. OMEGA Engineering, Inc., 1494 pp. Quayle, R. G., D. R. Easterling, T. R. Karl, and P. Y. Hughes, 1991: Effects of recent thermometer changes in the Cooperative Station Network. Bull. Amer. Meteor. Soc., 72, 1718–1723. Steinhart, J. S., and S. R. Hart, 1968: Calibration curves for thermistors. Deep-Sea Res., 15, 497. Tanner, B. D., 1990: Automated weather stations. Remote Sens. Rev., 5, 73–98.