Proceedings of the ASME 2008 International Design Engineering Technical Conferences & Computers and Information in Engineering Conference IDETC/CIE 2008 August 3-6, 2008, Brooklyn, New York, USA
SENSOR SYSTEM SELECTION FOR PROGNOSTICS AND HEALTH MONITORING Shunfeng Cheng Prognostics and Health Management Lab
Michael Azarian Prognostics and Health Management Lab
Michael Pecht∗ Prognostics and Health Management Lab Center for Advanced Life Cycle Engineering (CALCE) University of Maryland, College Park, MD, 20742.
1 INTRODUCTION There are several available methods for prognostics and health monitoring (PHM) implementation in electronic products and systems, including monitoring and analysis of parameters that are precursors to impending failure, such as shifts in performance parameters; and utilization of exposure conditions (e.g., usage, temperature, vibration, radiation) combined with physics-of-failure (PoF) models to compute accumulated damage and assess remaining life [1][2]. In these approaches, the monitoring of parameters (conditions) is a fundamental step. In order to accurately assess the health and predict the remaining life of the product, monitoring may be needed during all stages of the product life cycle, including manufacturing, shipment, storage, handling and operation. Monitored parameters known as measurands may include temperature, vibration, shock, pressure, acoustic levels, strain, stress, voltage, current, humidity levels, contaminant concentration, usage frequency, usage severity, usage time, power, and heat dissipation. In each case, a variety of monitoring features may be required in order to obtain characteristics of these parameters, such as magnitude, variation, peak level, and rate of change. Sensor systems provide the means by which this information is acquired, processed, and stored.
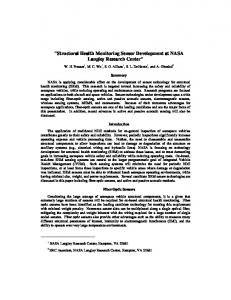
In this section, the considerations of sensor system selection for PHM applications are presented. Wired or Wireless Data Transmission
External Power
Internal Sensors External Sensor Modules
ABSTRACT Data collection is an essential part of prognostics and health monitoring, and often requires the use of sensor systems to measure environmental and operational parameters. In this paper, the considerations for sensor system selection for prognostics and health monitoring implementation are discussed and some state-of-the-art sensor systems for prognostics are described. Finally, emerging trends in sensor system technologies are presented.
Internal Power External Devices (e.g., PDAs, computers, cell phones)
Microprocessor (with analogto-digital converter)
Memory (data storage, embedded software)
Figure 1. Integrated Sensor System for In-situ Environmental Monitoring Figure 2 shows a general procedure for sensor system selection. The first step is to identify the application and the requirements for the sensor system. Then, sensor system candidates are identified and evaluated.
List the requirements for PHM sensor system
z z
z
Search the candidates z z
2 SENSOR SYSTEM SELECTION FOR PHM A PHM sensor system will typically have sensors, onboard analog to digital converters, onboard memory, embedded computational capabilities, data transmission, and a power source or supply, as shown in Figure 1. Every PHM sensor system will not necessarily contain all these elements, and not all sensor systems are suitable for the implementation of PHM. ∗
z
Considerations Parameters to be monitored Requirements for physical characteristics of PHM sensor system Requirements for the functional attributes of PHM sensor system Cost Reliability Availability
Make tradeoffs to select the optimal sensor system
Figure 2. Sensor System Selection Procedure The requirements of a sensor system for PHM depend on the specific application, but there are some common
Author of correspondence, Phone: (301) 405-5278, Email:
[email protected]
1
Copyright © 2008 by ASME
considerations. These include the parameters to be measured, the performance needs of the sensor system, the electrical and physical attributes of the sensor system, reliability, cost and availability. The user must prioritize these considerations. Tradeoffs may be necessary to select the optimal sensor system for the specific application.
vibration, and pressure. Structures that can realize multiple sensing include: a sensor system which contains several different sensing elements internally; a sensor system which has flexible, add-on external ports that support various sensor nodes which plug in; and combinations of these structures. For these structures, some common components can be shared such as the power supply, A/D converter, memory, and data transmission.
2.1 Parameters to Be Monitored The parameters which are to be monitored in a PHM implementation can be selected based on their relationship to functions that are crucial for safety, that are likely to be implicated in catastrophic failures, that are essential for mission completeness, or that can result in long downtimes. Selection is also based on knowledge of the critical parameters established by past experience and field failure data on similar products and by qualification testing. More systematic methods, such as failure mode, mechanisms, and effects analysis (FMMEA), can be used to determine parameters that need to be monitored [3].
2.2 Sensor System Performance The required performance of the sensor system should be considered during the analysis of the application. The relevant performance attributes include:
The parameters used as precursors and the parameters monitored for stress and damage modeling in the life cycle of the product have been discussed in detail [4][5][6]. Table 1 shows some examples of parameters that may be monitored by PHM application. These parameters can be measured by appropriate sensors. Table 1. Examples of Parameters for PHM Application Domain
Examples
Thermal
Temperature (ranges, cycles, gradients, ramp rates), heat flux, heat dissipation
Electrical
Voltage, current, resistance, inductance, capacitance, dielectric constant, charge, polarization, electric field, frequency, power, noise level, impedance
Mechanical
Length, area, volume, velocity or acceleration, mass flow, force, torque, stress, strain, density, stiffness, strength, angular, direction, pressure, and acoustic intensity or power, acoustic spectral distribution
Chemical
Chemical, species concentration, gradient, reactivity, mess, molecular weight
Humidity
Relative humidity, absolute humidity
Biological
pH, concentration of microorganisms
Optical (Radiate)
Intensity, phase, wavelength, polarization, reflectance, transmittance, refractive index, distance, vibration, amplitude and frequency
Magnetic
Magnetic field, flux density, magnetic moment, permeability, direction, distance, position, flow
z
Accuracy: the closeness of agreement between the measurement and the true value of the measured quantity;
z
Sensitivity: the variation of output with respect to a certain variation in input (slope of the calibration curve);
z
Precision: the number of significant digits to which a measurand can be reliably measured;
z
Resolution: the minimal change of the input necessary to produce a detectable change at the output;
z
Measurement range: the maximum and minimum value of the measurand that can be measured;
z
Repeatability: closeness of the agreement between the results of successive measurements of the same measurand carried out under the same conditions of measurement;
z
Linearity: the closeness of the calibration curve to a straight line corresponding to the theoretical behavior;
z
Uncertainty: the range of values which contain the true value of the measured quantity;
z
Response time: the time a sensor takes to react to a given input;
z
Stabilization time: the time a sensor takes to reach a steady state output upon exposure to a stable input.
2.3 Physical Attributes of Sensor Systems The physical attributes of sensor system include its size, weight, shape, packaging, and how the sensors are mounted to their environment. In some PHM applications, the size of the sensor may become the most significant selection criterion due to limitations of available space for attaching the sensor or due to the inaccessibility of locations to be sensed. Additionally, the weight of the sensor must be considered in certain PHM applications such as for mobile products or for vibration and shock measurements using accelerometers, since the added mass can change the system response. If a fixture is required to mount the sensor to a piece of equipment, the added mass of the sensor and fixture may change the system characteristics. When selecting a sensor system, users should determine the available size and weight capacity that can be handled by the host environment and then consider the entire size and weight of the sensor system, which includes the battery and other accessories such as antennas or cables.
biological molecule,
PHM requires integration of many different parameters to assess the health state and predict the remaining life of a product. If an individual sensor system can monitor multiple parameters, it will simplify PHM. Sensing of multiple parameters refers to one sensor system that can measure multiple types of parameters such as temperature, humidity,
For some applications, one must also consider the shape of the sensor system, such as round, rectangular or flat. Some
2
Copyright © 2008 by ASME
In its idle state, a sensor system consumes much less power than during active mode. Sleep mode consumes the lowest power. The tasks of power management are to track and model the incoming requests or signals to identify parts of the sensor system to activate, when it should switch between active state and idle state, how long the idle states will be maintained, when to switch to the sleep state, and when to wake up the system. For example, in continuous sensing, the sensing elements and memory are active, but if data transmission is not required, it can be put into sleep mode. Power management will wake up the data transmission circuit when it receives a request.
applications also have requirements for the sensor packaging materials, such as metal or plastic based on the application and the parameters to be sensed. The method for attaching or mounting the sensor should also be considered based on the application. Mounting methods include using glue, adhesive tape, magnets, or screws (bolts) to fix the sensor system to the host. Sensor systems which are embedded in components, such as temperature sensors in ICs, can help to save space and to improve performance. 2.4 Functional Attributes of Sensor Systems The electrical attributes of the sensor systems, which should be considered, include: onboard power and power management ability; onboard memory and memory management ability and programmable sampling rate and modes; the rate, distance, and security of data transmission of the sensor system; and the onboard data processing capability. Each of these attributes will be discussed below.
Onboard Memory and Memory Management Onboard memory is the memory contained within the sensor system. It can be used to store collected data as well as information pertaining to the sensor system (e.g., sensor identity, battery status), which enables it to be recognized and to communicate with other systems. Firmware (embedded algorithms) in memory provides operating instructions to the microprocessor and enables it to process the data in real time. Onboard memory allows much higher data sampling and save rates. If there is no onboard memory, the data must be transmitted.
Onboard Power and Power Management Power consumption is an essential characteristic of a sensor system that determines how long it can function without connection to an external source of power. It is therefore particularly relevant to wireless and mobile systems. In order to attain the required duration of operation in such applications, a sensor system must have sufficient power supply and the ability to manage the power consumption.
For sensor systems, common onboard memory types include EEPROM (Electrically Erasable Programmable Read-Only Memory) and NVRAM (Non-volatile random access memory). EEPROM is a user-modifiable ROM that can be erased and reprogrammed (written to) repeatedly. In sensor systems, EEPROM is often used to store the sensor information. NVRAM is the general name used to describe any type of random access memory which does not lose its information when power is turned off. NVRAM is a subgroup of the more general class of non-volatile memory types, the difference being that NVRAM devices offer random access, as opposed to sequential access like hard disks.
Sensor systems can be divided into two main categories with respect to their power sources: non-battery powered sensor systems and battery powered sensor systems. Non-battery powered sensor systems are typically either wired to an external AC power source or use power from an integrated host system. For example, temperature sensors are often integrated within the microprocessors on motherboards inside computers and utilize the computer’s power supply. Battery powered sensor systems are equipped with an onboard battery. No interaction is required with the outside world, so they are able to function autonomously on a continuous basis. Replaceable or rechargeable batteries are preferable for battery-powered sensor systems. Batteries that are replaceable or rechargeable allow the sensor system to operate continuously, without needing to replace the entire system. Rechargeable lithium-ion batteries are commonly used in battery-powered sensor systems. In some situations, the battery must be sealed inside the sensor packaging or is inaccessible. The use of larger batteries or stand-by batteries may be required in such applications.
The best-known form of NVRAM memory today is flash memory, which is found in a wide variety of consumer electronics, including memory cards, digital music players, digital cameras and cell phones. In sensor systems, flash memory is used to record the collected data. Continued development of semiconductor manufacturing technology has allowed the capacity of flash memory to increase even as size and cost decrease. Memory requirements are affected by the sensing modes and sampling rate. Sensor systems should allow the user to program the sampling rate and set the sensing mode (i.e., continuous, triggered, thresholds). These settings affect the amount of the data stored into memory.
Power management is used to optimize the power consumption of the sensor system in order to extend its operating time. Power consumption varies for different operational modes of the system (e.g. active mode, idle mode and sleep mode). The sensor is in active mode when it is being used to monitor, record, transmit, or analyze the data. The power consumed for sensing varies depending on the parameter sensing methods and sampling rate. Continuous sensing will consume more power, while periodic or event triggered sensing can consume less power. A higher sampling rate will consume more power because it senses and records data more frequently. Additionally, wireless data transmission and onboard signal processing will consume more power.
Memory management allows one to configure, allocate, monitor and optimize the utilization of memory. For multiplesensing sensor systems, the data format will often depend on the sensing variable. Memory management should be able to distinguish various data formats and save them into corresponding areas of the memory. For example, the sampling rate, the time stamp and the data range of temperature are different from those of vibration data. In memory, these different data may be stored separately based on algorithms that make them easy to identify. Memory management also should have the ability to show the usage
3
Copyright © 2008 by ASME
speeds, it will consume much more power. The other constraint is onboard memory capacity. Running complex software requires a lot of memory. These two constraints make it challenging to embed complex algorithms into onboard processors. However, even using simple algorithms and routines to process the raw sensor data significant gains can be achieved for in-situ analysis.
status of the memory, such as the percentage of available memory, and give an indication when the memory becoming full. Programmable Sampling Mode and Sampling Rate The sampling mode determines how the sensor monitors parameters and at what times it will actively sample the measurand. Commonly used sampling modes include continuous, periodic and event triggered sampling. The sampling rate defines the number of samples per second (or other unit) taken from a continuous signal to make a discrete signal. The combination of sampling mode and rate controls the sampling of signal.
Fast and Convenient Data Transmission Once data is collected by the sensor system, it is typically transmitted to a base station or computer for post-analysis. In general, the methods for data transmission are either wireless or wired. Wireless monitoring has emerged as a promising technology that can impact PHM applications. Wireless transmission refers to the transmission of data over a distance without the use of a hard wired connection. The distances involved may be short (a few meters, as in a television remote control) or very long (thousands or even millions of kilometers for radio communications). Wireless sensor nodes can be used to remotely monitor inhospitable and toxic environments. In some applications, sensor(s) must operate remotely with data stored and downloaded by telemetry to a centrally located processing station. Also, wireless sensor systems are not dependent on extensive lengths of wires for the transfer of sensor measurement data, thus saving installation and maintenance costs. The advantage of wireless sensor nodes can be greatly enhanced by embedding micro-controllers with the sensor nodes to improve the data analysis capabilities within the wireless sensing nodes themselves.
Programmable sampling modes and rates are preferred for PHM applications, since these features affect diagnostics and prognostics power consumption and memory requirements directly. For a fixed sampling rate, periodic and event triggered sampling will consume less power and memory than continuous sampling. Under the same sampling mode, a low sampling rate consumes less power and memory than a high sampling rate. But too low sampling rate may lead to signal distortion and may reduce the likelihood of capturing intermittent or transient events, needed for fault detection. Additionally, if the user wants to utilize a sensor, for example, to monitor vibration and temperature at the same time, the sensor system should allow the user to set the sampling mode and rate for these two different types of parameters individually. Signal Processing Software Signal processing consists of two parts: one is embedded processing which is integrated into the onboard processor to enable immediate and localized processing of the raw sensor data; the other is processing conducted in the host computer. When selecting sensor systems, one should consider both of these functions.
Methods of wireless data transmission include Ethernet, cellular, Radio Frequency Identification (RFID), vicinity cards (ISO 15693), personal area network (IEEE 802.15), Wi-Fi (IEEE 802.11), and proprietary communications protocols. When selecting which type of wireless data technology to use for a particular application, one should consider the range of communication, power demand, ease of implementation, and data security.
Onboard processing can significantly reduce the number of data points and thus free up memory for more data storage. This in turn reduces the volume of data which must be transmitted out to a base station or computer, and hence results in lower power consumption. In the case of a large number of sensor systems working in a network, this would allow decentralization of computational power and facilitate efficient parallel processing of data.
Radio Frequency Identification (RFID) is an automatic identification method, relying on storing and remotely retrieving data using devices called RFID tags or transponders. An RFID tag is an object that can be attached to or incorporated into a product, animal, or person for the purpose of identification using radio waves. An RFID sensor system combines the RFID tag with the sensing element. It uses sensing elements to detect and record temperature, humidity, movement or even radiation data. It utilizes RFID to record and identify the sensor, as well as to transfer the raw data or processed data. For example, the same tags used to track items, such as meat, moving through the supply chain may also alert staff if it is not stored at the right temperature, or if meat has gone bad or if someone has injected a biological agent into the meat.
Embedding computational power with onboard processors can also facilitate efficient data analysis for environmental monitoring applications. Embedded computations can be set to provide real time updates for taking immediate action such as powering off the equipment to avoid accidents or catastrophic failures, and also for providing prognostic horizons for conducting future repair and maintenance activities. Currently, onboard signal processing includes feature extraction (e.g., rainflow cycle counting algorithm), data compression, and fault recognition and prediction. Ideally it should display its calculation results and execute actions when a fault is detected, and should be programmable.
The transfer range and speed of an RFID tag depend on many factors, such as the frequency of operation, the power of the reader, interference from other RF devices and so on. RFID tags and readers have to be tuned to a common frequency to communicate. RFID systems use many different frequencies, but the most common are low-frequency (around 125 KHz), high-frequency (13.56 MHz) and ultra-high-frequency or UHF (860-960 MHz). Microwave (2.45 GHz) is also used in some
The abilities of the onboard processor are limited by some physical constraints. One constraint is the available power. If processing requires extended calculation and high calculating
4
Copyright © 2008 by ASME
2.6 Reliability Sensor systems for PHM should be reliable. Sensor systems are generally limited to some degree by noise and the surrounding environment, which vary with operating and environmental conditions. To reduce the risk of sensor system failure, the user must consider the sensor’s environmental and operating range and determine if that is suitable for the particular application. The packaging of the sensor system should also be considered, as it can shield the unit from unwanted effects such as humidity, sand, aggressive chemicals, mechanical forces, and other environmental conditions [9].
applications. Different frequencies have different characteristics that make them more useful for certain applications. For instance, low-frequency tags use less power and are better able to penetrate non-metallic substances. They are ideal for scanning objects with high-water content, such as fruit, but their read range is limited to less than a foot (0.33 meter). High-frequency tags work better on objects made of metal. They have a maximum read range of about three feet (1 meter). UHF frequencies typically offer better range (3 to 8 meters) and can transfer data faster than low- and highfrequencies. But they use more power and are less likely to pass through materials. And because they tend to be more directed, they require a clear path between the tag and reader. UHF tags might be better for scanning boxes of goods as they pass through a dock door into a warehouse. If longer ranges are needed, such as for tracking railway cars, active tags can use batteries to boost read ranges to 300 feet (100 meters) or more.
Sensor validation is used to assess the integrity of the sensor system and adjust or correct it as appropriate. This functionality checks the sensor performance and ensures that the sensor system is working correctly by detecting and eliminating the influence of systematic errors. Self-diagnostics, self-calibration, and sensor fusion are a few methods that can be applied to achieve this functionality.
The security of wireless data transmission is another important factor to be considered. There are a great number of security risks associated with the current wireless protocols and encryption methods. For example, current radio frequency identification (RFID) technology and its implementation have some possible security leaks to be exploited. RFID tags and readers/writers, transmit identifying information via radio signals. Unlike bar coding systems, RFID devices can communicate without requiring a line of sight and over longer distances for faster batch processing of inventory. As RFID devices are deployed in more sophisticated applications, concerns have been raised about protecting such systems against eavesdropping and unauthorized uses [7]. One should evaluate the security strategy of the wireless sensor system, or customize the security level to protect the data during transmission.
Another strategy to improve the reliability of sensor systems is to use multiple sensors (redundancy) to monitor the same product or system. By using multiple sensor systems, the risk of losing data due to sensor system failure is reduced. While it is essential to consider the reliability of sensor systems, it is equally necessary to consider the effects of the sensor system on the reliability of the product it is intended to monitor. Sensor systems that are heavy may reduce the reliability of circuit boards when attached to the surface over time. In addition, the method of attachment (soldering, glue, screws) can reduce the reliability of the product if the attachment material is incompatible with product’s materials of construction. 2.7 Availability The selected sensor systems should be available. Generally, two aspects should be considered when determine the availability. First, a user should determine whether the sensor system is commercially available. This means that the sensor system has been moved from its development phase into production and is being sold on the market. There are many sensor systems which are advertised and promoted in publications and websites, which are not commercially available. These sensor systems are generally prototypes and are not available for purchase on the open market.
Currently, wired data transmission can offer high speed transmission, but it is limited by the need for transmission wires. Wireless transmission can offer very convenient data communication, eliminating the need for a wire, but the transmission rate is lower than that for wired transmission. This requires some trade-offs to be made for a given application. Many sensor systems transfer data from a sensor to a receiving device wirelessly, and then transfer the data to computer by wired connection with USB port. This arrangement can represent a compromise that improves data through put, power requirements, and cost.
Second, a user should look at the supplier of the sensor system. Depending on the particular needs and application, a user may be required to select a sensor system from a domestic supplier due to security reasons. This information is typically not found in product datasheets, but can be verified through communications with the supplier.
2.5 Cost The selection of the proper sensor system for a given PHM application must include an evaluation of the costs. The cost evaluation should address its total cost of ownership, including the purchase, maintenance, and replacement of sensor systems. In fact, initial purchase costs can be less than 20% of the product’s lifetime costs. Consider the experience of an airline who went with “an affordable” choice only to find out 15 months later that the sensors were surviving for only 12 months on average and needed to be replaced annually. The replacement sensor system selected did cost 20% more but was available off-the-shelf and was previously qualified for aircraft use [8].
3 STATE-OF-THE-ART OF SENSOR SYSTEMS FOR PHM IMPLEMENTATION A survey was conducted to determine the commercial availability of sensor systems that can be used in PHM for electronic products and systems. The search only included commercially-available sensor systems having features desired by PHM. The survey results show the characteristics of 16 sensor systems from 10 manufacturers. The sensor system
5
Copyright © 2008 by ASME
requirements and increased battery life. Test chips made on the ultra-low power 65nm process technology have shown transistor leakage reduction roughly 1000 times from standard process. [11]. This technology allows to produce very lowpower chip for laptops and small-form factor devices.
characteristics include the sensing parameters, power supply and power management ability, sample rate, onboard memory, data transmission method, availability of embedded signal processing software, size, weight, and cost. The data for each sensor system was collected from the manufacturer’s website and product datasheets, e-mails, and evaluations of demo products.
Another example of ultra-low power electronics is the modern pacemaker. A modern pacemaker consumes between 10 and 40 microwatts from its internal cell. Taken together, one million pacemakers consume less than half the power of a common 40-Watt household incandescent light bulb. Pacemakers remain implanted, regulating the patient’s cardiac rhythm, 24 hours a day, seven days per week, for seven years or more on a single pacemaker power source [12].
Key findings from the survey are that state-of-the-art prognostic sensor systems: 1) can autonomously perform multiple functions using their own power management, data storage, signal processing, and wireless data transmission; 2) have multiple, flexible or add-on sensor ports that support various sensor nodes to monitor various parameters such as temperature, humidity, vibration, and pressure; 3) have onboard power supplies, such as rechargeable or replaceable batteries; 4) have onboard power management, allowing control of operation modes (active, idle and sleep), and programmable sampling modes (continuous, triggered or threshold) and rate. These management strategies, combined with low power consumption circuitry and novel battery technologies, enable the sensor system to operate longer;5) have diverse onboard data storage capacity (flash memory), from several KB to hundreds of MB; 6) have embedded signal processing algorithms, which enable data compression or simplification prior to data transfer.
Energy harvesting technology is a process to extract energy from the ambient or from a surrounding system and convert it to usable electrical energy. Some large-scale energy harvesting schemes, such as wind turbines and solar cells, have made the transition from research to commercial products. The interest in small-scale energy harvesting for embedded sensor systems, such as implanted medical sensors, and sensors on aerospace structures, is increasing. Current energy harvesting sources include sunlight, thermal gradient, human motion, body heat, wind, vibration, radio power and magnetic coupling. Several basic effects used in energy harvesting include electromagnetic, piezoelectric, electrostatic, and thermoelectric effects. For example, the mechanical vibration in the device or ambient can be converted into electric energy by piezoelectric material or electromagnetic induction. Piezoelectric materials form transducers that are able to interchange electrical energy and mechanical vibration or force. The electromagnetic induction systems are composed of a coil and a permanent magnet attached to a spring. The mechanical movement of the magnet, which is caused by device or ambient vibration, induces a voltage at the coil terminal and this energy can be delivered to an electrical load. The thermal energy is often converted into electric energy by the thermoelectric generators (TEGs). With the recent advances made in nanotechnologies, the fabrication of MEMS-scale TEG devices have been actively studied. The combined use of several energy harvesting sources in the same device can increase the harvesting capabilities in different situations and applications, and can minimize the gap between the required and harvested energy [13].
4 EMERGING TRENDS IN SENSOR TECHNOLOGY FOR PHM In general, sensor technology is headed towards extreme miniaturization, wireless networks, ultra-low power consumption, and battery-free power. Since electronic components and systems continue to decrease in size, sensors to monitor their environment and operation will also become smaller and weigh less in order to be integrated. As MEMS (Micro Electro Mechanical Systems) or NEMS (Nano Electro Mechanical Systems) and smart material technologies mature, MEMS sensor or nanosensor will integrate the sensing element, amplification, analog-to-digital converter and memory cells into a micro-chip. The fabrication of MEMS and NEMS will offer significant advantages or integration with electronics, fabrication of arrays of sensors, small size of individual devices, low-power consumption and lower costs [10]. With the development of new materials and energy technologies, battery-free sensor systems are being considered, especially for use in embedded, remote and other inaccessible monitoring conditions. Battery-free sensor systems will be developed based on ultra low-power electronics and the energy harvesting technologies.
Distributed sensor networks (DSNs) consist of multiple sensor nodes that are capable of communicating with each other and collaborating on a common sensing goal. The advantage of DSNs is that it allows data from multiple sensors to be combined or fused to obtain inferences that may not be possible from a single sensor. This is referred to as multisensor data fusion. The sensor nodes in a DSN are organized into a cooperative system. The nodes can communicate with each other and have the ability to self-organize.
Ultra low-power electronics enable future sensor systems consume much lower power. In 2005, Intel Corporation was developing an ultra-low power derivative of its highperformance 65 nanometer (nm) logic manufacturing process. Intel made several modifications to the design of the transistor. Lost electricity leaking from these microscopic transistors, even when they are in their “off ” state, is a problem that is a challenge for the entire industry. The modifications will result in significant reductions in the three major sources of transistor leakage: sub-threshold leakage, junction leakage and gate oxide leakage, which translates into lower power
The development of wireless transmission technology will realize long-distance, high transmission-rate, and more-secure data communication for future sensor systems [14]. Furthermore, future smart sensor nodes will be highly intelligent, with more functions than today’s. They will have built-in diagnostics and prognostics capabilities, which will make the entire wireless sensor network more functional.
6
Copyright © 2008 by ASME
5 CONCLUSIONS For a specific PHM application, the user may need to consider some or all of the factors including the parameters to be measured, the performance needs of the sensor system, the electrical and physical attributes of the sensor system, reliability, cost and availability. The user needs a checklist of all the considerations which may enter into the selection process for a sensor system. The user also needs to prioritize the considerations. Some tradeoffs may then be necessary to select the optimal sensor system for the specific application. From the survey of the current commercial available sensor systems, the state-of-the-art of the sensor system is identified. Many sensor systems have multiple functions, such as multiple sensing abilities, onboard power and power management ability, onboard memory and management ability, wireless data transmission, and the onboard data processing ability. In the future, the sensor system will trend to extreme miniaturization, wireless networks, ultra-low power consumption, and battery-free power. 6
[5] Smith, P., Campbell, D., “Practical Implementation of BICS for Safety-Critical Applications,” Proceedings of IEEE International Workshop on Current and Defect Based Testing-DBT, pp. 51-56, April 2000. [6] Ramakrishnan, A., Pecht, M., “A Life Consumption Monitoring Methodology for Electronic Systems,” IEEE Transactions on Components and Packaging Technologies, Vol. 26, No. 3, pp. 625-634, 2003. [7] Karygiannis, T., Eydt, B., Barber, G., Bunn, L., and Phillips, T., Guidelines for Securing Radio Frequency Identification (RFID) Systems, NIST Special Publication 800-98, National Institute of Standards and Technology, Gaithersburg, April 2007. [8] SpaceAge Control, “Sensor Total Cost of Ownership,” Online White paper, http://www.spaceagecontrol.com /s054a.htm, accessed on December 30, 2007. [9] Claes, W., Sansen, W., and Puers, R., Design of Wireless Autonomous Datalogger ICs, Springer, Dordrecht, The Netherlands, 2005.
REFERENCES
[1] Vichare, N. and Pecht, M., “Prognostics and Health Management of Electronics,” IEEE Transactions on Components and Packaging Technologies, Vol.29, No.1, pp.222-229, March 2006.
[10] Metras, H., “Trends in Wireless Sensors: Potential Contributions of Nanotechnologies and Smart Systems Integration Issues,” 2006 IST Conference, Helsinki, Japan, November 2006.
[2] Pecht, M., Prognostics and Health Management of Electronics, Wiley-Interscience, pp.25-46, August 2008.
[11] “Intel’s New Ultra-Low Power Manufacturing Process Will Stretch Battery Life”, Technology@Intel Magazine, pp1-4, Oct. 2005.
[3] Ganesan, S., Eveloy, V., Das, D., Pecht, M., “Identification and Utilization of Failure Mechanisms to Enhance FMEA and FMECA,” Proceedings of the IEEE Workshop on Accelerated Stress Testing and Reliability (ASTR), Austin, Texas, October 3-5, 2005.
[12] Zarlink Semiconductor Inc., “How Low is Ultra Low?,” http://ulp.zarlink.com/how_low.htm, last accessed on January 7, 2008. [13] Mateu, L., and Moll, F., “Review of Energy Harvesting Techniques and Applications for Microelectronics,” Proc. of SPIE, 5837, pp.359-373, 2005.
[4] Pecht, M., Radojcic, R., Rao, G., Guidebook for Managing Silicon Chip Reliability, CRC Press, Boca Raton, FL, 1999.
[14] Betts, B., “Smart Sensors,” IEEE Spectrum Magazine, Vol. 43, No. 4, April 2006.
7
Copyright © 2008 by ASME