PROCEEDINGS OF THE 52st ANNUAL INTERNATIONAL SCIENTIFIC CONFERENCE OF RIGA TECHNICAL UNIVERSITY SECTION „POWER AND ELECTRICAL ENGINEERING”, OCTOBER 2011 Electrical Machines and Apparatus / Elektriskās mašīnas un aparāti
Sensorless Detection of Induction Motor Rotor Faults Using the Clarke Vector Approach Toomas Vaimann (Engineer, Tallinn University of Technology), Ants Kallaste (Researcher, TUT), Aleksander Kilk (Associate professor, TUT) Abstract – Due to their rugged build, simplicity and cost effective performance, induction motors are used in a vast number of industries, where they play a significant role in responsible operations, where faults and downtimes are either not desirable or even unthinkable. As different faults can affect the performance of the induction motors, among them broken rotor bars, it is important to have a certain condition monitoring or diagnostic system that is guarding the state of the motor. This paper deals with induction motor broken rotor bars detection, using Clarke vector approach.
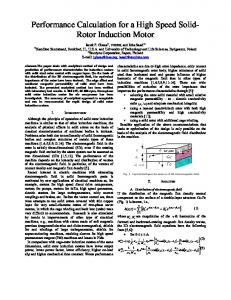
harmonic components, development of inverse magnetic field, torque pulsation, unbalanced magnetic pull etc. All these phenomena are undesired because they decrease the reliability of the induction motor and the whole drive. [4] Some examples of broken rotor bars are shown on Figs. 1 and 2.
Keywords – Clarke transformation, diagnostics, electric machines, induction machines, rotor faults.
I. INTRODUCTION Among electric motors, induction motors are the most used both in home appliances and in various industries. The simplicity and ruggedness of squirrel-cage induction motor make it by far the most commonly used type of electric motor. This is also the reason why they are very often used in critical duty drives where a sudden failure can cause inadmissible safety risks and economic expenses. Different failures can occur in electrical drives and one of the most common faults is the broken rotor bars. The majority of all stator and rotor faults are caused by a combination of various stresses, which can be thermal, electromagnetic, residual, dynamic, mechanical or environmental [1]. Some of the reasons that can lead to cracking or broken rotor bars are as follows: 1) Thermal stress due to over-load, non-uniform heat distribution, hot spot and arc. 2) Magnetic stresses due to electromagnetic forces, magnetic asymmetry forces, noises and electromagnetic vibrations. 3) Residual stress from the fabrication process. 4) Dynamic stress due to rotor axial torque and centrifugal forces. 5) Circumferential stress due to wearing and pollution of rotor material by chemical materials and humidity. 6) Mechanical stress due to mechanical fatigue of different parts, bearing damage, loosened laminations etc. [2] However, the induction motor rotor faults usually start from a small fracture or a high resistivity spot in the rotor bar [3]. When a fault like this increases the magnetic field becomes more and more asymmetrical due to the lack of induced currents in faulty rotor bars. This leads to local saturation in stator and rotor teeth near broken bars and unproportional distribution of magnetic field in the air gap. It can trigger several electromagnetic phenomena like increase of higher
Fig. 1. Defective casting of a rotor bar of an induction machine [3].
Fig. 2. Broken rotor bars due to heavy duty operation [5].
Not only the number of the broken bars is important, but their position in the rotor cage has a very big role as well. As calculations have shown, the worst case of asymmetry is, when faulty bars are concentrated close together one by one under the same magnetic pole. Researches have verified that such case is also most probable in practice, because the increase of current is the highest in the bars near the broken one and so under highest thermal stress. When the same number of broken bars is situated under different poles the asymmetry is less expected. [4] Asymmetry of rotor cage winding due to some broken or cracked bars represents a significant part among several possible faults and must be detailed, considered and taken into account [6]. Another phenomenon that cannot be looked over is the induced rotor current.
PROCEEDINGS OF THE 52st ANNUAL INTERNATIONAL SCIENTIFIC CONFERENCE OF RIGA TECHNICAL UNIVERSITY SECTION „POWER AND ELECTRICAL ENGINEERING”, OCTOBER 2011 Electrical Machines and Apparatus / Elektriskās mašīnas un aparāti
Resistance of broken bars is very high in comparison with the value of healthy rotor bars. This is very likely to cause unproportional distribution of rotor currents. Parts of the rotor currents, which are not able to flow in broken bars due to the high resistance, are flowing in bars, situated next to the broken ones. This leads to the increase of the current value in those bars. Although the currents of broken bars are flowing in adjacent bars, the entire sum of rotor currents is lower than in the case of healthy rotor. Too high current density leads to overheating in these bars and the fault propagates until the rotor cage is destroyed [4]. The biggest problem of those faults is that it is often not worth or possible to repair the rotor. However all of this can be avoided, when the motor is supervised by an appropriate condition monitoring or diagnostic system. II. DIAGNOSTIC METHODS For a long time, different indicators, such as current, temperature, voltage, chemical debris and vibration, have been in use for monitoring electrical machines [7]. With time different diagnostic methods have been evolving, more artificial intelligence and computing power have been used to perform the necessary procedures. The biggest advantage that sensorless diagnostic of induction motors provides is that testing and diagnostics can be done without any disturbances to the motor’s normal working cycle. It means that in case of motors which are used in critical duty drives or perform on high risk conditions, no additional changes have to be made in order to perform the tests. The traditional technique for this purpose is based on the fast Fourier transform. This technique has some drawbacks, which are tackled in the present investigation by using wavelet transform and fuzzy logic. [7] Other methods include analysis of magnetic fields using the finite element method, monitoring current amplitude vector oscillation and so on. One of the possible diagnostic methods is the so called Clarke (or Park) vector approach or Clarke transformation. It is a quite simple procedure that can be used for motor condition monitoring and making decision upon its state.
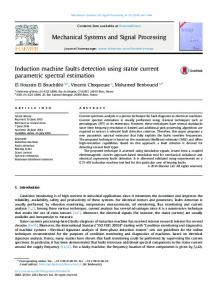
Fig. 3. Stator current Clarke vector pattern [10].
The healthy pattern differs slightly from the expected circular one, because supply voltage is generally not exactly sinusoidal [11]. Pattern of the rotor with broken bars is however more like an ellipse shaped one [12]. Exactly the same transformation can be used to transform the three-phase voltage into a two-dimensional system. This gives the opportunity to monitor the stator voltage as well as current and make the decisions upon the analyses of the obtained graphs. III. EXPERIMENTAL SETUP AND MEASUREMENTS Technical data of the tested induction motor used in the experimental setup (Fig. 4): Un = 177 V In = 14.8 A nn = 1456 rpm Tn = 20 Nm f = 50 Hz cosφ = 0.785
A. Clarke Vector Approach Clarke transformation is an easy way to decide if the motor is healthy or not [8]. It means that the phase currents (ia, ib, ic) are to be transformed into current alpha and beta components (iα, iβ) and placed on d-axis and q-axis respectively. In other words, transforming a three-dimensional system into a twodimensional one:
iα = ia . = 2 3 ( ib + ic ) iβ
(1)
Its representation is a circular pattern centered at the origin of the coordinates (Fig. 3). This is a very simple reference figure, which allows the detection of an abnormal condition due to any fault of the machine by observing the deviations of the acquired picture from the reference pattern [9].
Fig. 4. Experimental setup for motor testing.
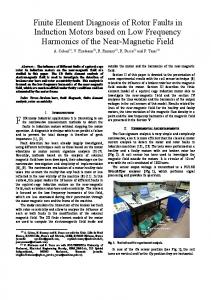
Two different motor states were used for the measurements. First series of measurements were done with a healthy rotor and the second series with a faulty rotor, containing seven broken bars, situated under the same magnetic pole next to each other (Fig. 5). Thus, the measurements provided two sets of results: one healthy set and one set with a faulty rotor in a very bad shape.
PROCEEDINGS OF THE 52st ANNUAL INTERNATIONAL SCIENTIFIC CONFERENCE OF RIGA TECHNICAL UNIVERSITY SECTION „POWER AND ELECTRICAL ENGINEERING”, OCTOBER 2011 Electrical Machines and Apparatus / Elektriskās mašīnas un aparāti
Fig. 5. Magnetic field distribution in the cross section of a 3 kW induction motor at nominal load operating condition: left – healthy rotor cage, right – faulty rotor cage with seven broken bars (shaded) [13]
To apply torque to the motor, an electromagnetic brake was used. As the nominal moment of the motor is 20 Nm and the length of the handle of the magnetic brake is 0.5 m, the measurements were taken from 0-40 N, when measured by the force sensor at the furthest point of the handle from the motor. The measurements were performed in two different series. In the first, a healthy rotor and in the second, a rotor with seven broken bars was used. During all these tests four different values were measured: Ua – first phase voltage, Ub – second phase voltage, ia – first phase current, ib – second phase current. Measurements were done while applying different torques. Torque values were chosen so that the torque would rise step by step: starting from no load operation, continuing with 5; 10; 15 and ending at 20 Nm, being the nominal torque of the motor. Also all measurements were performed in two different time bases (10 and 100 ms). Two different time bases were chosen in order to have more data before starting the analysis. This gave the opportunity to make the transforms in that time base, which is visually more traceable. A four-channel digital oscilloscope was used to obtain the oscillations of current and voltage at all the values mentioned before and results were saved as MATLAB files. IV. ANALYSIS To perform analysis on the data received from the measurements, MATLAB software was used. This makes it very simple to perform Clarke transformation on the gained data. It should be taken into account however, that the supply voltage during those tests was not exactly sinusoidal, which affects the graphs and can result in some unexpected curves, peaks and deviations in the resulting figures. But as different loads, voltage and current, as well as both healthy and faulty motor conditions are observed, can those deviations due to non-ideal sine wave be discarded at the moment. At the first two figures (Figs. 6 and 7) Clarke vector pattern of the stator current can be seen. It should be noted that these graphs have been plotted with the motor running with no torque applied to the rotor.
Fig. 6. Stator current Clarke vector pattern of healthy motor with 0 Nm of torque applied.
Fig. 7. Stator current Clarke vector pattern of faulty motor with 0 Nm of torque applied.
As seen in these graphs, the healthy motor figure is indeed in a more or less circular shape and the faulty one more close to an ellipse as referred to in the literature concerning this method. In addition, it was found that the absolute value of current is higher in the figure of the faulty motor. The next graphs (Figs. 8 and 9) are plotted using the Clarke transformation on stator voltage at the same time moment as the current data was gathered.
Fig. 8. Stator voltage Clarke vector pattern of healthy motor with 0 Nm of torque applied.
PROCEEDINGS OF THE 52st ANNUAL INTERNATIONAL SCIENTIFIC CONFERENCE OF RIGA TECHNICAL UNIVERSITY SECTION „POWER AND ELECTRICAL ENGINEERING”, OCTOBER 2011 Electrical Machines and Apparatus / Elektriskās mašīnas un aparāti
Fig. 9. Stator voltage Clarke vector pattern of faulty motor with 0 Nm of torque applied.
Fig. 12. Stator voltage Clarke vector pattern of healthy motor with 20 Nm of torque applied.
From these graphs it can be seen that in case of voltage the healthy motor pattern looks again more as a circle and in case of faulty motor more like an ellipse. However changes in scale are more drastic and better traceable in case of the voltage graphs. Next graphs (Figs. 10, 11, 12 and 13) are plotted when the motor is running on its nominal torque, meaning that 20 Nm of torque is applied to the rotor.
Fig. 13. Stator voltage Clarke vector pattern of faulty motor with 20 Nm of torque applied.
Fig. 10. Stator current Clarke vector pattern of healthy motor with 20 Nm of torque applied.
Fig. 11. Stator current Clarke vector pattern of faulty motor with 20 Nm of torque applied.
As seen from the graphs of nominal load operation, faulty case of the motor is traceable in both current and voltage cases. Clarke vector pattern in the healthy cases is drawn in more or less as a circle, whereas graphs turn ellipsoidal, when the faulty case with seven broken rotor bars is viewed. As in no load situation, again the voltage Clarke vector pattern has a more severe change. As more torque has been applied to the rotor, the current amplitude rises. It can be seen when both healthy and faulty state graphs of no load and nominal load situations are compared to each other. More importantly, as load does not affect the voltage pattern and the supply voltage is held constantly at a 177 V margin, it gives the opportunity to set a hypothesis that broken rotor bars in three-phase squirrel-cage induction motors are more traceable, when voltage Clarke vector pattern is viewed. When no load situation and nominal load situation are compared, it can be seen that they match in a very large amount, which means that most of the changes in the patterns are due to the voltage unbalance caused by the seven broken rotor bars in the induction motor and not any other deviations in the grid or other variables. When diagnostics via the comparison of induction performance models is desired, the described method could be
PROCEEDINGS OF THE 52st ANNUAL INTERNATIONAL SCIENTIFIC CONFERENCE OF RIGA TECHNICAL UNIVERSITY SECTION „POWER AND ELECTRICAL ENGINEERING”, OCTOBER 2011 Electrical Machines and Apparatus / Elektriskās mašīnas un aparāti
used in a sufficiently effective way to decide upon the state of the motor. It could prove to be a very good way for performing diagnostics also in the sense that no disturbance in the working cycle of the motor is needed in order to perform the needed measurements and analysis. V. CONCLUSION All the measurements and analyses were done in laboratory conditions but it should be taken into account that the voltage supply during the measurements was not ideal in view that it was not perfectly sinusoidal. This provides an explanation to the figures that appear not exactly the same as in the literature describing the methods and not always quite the same as expected. Non-ideal sine waves have an effect on the outcomes of the current figures and some unexpected peaks and curves in the graphs. This is also one of the reasons why condition monitoring and induction motor diagnostics might become difficult when traditional methods, such as fast Fourier transform are used. It is difficult to differentiate fault conditions from the normal operating conditions of the motor using for example fast Fourier transform, due to variability of properties of the non-stationary motor current signal. It is essential to know the characteristics of the tested motor under normal operating conditions, as well as the peculiarities of the local grid where the motor is being tested. Another drawback of this kind of diagnosis is that the computational power required for the analysis is rather large. Without appropriate knowledge and software it is not possible to make all the transformations and graphs so easily. Clarke vector approach can be a good indicator for the condition of the tested motor. Its biggest drawback is that the amount information that can be obtained from the plotted vector pattern is not very large when compared to fast Fourier transform. Also when current is being observed, some of the changes in the graphs are again resulting of the not exactly sinusoidal supply voltage as well as the load of the motor at the moment of testing. However when voltage is used as the variable in the Clarke vector approach for induction motor diagnostics, a large amount of these problems seems to fade away. Voltage is not affected by the load of the motor. In the same way the not ideally sinusoidal supply voltage has not so important influence as well. When cases of no load and nominal load with both healthy and faulty motor conditions is observed, it can be seen that the figures in both load situations are almost identical, which allows to make the conclusion that changes in the vector patterns are the effects of the seven broken rotor bars in the faulty motor case. This could prove to be a powerful tool for diagnostics when the comparison of the performance models of the induction motor is performed. The needed information is the model or figure of the healthy case of the motor, which would also be the master model, with which the other graphs would be compared to. These tests and analysis that are presented in this paper are based on the measurements performed on a healthy motor and
a motor in a very bad shape. For future tests it is necessary to analyze similar diagnostic possibilities on motors with smaller faults as well. This would show if such diagnosis is relevant in cases not as severe as described here. The most important benefit of such diagnostic is that online monitoring makes the detection of a fault easy. If all the procedures are done correctly, then the faults will appear on the graphs. Also, when the drive is monitored, the faults of the rotor will be detected on an early stage. When using that kind of monitoring it will not be necessary to stop the motor of running in its stage of work. All the needed procedures can be done without changing the working cycle. REFERENCES [1]
[2]
[3] [4]
[5]
[6]
[7] [8]
[9]
[10]
[11]
[12]
[13]
A. Bonnett and G. Soukup, "Cause and analysis of stator and rotor failures in three-phase squirrel-cage induction motor," in IEEE Transactions on Industry Applications, vol. 28, no. 4, July/August 1992, pp. 921–937. J. Faiz, B. Ebrahimi and M. Sharifian, "Time stepping finite element analysis of broken bars fault in a three-phase squirrel-cage induction motor," in Progress in Electromagnetic Research, PIER 68, 2007, pp. 53–70. T. Lindh, "On the condition monitoring of induction machines," Doctoral dissertation, Lappeenranta University of Technology, Lappeenranta, Finland, 2003. R. Fišer and S. Ferkolj, "Calculation of magnetic field asymmetry of induction motor with rotor faults," in Proceedings of the 1998 IEEE Mediterranean Electrotechnical Conference, Tel Aviv, Israel, vol. 2, pp. 1175–1179. R. Fišer and H. Lavric, "On-line detection and diagnostics of induction motor rotor faults using spectral analyses of stator current," in Proceedings of the 5th International Symposium on Topical Problems in the Field of Electrical and Power Engineering, Doctoral School of Energy and Geotechnology, January 14 – 19, Kuressaare, Estonia, 2008, pp. 7-11. R. Belmans and K. Hameyer, "Different approaches to the preventive maintenance of induction motors," in Proceedings of the International Conference on Electrical Machines ICEM’96, September 10-12, Vigo, Spain, 1996, vol. 2, pp. 423–428. P. Jover, "Current-, force and vibration-based techniques for induction motor condition monitoring," Doctoral dissertation, Helsinki University of Technology, Helsinki, Finland, 2007. T. Vaimann, A. Kallaste and A. Kilk, "Using analysis of stator current for squirrel-cage induction motor rotor faults diagnostics," in Proceedings of the 6th International Conference on Electrical and Control Techniques ECT-2011, May 5-6, Kaunas, Lithuania, 2011, pp. 245-251. L. Szabo, E. Kovacs, F. Toth, G. Fekete and J. Dobai, "Rotor faults detection method for squirrel cage induction machines based on the Park’s vector approach," in Annals of the University of Oradea, Fascicle of Electrotechnics, Section of Computer Science and Control Systems, 2007. M. Benbouzid, "A review of induction motors signature analysis as a medium for faults detection," in Proceedings of the 1998 International Conference of the IEEE Industrial Electronics Society, Aachen Germany, vol. 4, pp. 1908–1913. A. Cardoso and E. Saraiva, "Computer-aided detection of airgap eccentricity in operating three-phase induction motors by Park's vector approach," in IEEE Transactions on Industrial Applications, vol. 29, no. 5, September/October 1993, pp. 897–901. T. Vaimann, A. Kallaste and A. Kilk, "Overview of sensorless diagnostic possibilities of induction motors with broken rotor bars," in Proceedings of the 12th International Scientific Conference on Electrical Power Engineering EPE-2011, May 17-19, Kouty nad Desnou, Czech Republic, 2011, pp. 183-186. R. Fišer and S. Ferkolj, "Application of a finite element method to predict damaged induction motor performance," in IEEE Transactions on Magnetics, vol. 37, no. 5, September 2001, pp. 3635–3639.
PROCEEDINGS OF THE 52st ANNUAL INTERNATIONAL SCIENTIFIC CONFERENCE OF RIGA TECHNICAL UNIVERSITY SECTION „POWER AND ELECTRICAL ENGINEERING”, OCTOBER 2011 Electrical Machines and Apparatus / Elektriskās mašīnas un aparāti Toomas Vaimann was born in Pärnu, Estonia, in 1984 and received his BSc and MSc degrees in electrical engineering from Tallinn University of Technology, Estonia, in 2007 and 2009 respectively. He is currently a PhD student in Tallinn University of Technology department of Fundamentals of Electrical Engineering and Electrical Machines. He has been working in several companies as an electrical engineer. Presently he is working at the Tallinn University of Technology department of Fundamentals of Electrical Engineering and Electrical Machines on engineer’s position. He is a member of Estonian Society for Electrical Power Engineering. His main research interest includes diagnostics of electrical machines. E-mail:
[email protected] Ants Kallaste was born in Pärnu, Estonia in 1980 and received his BSc and MSc degrees in electrical engineering from Tallinn University of Technology, Estonia, in 2004 and 2006 respectively. He is currently a PhD student in Tallinn University of Technology department of Fundamentals of Electrical Engineering and Electrical Machines. Presently he is working at the Tallinn University of Technology department of Fundamentals of Electrical Engineering and Electrical Machines on researcher position and in the company Energiatehnika OÜ on engineer’s
position. His main research interests include electrical machines, wind generators and power conversion systems. E-mail:
[email protected]
Aleksander Kilk was born in 1946. He has graduated from Tallinn University of Technology and received a BSc degree in electric machines and electrical equipment in 1969. He received his MSc and PhD degree from Tallinn University of Technology in 1992 and 2008 respectively. Since receiving his BSc degree in 1969 he has been working in the field of studies of electric machines, but also as a lecturer of the electrical engineering subjects. He is currently holding the position of associate professor as well as director of the department of Fundamentals of Electrical Engineering and Electrical Machines in Tallinn University of Technology. His special field of research includes permanent magnet synchronous generators structures and properties. E-mail:
[email protected]