ICA is similar to PCA and Factor analysis but it works on .... 29. Results of extracted independent signals when only ICA is applied with 'tanh' as nonlinearity.
International Journal of Computer Applications (0975 – 8887) Volume 70– No.28, May 2013
Separation of Linearly Mixed Speech Signals using DWT based ICA Daljeet Singh
Jaspinder Singh
LovelyProfessional University Phagwara, Punjab
LovelyProfessional University Phagwara, Punjab
ABSTRACT Speech is the fundamental means of communication among humans. Speech production is the process of converting a linguistic message to the acoustic waveform. Separating various linearly mixed speech signals is often modelled by famous cocktail party problem and can be achieved by a technique known as Independent Component Analysis (ICA). ICA is similar to PCA and Factor analysis but it works on non-Gaussian mixture of signals. In this paper, the problem of separating linearly mixed signals is solved by using filter banks with ICA. Comparison of existing ICA technique with the one proposed is done based on experimental results which shows that the proposed algorithm over performs basic ICA.
Keywords ICA; non- Gaussian; DWT; filter bank;
1. INTRODUCTION Independent Component Analysis is used in Blind Source Separation to solve the famous cocktail party problem. It works on extracting the independent signals or components out of the mixed data. Observed Data is assumed to be linear mixture of unknown data variables. If the mixing variables are known, the problem of estimating original data is just a simple matrix operation. But in practical problems, no information about original source and mixing variables is provided. In that case, Independent Component Analysis provides an efficient way to separate linearly mixed signals. Experimental results show that ICA provides fair results in the case when two signals are mixed but if more than two sources are present, it fails to estimate the original signals completely. Hence instead of applying ICA on mixed signal directly, it is applied on transformed signal generated by filter bank decomposition. Independence is the main criterion in ICA. Two random variables are said to be independent if their joint probability density function (PDF) is factorable. If two random variables y1 and y2 having marginal PDF as P1(y1)and P2(y2) respectively, their joint PDF i.e. P(y1,y2) for independence can be given as a product of their marginal PDF’s. P(y1,y2)= P1(y1) P2(y2) Uncorrelated or partly independent variables satisfy the condition E[y1,y2]=E[y1]E[y2] Hence the concept of Independent variables is broader than being uncorrelated [1].
The process of mixing various source signals can be represented in matrix form as Y=WX, where X is a matrix containing unknown original signals as row vector, Y contains observed signals as row vectors and W is the unknown mixing matrix. For simplicity, we are considering noise free environment where only the speech signals from various speakers is mixed. In order to estimate original source signals, mixing matrix W has to be estimated. Some pre-processing of data is required before applying ICA on observed data. This includes PCA and whitening. PCA stands for Principle Component Analysis and is a popular technique for data compression. Number of original signals can de estimated by number of principle components above a threshold value. Whitening is used to remove correlation in data. After these pre-processing techniques, data is assumed to have zero mean and unit covariance. Independence of estimated signals in ICA can be achieved either by minimizing the mutual information or maximizing the non-Gaussianity among components.
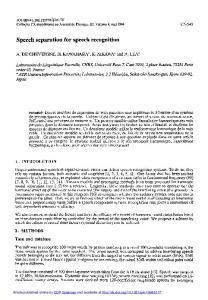
2. WAVELET BANK ANALYSIS Wavelet is helpful in analysis of non-stationary signals like speech by multi resolution analysis. Signals which are recorded from different sources are fed to filter banks which decompose these signals by filter banks. ICA is then applied on these two decomposed signals separately. The result from ICA on two decomposed signals is then merged into final resultant signal using reconstruction filters. Output of each filter contains half of frequency content but equal samples as of input signal. Hence down sampling is required at analysis bank. Similarly, at synthesis bank, up sampling is required. This is in accordance with Shannon theorem. Filter bank is designed to be biorthogonal in order to have perfect reconstruction. To prevent aliasing and distortion, following criterion should be fulfilled L’(z)=H(-z) H’(z)=-L(-z) Where L(z) and H(z) are analysis bank low pass and high pass filters respectively and L’(z) and H’(z) are synthesis filter [4]. As a result of wavelet decomposition, wide band signals are converted into narrow band which decreases the probability of finding two independent signals in same frequency band. x(n) is divided into two sub bands and ICA1, ICA2 represent ICA algorithm resulting in X1’(n)and X2’(n). These signals can be then fed to reconstruction filter bank to get the results. The complete process can be visualized by following block diagram-
27
International Journal of Computer Applications (0975 – 8887) Volume 70– No.28, May 2013
H(z)
2
ICA 1
L(z)
2
ICA 2
X1’(n)
x(n)
2
X1’(n)
X2’(n)
2
3.
In this paper, tanh and y3 are used as nonlinear functions to estimate the original sources. Orthogonalization among variables can be achieved by either Deflationary approach or Symmetric approach. In deflationary approach, independent components are estimated one by one using the orthogonalization
H’(z) y(n)
X2’(n)
The estimation of Negentropy is required because the PDF of a random variable is difficult to calculate accurately. Instead of using expectation of variable y, expectation of nonquadratic function is used in calculating Negentropy to increase robustness of process. Several non-quadratic functions are proposed in literature. Some popular functions are tanh(y), y3, -exp(-y2/2) and 1/a log{cosh(ay)}[5].
L’(z)
While in symmetric approach, independent components are estimated in parallel. Due to its time efficiency, Symmetric approach is used here. Symmetric orthogonalization is achieved by the relation
ICA
Iterative method for ICA is used to update the weights to achieve optimum weights in order to estimate the independent components from the mixed signals. Extraction of independent components from pre-processed data can be achieved by either minimizing the mutual information among variables or maximization of non-Gaussianity. Literature survey gives some quantitative measures of non-Gaussianity based on higher order statistics of data. Some of these measures are Kurtosis and Negentropy.
4. RESULTS The following is a set of three speech signals taken under consideration
The forth order cumulant is referred to as Kurtosis. It can be used to find the optimum weights for independent signal extraction from mixed signals and is given by the equation Kurt(y)=E{y4}-3(E{y2})2 By the pre-processing techniques, mixed signal y is assumed to be unit variance and zero mean, Kurtosis can be approximated as Kurt(y)=E{y4}-3 For gaussian variables, kurt(y)=0. This property of Gaussian variables can be used to distinguish them from other nonGaussian variables. The value of kurt(y) is positive for superGaussian (spiky PDF) and negative for sub-Gaussian variables [2].
The mixed signals are given as
On the other hand, Negentropy or differential entropy is also a measure of non-Gaussianity. Gaussian variable has the largest entropy among all random variable of equal variance. If Ygauss is the Gaussian random variable, Negentropy for a random variable y can be given as J(y) = H(Ygauss)-H(y) For a Gaussian variable, Negentropy is zero and is positive for other variables. Negentropy can be estimated as
28
International Journal of Computer Applications (0975 – 8887) Volume 70– No.28, May 2013
Results of extracted independent signals when only ICA is applied with ‘tanh’ as nonlinearity Results when the proposed method of DWT based ICA is used with ‘tanh’ nonlinearity
Results of extracted independent signals when only ICA is applied with ‘exp’ as nonlinearity
Results by the proposed method of DWT based ICA is used with ‘exp’ nonlinearity
Results of extracted independent signals when only ICA is applied with ‘Y3’ as nonlinearity
29
International Journal of Computer Applications (0975 – 8887) Volume 70– No.28, May 2013 Results by the proposed method of DWT based ICA is used with ‘y3’ nonlinearity
nonlinearity is solely dependent on user. But the nonlinearity ‘tanh’ used as nonlinear function with unit step size, 100 iterations and Daubechies wavelet ‘db2’ as wavelet function in DWT in the algorithm gives most appropriate results. Since in this approach, the effective input length of the two parallel processes is halved, therefore it does not have a considerable effect on computational complexity of the original algorithm.
Correlation matrix obtained by using ICA algorithm with different nonlinearities and by proposed algorithm are given in table below-
6. CONCLUSIONS
Non linea-
Correlation by ICA
By Proposed algorithm
0.4713
0.3623 0.2228
0.2503
0.6765 0.9304
0.7353
0.5130 0.2260
0.1526
0.7049 0.1281
0.4688
0.7895 0.9455
0.9187
0.1764 0.0061
0.1885
0.3187 0.8115
0.4143
0.2335 0.1623
0.9382
0.9398 0.5050
0.6684
0.6862 0.3567
0.2759
0.0520 0.2550
0.4704
0.6381 0.2313
exp
0.7088
0.0069 0.1813
0.0730
0.6435 0.0368
(y)
0.5599
0.0247 0.1260
0.9975
0.4374 0.5635
0.4165
0.9998 0.9729
0.319
0.6264
Rity Tanh
Y^3
0.8278
5. DISCUSSIONS OF RESULTS Correlation table gives a clear idea that conventional ICA can be outperformed by DWT based ICA as the extracted signals by DWT based ICA show more correlation with the source signals than in the case when conventional ICA is used to extract the independent signals. Values of elements of correlation matrix show the correlation of source signals with the extracted signals. Due to normalization of signals, correlation values may have values ranging from 0 to 1 with 1 as perfect correlation and 0 as no correlation. Hence higher the value of correlation; better is the performance of extraction algorithm. But there is a condition that one extracted signal should be correlated to only single source signal as all sources are independent in nature. If more than one extracted signal gives higher values of correlation coefficient with source signal, it is expected that the extraction process is not satisfactory. From the experiments performed on different sets of speech signals, it is observed that the DWT based ICA gives better results than conventional ICA in most of the cases. Choice of
In this paper architecture for separation of more than two linearly mixed speech signals by ICA is improved by using IJCATM : www.ijcaonline.org discrete wavelet transform along with ICA. It contains two parallel processes, one process takes the high-frequency wavelet part of observations as its inputs, and the other process takes the low frequency part. From the experiments performed on different sets of speech signals, it is observed that the nonlinearity ‘tanh’ should be used as nonlinear function with unit step size and 100 iterations in the proposed algorithm to get most appropriate results. Finally their outputs are merged by wavelet reconstruction to generate the final results. Since in this approach, the effective input length of the two parallel processes is halved, it therefore generally provides a new way for ICA estimation. In future work, this algorithm can be improved by more detail study of using particular nonlinearity and step size in more detail to obtain better results for more than three mixed signals and accurate recovery of original speech signals.
7. REFERENCE [1] A. Papoulis, textbook, (1991) “Probability, Random Variables and Stochastic Processes,” McGraw- Hill, 3rd edition, 1991. [2] A. Belouchrani, K. A. Meraim, J.-F. Cardoso, and E. Moulines, (1997) “A blind source separation technique based on second order statistics,” IEEE Trans. on Signal Processing, 45(2):434-444, 1997. [3] A. Hyvarinen, J. Karhunen, and E. Oja, Text book, (2001) “Independent Component Analysis,” John Wiley & Sons, 2001. [4] Allan Kardec Barros, Tomasz Rutkowski, Fumitada Itakura, and Noboru Ohnishi, “Estimation of Speech Embedded in a Reverberant and Noisy Environment by Independent Component Analysis and Wavelets,” IEEE 2002. [5] M. S. Pedersen, 1. Larsen, U. Kjems, and L. C. Parra, "A survey of convolutive blind source separation methods," Springer Handbook on Speech Processing and Speech Communication, pp. 1-34, 2007.
30
International Journal of Computer Applications (0975 – 8887) Volume 70– No.28, May 2013 [6] Ying-Xian He, Gang Xu, Qi-Rong Qiu, “A New Model For Robot Audition Using Independent Component Analysis And Time-Frequency Representation,” IEEE 2007. [7] Qiu-Hua Lin, Ying-Guang Hao, “A Survey of Semi-blind ICA for Speech Separation in Frequency Domain” IEEE, 2010. [8] Arti Khaparde ,“Study Of ICA Algorithm For Separation Of Mixed Images”, IEEE 2012
31