Hower et al. BMC Bioinformatics 2011, 12:15 http://www.biomedcentral.com/1471-2105/12/15
METHODOLOGY ARTICLE
Open Access
Shape-based peak identification for ChIP-Seq Valerie Hower1*, Steven N Evans1,2, Lior Pachter1,3*
Abstract Background: The identification of binding targets for proteins using ChIP-Seq has gained popularity as an alternative to ChIP-chip. Sequencing can, in principle, eliminate artifacts associated with microarrays, and cheap sequencing offers the ability to sequence deeply and obtain a comprehensive survey of binding. A number of algorithms have been developed to call “peaks” representing bound regions from mapped reads. Most current algorithms incorporate multiple heuristics, and despite much work it remains difficult to accurately determine individual peaks corresponding to distinct binding events. Results: Our method for identifying statistically significant peaks from read coverage is inspired by the notion of persistence in topological data analysis and provides a non-parametric approach that is statistically sound and robust to noise in experiments. Specifically, our method reduces the peak calling problem to the study of treebased statistics derived from the data. We validate our approach using previously published data and show that it can discover previously missed regions. Conclusions: The difficulty in accurately calling peaks for ChIP-Seq data is partly due to the difficulty in defining peaks, and we demonstrate a novel method that improves on the accuracy of previous methods in resolving peaks. Our introduction of a robust statistical test based on ideas from topological data analysis is also novel. Our methods are implemented in a program called T-PIC (Tree shape Peak Identification for ChIP-Seq) is available at http://bio.math.berkeley.edu/tpic/.
Background With rapidly decreasing costs of sequencing, next-generation sequencing assays are increasingly being used for molecular measurements [1]. These techniques generate millions of short reads and massive data sets, making it computationally challenging to properly analyze the data. One such assay, called ChIP-Seq (chromatin immunoprecipitation followed by sequencing), is used to determine DNA binding sites of a protein (see [2,3] for a review). In ChIP-Seq, protein is first cross-linked to DNA and the fragments subsequently sheared. Following a size selection step that enriches for fragments of specified lengths, the fragments ends are sequenced, and the resulting reads are aligned to the genome. Reads pile up at bound regions referred to as “peaks”, but due to mapping challenges and biases in various aspects of existing protocols, identifying peaks is not a straightforward task.
While there are many current algorithms for analyzing ChIP-Seq data (see [4] for a recent review), there is still room for improvement as most rely on adhoc heuristics including coverage thresholds and poorly motivated filters. In particular, while existing methods rely on depth of coverage to determine likely binding sites using statistical methods, the determination of regions of binding, i.e. peak boundaries, is frequently based on heuristics. We present a novel approach for calling peaks that is based on evaluating the significance of a robust test statistic that measures the extent of pile-up of reads. Specifically, we use define and evaluate the “shape” of putative peaks to differentiate between random and nonrandom fragment placement on the genome. We compare our predictions to two state-of-the-art methods (based on comparisons in [4,5]) using two published data sets and demonstrate improved performance.
* Correspondence:
[email protected];
[email protected] 1 Department of Mathematics, University of California, Berkeley, California, USA Full list of author information is available at the end of the article © 2011 Hower et al; licensee BioMed Central Ltd. This is an Open Access article distributed under the terms of the Creative Commons Attribution License (http://creativecommons.org/licenses/by/2.0), which permits unrestricted use, distribution, and reproduction in any medium, provided the original work is properly cited.
Hower et al. BMC Bioinformatics 2011, 12:15 http://www.biomedcentral.com/1471-2105/12/15
Page 2 of 9
Results and Discussion Algorithm Overview of the algorithm
The input to our algorithm consists of the aligned reads for both the sample and input control. We create a ‘coverage function’–a map f from the genomic coordinates to the non-negative integers– by extending each of the aligned sample reads to the average fragment length L. The ‘height’ f(t) at a nucleotide t is the number of such extended reads that contain t. This piecewise constant function is the data that we analyze. We will flag peaks in the coverage function that are, in a suitable sense, ‘anomalous’ as being likely protein binding sites. In order to turn this some-what vague idea into a well-founded statistical inference procedure we require two basic ingredients. Firstly, we need a numerical test statistic that measures some feature of a peak such that peaks which result in extreme values of the test statistic might reasonably be expected to be binding sites. Secondly, in order to calibrate whether a value of the test statistic is so large that it is difficult to explain as simply being the consequence of random fluctuations (and thus indicates the presence of a binding site) we need a stochastic model of the coverage function for the ‘null’ situation when we are in a region of the genome that doesn’t contain a binding site. A tree shape statistic ℳ to measure “peakness”
The most obvious test statistic is simply the height of a peak. However, such a statistic reflects the depth of coverage at a single site, and ignores valuable information in the form of the coverage depth in the neighboring region. Motivated by current work in topological data analysis (TDA) [6], we propose the following more synoptic measure of a peak’s shape that incorporates information in the neighborhood of each site and therefore allows for defining binding regions, and not just sites. Suppose we have an interval [a, b] of the genome that corresponds to an excursion of the coverage function above some height h. That is, f (a) = f (b) = h, f (t ) > h
for
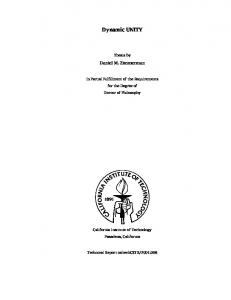
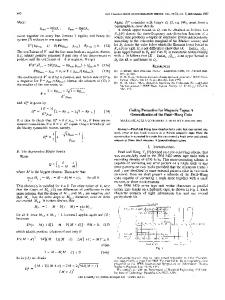
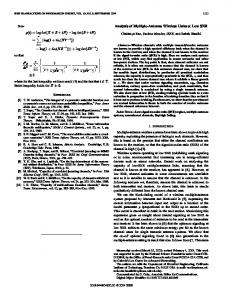
Figure 1 A lattice path excursion and its associated tree. An example of lattice path excursion (A) and its associated rooted tree (B) is given. The rooted tree is obtained by taking equivalence classes of vertices in (A), as explained in [7,8]. The vertices in (A) that are chosen representatives for the equivalence classes are depicted with blue stars.
path excursions (starting and ending at height h) and rooted trees with root at height h. The tree captures in compact form the important features of the excursion of the coverage function. We need to further summarize this tree using an appropriate numerical statistic. In order to motivate our choice, consider the extreme cases of the trees that could arise. Figure 2 depicts the lattice paths and corresponding rooted trees for, respectively, a perfect peak and perfect noise. For a tree with n vertices, we look for a statistic that attains its greatest and least values, respectively, on the path Pn and the star Sn. A matching of a tree T is a subset M of the edges of T with the property that no two edges in M share a common vertex of T. A matching M is maximal if it contains at least as many edges as any other matching. We define ℳ(T) to be the number of edges in a maximal matching for the tree T. Note that ( T ) ≤ ⎢⎣ n2 ⎥⎦ = ( Pn ) and ℳ(T) ≥ 1 = ℳ(S n ) for any tree T with n vertices. In general, excursions of the coverage function that correspond to
and a