ShaperProbe: End-to-end Detection of ISP Traffic Shaping ∗ using Active Methods Partha Kanuparthy, Constantine Dovrolis School of Computer Science, Georgia Institute of Technology
[email protected],
[email protected]
ABSTRACT
we focus on a class of such mechanisms referred to as traffic shapers or traffic policers.1 A traffic shaper is a single-input single-output packet forwarding module that behaves as follows: Consider a link of capacity C bps, associated with a “token bucket” of size σ tokens. Whenever the bucket is not full, tokens are generated at a rate ρ tokens per second, with ρ < C. The link can transmit an arriving packet of size L bits only if the token bucket has at least L tokens - upon the transmission of the packet, the shaper consumes L tokens from the bucket. So, if we start with a full token bucket of size σ tokens, and with a large burst of packets of size L bits each (suppose that σ is an integer multiple of L for simplicity), the link will be able to transmit k of those packets at the rate of the σ/L capacity C, with k = 1−ρ/C . After those k packets, the link will start transmitting packets at the token generation rate ρ. Usually ρ is referred to as the “shaping rate”, the capacity C is also referred to as the “peak rate”, while σ is referred to as the “maximum burst size”. Another way to describe a traffic shaper is by specifying that the maximum number of bits that can be transmitted in any interval of duration τ , starting with a full token bucket, is:
We present an end-to-end measurement method for the detection of traffic shaping. Traffic shaping is typically implemented using token buckets, allowing a maximum burst of traffic to be serviced at the peak capacity of the link, while any remaining traffic is serviced at a lower shaping rate. The contribution of this paper is twofold. First, we develop an active end-to-end detection mechanism, referred to as ShaperProbe, that can infer whether a particular path is subject to traffic shaping, and in that case, estimate the shaper characteristics. Second, we analyze results from a large-scale deployment of ShaperProbe on M-Lab over the last 24 months, detecting traffic shaping in several major ISPs. Our deployment has received more than one million runs so far from 5,700 ISPs.
Categories and Subject Descriptors C.2.3 [Computer-Communication Networks]: Network Operations—Network monitoring
General Terms
ˆ ) = min{L + Cτ, σ + ρτ } A(τ
Measurement, Performance
The difference between a traffic shaper and a traffic policer is that the former has a buffer to hold packets that arrive when the token bucket is empty [6, 23]. A policer simply drops such “non-conforming” packets. In other words, a shaper delays packets that exceed the traffic shaping profile (σ, ρ), while a policer drops them.2 Policers can cause excessive packet losses and so shapers are more common in practice - we focus on the latter in the rest of the paper. Why would a residential ISP deploy traffic shaping? First, to allow a user to exceed the service rate that he/she has paid for, for a limited burst size. In that case the user pays for ρ bps, with the additional service capacity C − ρ marketed as a free service enhancement. This is, for instance, how Comcast advertises their PowerBoost traffic shaping mechanism [5]. Second, an ISP may want to limit the service rate provided to the aggregate traffic produced or consumed by a customer, or to limit the service rate consumed by a certain application (e.g. BitTorrent). This form of shaping is relevant to the network neutrality debate. Third, certain ISPs prefer to describe their service rates as upper bounds
Keywords Active probing, traffic shaping, inference
1.
INTRODUCTION
The increasing penetration of broadband access technologies, such as DSL, DOCSIS and WiMAX, provides users with a wide range of upstream and downstream service rates. Broadband users need to know whether they actually get the service rates they pay for. On the other hand, ISPs now have an extensive toolbox of traffic management mechanisms they can apply to their customers’ traffic: application classifiers, schedulers, active queue managers etc. In this paper ∗This work was supported by a research gift from Google Inc. Permission to make digital or hard copies of all or part of this work for personal or classroom use is granted without fee provided that copies are not made or distributed for profit or commercial advantage and that copies bear this notice and the full citation on the first page. To copy otherwise, to republish, to post on servers or to redistribute to lists, requires prior specific permission and/or a fee. IMC’11, November 2–4, 2011, Berlin, Germany. Copyright 2011 ACM 978-1-4503-1013-0/11/11 ...$10.00.
1 When it is not important to distinguish between shaping and policing, we will simply refer to such mechanisms as “traffic shapers” or just “shapers”. 2 A shaper also drops packets once its droptail buffer is full.
473
for what the user will actually get, e.g., a downstream rate of at most 6Mbps. In that case, a shaper can be used to enforce the upper bound of the service rate. The contribution of this paper is twofold. First, we develop an active end-to-end detection mechanism, referred to as ShaperProbe, that can infer whether a particular path is subject to traffic shaping, and in that case, estimate the shaper characteristics C, ρ and σ. Second, we analyze results from a large-scale deployment of ShaperProbe on MLab [11] since May 2009, detecting traffic shaping in several major ISPs. Our deployment received about one million runs over the last two years from more than 5,700 ISPs; we currently see 2,000-3,000 runs per day (see Figure 1). All data collected through ShaperProbe runs is publicly available through M-Lab [8].3 Traffic shaping detection and estimation methods can be used in different ways: as a library (API); and as a service that enables users/administrators to detect or verify their SLAs/shaping configurations. In this paper, we focus on the latter. The ShaperProbe client is a download-andclick userspace binary (no superuser privileges or installation needed) for 32/64-bit Windows, Linux, and OS X; a plugin is also available for the Vuze BitTorrent client. The non-UI logic is about 6000 lines of open source native code. There are several challenges that one needs to tackle when designing an active measurement service that can scale to thousands of users per day, including accuracy, usability and non-intrusiveness. Even though these challenges are often viewed as not significant, at least from the research perspective, they have greatly influenced several design choices and parameter values in ShaperProbe.
10000
Runs per day
1000
10
1 1 01 l2 1 Ju 201 ay 1 M 201 ar 1 M 201 n 0 Ja 201 ov 0 N 201 p Se 010 l2 0 Ju 201 ay 0 M 201 ar 0 M 201 n 9 Ja 200 ov 9 N 200 p Se 009 l2 9 Ju 200 ay
M
Time
Figure 1: ShaperProbe: volume of runs. The gaps in time show downtime due to tool enhancements.
the Tech Report [17]. The receiver RCV records the received rate timeseries Rr (t). We compute Rr (t) by discretizing time into fixed size non-overlapping intervals of size ∆. For simplicity, assume that the probing starts at t = 0, and that intervals are numbered as integers i ≥ 1. The i’th interval includes all packets received in the interval [(i − 1) ∆, i∆), where packet timestamps are taken at RCV upon receipt of each packet. The discretized received rate timeseries Rr (i) is estimated as the total bytes received in interval i divided by ∆. Note that this estimator of Rr (t) can result in an error of up to ǫ = ±S/∆ where S is the MTU packet size. By choosing a reasonably large ∆, we can reduce the magnitude of ǫ relative to the true received rate. In the presence of a token bucket traffic shaper (or policer) on SN D → RCV, there exists a value of i > 1 at which the received rate timeseries Rr (i) undergoes a level shift to a lower value. Our goal is to detect the presence of a level shift, and estimate the token bucket parameters using Rr (i).
Related work. Lakshminarayanan et al. recorded initial observations of traffic shaping in residential ISPs in 2003 [18]. Dischinger et al. found downstream traffic shaping in a 2007 study [13] using a 10s flow at 10Mbps; they did not find evidence of upstream traffic shaping. More recently, two studies [12, 21] focused on the effects of PowerBoost in cable ISPs. Recent research efforts on detecting traffic discrimination in ISPs [14, 16, 19, 20, 22, 24, 25] compliment our work, since we consider the problem of detecting traffic shaping independent of differentiation. In particular, Glasnost [14] uses aggregate throughput of an emulated application and compares it with a baseline to detect throughput differences. Weinsberg et al. infer queue weights of a discriminatory scheduler [24]. In the rest of the paper, we describe the active detection method (§2), implementation and deployment of ShaperProbe (§3), and look at ShaperProbe data using case studies of four ISPs (§4).
2.
100
2.1 Detection We want to detect a level shift in Rr in real-time, i.e., as we compute the received rate for each new interval. Note that the receiver RCV is also receiving new packets during the level-shift detection process, and so our method should be fast and computationally light-weight to avoid the introduction of timestamping jitter. The detection method is rather simple and relies on nonparametric rank statistics of Rr so that it is robust to outliers [15]. We compute ranks online. Suppose that we have estimated n values of Rr so far. At the start of the new interval n + 1 (i.e., after the receipt of the first packet in that interval), we compute Rr (n) and update the ranks r(i) of Rr (i) for i = 1 . . . n. We identify τ as the start of level shift if it is the first interval index that satisfies the following three conditions. First, all ranks at the left of τ are equal to or higher than all ranks at the right of τ :
ACTIVE PROBING METHOD
The active probing method is an end-to-end process in which one end-host SN D sends packets on the network path to the receiver RCV. We detect the presence of traffic shaping in the path SN D → RCV at RCV. Suppose that the narrow link’s capacity on the path is C, and that the sender probes at a constant bit rate Rs = C. The ShaperProbe capacity estimation process is described in
min
i=1...τ −1
r(i) ≥
max
j=τ +1...n
r(j)
(1)
Second, we have observed a minimum time duration before and after the current rate measurement:
3
We log per-packet send and receive timestamps and sequence numbers for all probing phases, and client IP address and server timestamp (UTC) for each run.
nL < τ < n − nR
474
(2)
β
Time
Figure 2: Active probing: Level shift detection.
i=1...τ
After the detection of a level shift, we estimate the token bucket parameters from the rate timeseries Rr as follows. The token generation rate (shaping rate) ρ is estimated as the median (to be robust to outliers) of the received rate measurements after β:
We estimate the token bucket depth (burst size) σ based on the number of bytes sent till the τ ’th time interval. We estimate a range for σ, since we discretize time in to intervals of size ∆, based on the estimate ρˆ of ρ and the received rates:
i=1
20
25
30
35
30
35
60s
5
10
15
20
25
The design of a tool that works well on a wide variety of network conditions, OS platforms and broadband link technologies is challenging. A first challenge is that ShaperProbe requires a fast and accurate estimate of the narrow-link capacity between the sender and receiver; this estimate is the ShaperProbe probing rate. ShaperProbe uses packet train dispersion for estimating capacity; it additionally probes using a longer train to be robust to wireless link effects. Second, the probing method should be able to generate traffic at a constant rate, even with a coarse-grained userspace OS timer granularity. At the same time, the transmission of packets should not impose heavy load on the CPU resources at the sender. ShaperProbe sends small periodic packet trains, and times the inter-train gaps such that busy-wait loops are minimized. Third, the ShaperProbe client should be non-intrusive. The client and server abort the probing process if they observe losses on the path. Finally, cross traffic on the path may lead to temporary drops in the received rate Rr ; we need to incorporate a filtering mechanism that can remove outliers from Rr . ShaperProbe filters outliers using recorded observations from the local neighborhood of the Rr timeseries. The Tech Report [17] describes how ShaperProbe addresses the previous challenges and implementation details. We currently run load-balanced ShaperProbe server replicas on 48 M-Lab hosts connected directly to tier-1 ASes. For measurement accuracy, we allow only one client at each server replica at any time.
(4)
[R(i) − ρˆ] ∆ 2
15
3. SHAPERPROBE IMPLEMENTATION
i=β+1...n
[R(i) − ρˆ]∆ ±
10
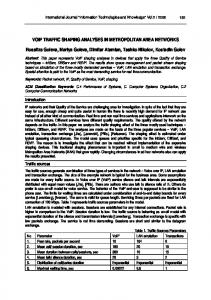
while at the same time keeping the total probing duration reasonably short when there is no shaping. Figure 3 shows that the burst duration is at most 48s, except for 4 out of 36 configurations. Λ is set to 60s in the current implementation. A typical ShaperProbe residential run lasts for 2-3 minutes. The averaging window size ∆ should be sufficiently large to keep the estimation noise in Rr low, and sufficiently short so that Λ includes several rate samples. We have performed 100 trials in the upstream direction of a Comcast residential connection, whose SLA we know (4.5Mbps shaped to 2Mbps). We found that for ∆ ≥ 50ms, the shaping detection rate is 100%; as ∆ approaches the inter-packet gap, the detection rate drops significantly. We set ∆ to 300ms so that we can detect shaping even in low capacity links.
(3)
2.2 Estimation
τ X
5
Figure 3: Advertised Comcast, Cox tiers: required γ and Λ.
˜ r denotes the median, and γ is a suitable threshold. where R We select γ based on empirical observations of ISP capacities and shaping rates in practice (see Section 2.3). Similarly, we detect the end of a level shift index β such that β ≥ τ and β is the last point which satisfies the rate condition in Equation 1. Figure 2 illustrates the two level shift indices.
σ ˆ=
0
Tier
j=τ ...n
˜ r (i) ρˆ = R
350 300 250 200 150 100 50 0
1.1
0
The value of nL is chosen based on empirical observations of typical burst durations in ISP deployments, and nR is a sanity check to ensure that the drop in rate is not just a temporary variation (e.g., due to cross traffic). Third, we require that there is a significant drop in the median rate at point τ : ˜ r (i) > γ R ˜ r (j) R
Cap. / shaping-rate ratio
τ
Burst duration (s)
Received rate
∆
2.6 2.4 2.2 2 1.8 1.6 1.4 1.2 1
(5)
2.3 Parameter Selection As in any other measurement tool that is used in practice, there are some parameters that need to be tuned empirically. In ShaperProbe, the key parameters are the factor γ, the probing duration Λ, and the interval duration ∆. We have selected the values of these parameters based on the detection of actual shaper deployments in broadband ISPs for which we knew the “ground truth”. Figure 3 shows the ratio of the capacity over the shaping rate C/ρ and the maximum burst duration (in seconds) for 36 advertised traffic shaper deployments at Comcast and Cox in metro Atlanta in October 2010. Note that all tiers have a capacity-to-shaping rate ratio of 1.1 or higher; in the current implementation of ShaperProbe we use γ = 1.1. The probing duration Λ should be sufficiently long so that it can detect as many ISP shaping configurations as possible,
475
ISP Comcast Road Runner AT&T Cox MCI-Verizon
Upstream (%) 71.5 (34874) 6.5 (7923) 10.1 (8808) 63 (5797) 5.6 (8753)
Dwnstrm. (%) 73.5 (28272) 63.9 (5870) 10.9 (7748) 47.4 (4357) 8.4 (7733)
C (Mbps) 3.5 4.8 8.8 14.5
σ (MB) 5 5, 10 10 10
Burst duration (s) 16.7 15.2, 30.5 25.8 18.8
(a) Upstream.
Table 1: Shaping detections: top-5 ISPs in terms of ShaperProbe runs. For each ISP we show percentage of runs with detected shaping and number of total runs.
4.
ρ (Mbps) 1 2 5.5 10
C (Mbps) 19.4 21.1 28.2 34.4
ρ (Mbps) 6.4 12.8 17 23.4
σ (MB) 10 10 20 20
Burst duration (s) 6.4 10.1 14.9 15.3
(b) Downstream.
RESULTS
In this section, we take a first look at results from the ShaperProbe deployment at M-Lab. We first examine accuracy using two ISPs for which we know the shaping ground truth and from emulation experiments.
Table 2: Comcast: detected shaping properties.
five ISPs in terms of the number of runs as well as the fraction of shaping detections are shown in Table 1. It should be noted that there are several factors that influence the fraction of shaping detections in an ISP. First, ISPs provide multiple tiers of service; some tiers may not use shaping, while service tiers change frequently. Second, an ISP may not deploy shaping in all geographic markets. Third, the access link type can be a factor: a DSL provider can dynamically change the link capacity instead of doing shaping, while a cable provider is more likely to use shaping since DOCSIS provides fixed access capacities. Fourth, for a given connection, the shaping parameters can be dynamically adjusted based on time or load conditions in the ISP. Fifth, an ISP A can originate the BGP prefixes of a smaller ISP B that deploys shaping (while A does not) - we cannot distinguish A from B based on BGP prefix-to-ASN mapping. We study some of these factors in ISP case studies next. Some ISPs disclose their traffic shaping configurations; in such cases, we can validate our observations.
Accuracy. We test the latest version of ShaperProbe on two residential ISPs, AT&T and Comcast, at two homes in metro Atlanta. We use the High-Speed Internet service of Comcast, and the DSL service of AT&T. At the time of these experiments, the Comcast configuration was: {10Mbps up, 22Mbps down} shaped to {2Mbps up, 12Mbps down} [5], while the AT&T configuration did not use shaping ({512Kbps up, 6Mbps down}) [2]. Out of 60 runs, we did not observe any shaping detection errors in either direction at the AT&T connection, while we observed two upstream false negatives at the Comcast connection due to capacity underestimation. We also emulated token bucket shaping on a wide-area path between a residential Comcast connection and a server deployed at the Georgia Tech campus. We use the LARTC tc tool on Linux with a 2.6.22 kernel on a dual-NIC 1GHz Celeron router with 256MB RAM. Over 20 experiments for each token bucket configuration and 10 configurations, we found that ShaperProbe detects the traffic shaper in all (200) experiments; it also accurately estimates the shaping rate and bucket depth for all configurations.
4.1 Case Study: Comcast Comcast offers Internet connectivity to homes [5] and enterprises [3], and uses two types of access technologies: cable (DOCSIS 3.0) and Ethernet. In each access category, it offers multiple tiers of service. Comcast shapes traffic using the PowerBoost technology [4].
Data preprocessing. In the following, we analyze data collected from the ShaperProbe M-Lab service. First, we consider runs from the latest ShaperProbe release, collected between 20th October 2009 and 9th May 2011 (total of 845,223 runs). Each run’s trace contains per-packet timestamps and sequence numbers for the upstream and downstream probing “half runs”. Second, we say that a half run is “unfinished” if no shaping was detected and the run lasted for less than 50s - we discard such runs. All completed half runs which are not diagnosed as shaping are considered noshaping cases. Recall that ShaperProbe probes each direction for 60s, and terminates a half run if it either detected shaping or if it observed packet losses during probing. A half run can also be unfinished if the user aborted the client before it could run to completion. After preprocessing, we have a total of 281,394 upstream and 236,423 downstream finished half runs. Next, we cluster AS numbers into ISPs using their whois AS names. The AS information was obtained from Cymru’s whois database in May 2011. Runs which passed the preprocessing checks come from 5,167 distinct ISPs. The top
Shaping profiles. We observed many shaping configurations at Comcast between October 2009 and May 2011. Figure 4 shows the shaping configuration of each run (ordered by capacity). For each run, designated by an ”ID”, we plot two points in the top panel for the capacity and the shaping rate; and a point in the bottom panel for the burst size. The capacities form an envelope of the shaping rate points. We see that there are strong modes in the data; Table 2 is a summary of these modes. For higher capacities, we see a larger number of modes in the shaping rate. However, at the tail of the capacity distribution there is only one shaping rate that corresponds to the highest service tier provided by Comcast. We verified our observations with the Comcast website listings [3, 5]. Note that we may not observe all service tiers in that web page, depending on the number of ShaperProbe users at each service tier. We also observe two or three burst sizes that are used across all tiers; the PowerBoost FAQ mentions 10MB and 5MB burst sizes [4].
476
Capacity Shaping rate
16000 14000
50000 Rate (Kbps)
12000
Rate (Kbps)
Capacity Shaping rate
60000
10000 8000 6000
40000 30000 20000
4000 10000
2000
0 30000 25000 20000 15000 10000 5000 0
Burst size (KB)
Burst size (KB)
0 16000 14000 12000 10000 8000 6000 4000 2000 0 0
5000
10000
15000 Run ID
20000
25000
0
(a) Upstream.
5000
10000 Run ID
15000
20000
(b) Downstream.
Figure 4: Comcast: Shaping characteristics.
upto 03/2010 since 03/2011
0
0
5000
10000 15000 Capacity (Kbps)
20000
upto 03/2010 since 03/2011
25000
0
2000 4000 6000 8000 10000 12000 14000 16000 18000 20000 Shaping rate (Kbps)
0
(a) Upstream.
10000 20000 30000 40000 50000 60000 70000 80000 90000 Capacity (Kbps)
10000
20000 30000 40000 Shaping rate (Kbps)
50000
60000
(b) Downstream.
Figure 5: Comcast: histogram of bandwidth with time. Non-shaped runs. We examine runs in which ShaperProbe did not detect shaping. Figure 6 compares the capacity distribution in such runs with the shaping rate distribution in shaping runs. The non-shaped capacity distributions are similar to the shaping rate distributions. Non-shaping runs occur due to the following two reasons. First, Comcast provides service tiers that do not include PowerBoost, but have capacities similar to PowerBoost service tiers (e.g., the Ethernet 1Mbps and 10Mbps business service). Second, it is possible that cross traffic resulted in an empty token bucket at the start of the measurement, and so the capacity that ShaperProbe estimated was equal to the shaping rate; we would not detect shaping in that case.
Note that the capacity curves do not show strong modes, unlike the shaping rates. This is due to the underlying DOCSIS access technology. The cable modem uplink is a nonFIFO scheduler; depending on the activity of other nodes at the CMTS, the capacity can vary due to customer scheduling and DOCSIS concatenation. A DOCSIS downlink can also influence the dispersion-based capacity estimates under heavy traffic load conditions because it is a broadcast link. Did shaping configurations change during the last two years?. We compare data from Comcast collected in October 2009-March 2010 and in March-May 2011. Figure 5 shows estimates of the capacity and shaping rate distributions using a Gaussian kernel density estimator. In the upstream direction, the capacity and shaping rates (the modes of the corresponding distributions) have not changed significantly. The downstream links show a new capacity mode of 30Mbps and a shaping rate mode of 22Mbps in 2011. We did not find significant changes in the burst size during the last two years.
4.2 Case Studies: Road Runner and Cox Road Runner (RR) is a cable ISP. A unique aspect of RR is that we have found evidence of downstream shaping, but no evidence of upsteam shaping in any service tier on their web pages. The ShaperProbe measurements for RR support this observation - 94% of the upstream runs did not detect shaping, while 64% of the downstream runs did. Another interesting aspect of RR is that shaping depends on
477
1
Rate (Kbps)
0.8
CDF
0.6
Burst size (KB)
0.4
Upstream: non-shaping Upstream: shaping Downstream: non-shaping Downstream: shaping
0.2
0 0
10000
20000 30000 40000 Capacity (Kbps)
50000
60000
9000 8000 7000 6000 5000 4000 3000 2000 1000 0 5000 4500 4000 3500 3000 2500 2000 1500 1000 500 0
Capacity Shaping rate
0
Figure 6: Comcast: distribution of capacities in non-shaping and shaping rate in shaping runs.
500
1000
1500
2000 Run ID
2500
3000
3500
Figure 7: Cox: Upstream shaping. 1 0.9
the geographic region of the customer; for example, in Texas, RR provides four service tiers: the lower two are not shaped while the upper two are shaped [10]. Under the hypothesis that RR does not shape upstream traffic, we can say that our false positive detection rate for their upstream links is about 6.4%. The capacity distribution of non-shaped RR runs shows that, unlike Comcast, the downstream capacity mode of 750Kbps is not equal to any of their shaping modes (figure omited due to space constraints; see [17]). Cox provides residential and business Internet access using cable and Ethernet access. The website [7] mentions that the residential shaping rates and capacities depend on the location of the customer. We gathered residential shaping configurations from the residential pages [7]. The upstream shaping properties of Cox runs in Figure 7 agree with some of the ground truth information we found: (C, ρ)Mbps: (1, 0.77), (1.3, 1), (2, 1.5), (2.5, 1), (2.5, 2), (3, 2), (3.5, 3), (5, 4) and (5.5, 5). Note that the previous ground truth was collected in October 2010, while the ShaperProbe data covers two years. We also found a single burst size mode.
0.8 0.7 CDF
0.6 0.5 0.4 0.3 0.2 0.1
Upstream Downstream
0 0
5000
10000 15000 20000 Capacity (Kbps)
25000
30000
Figure 8: AT&T: Capacity of non-shaping runs.
and an associated burst size mode (for figure, see [17]). About 80% of 333 runs that have the shaping rate modes come from hostnames that resolve to the domain mchsi.com, owned by the cable ISP Mediacom [9]. So, it is possible (though we can not be certain) that these shaping detections were not errors afterall.
4.3 Case Study: AT&T Our final case study is that of an ISP for which we do not see frequent shaping detections (10% or less). AT&T provides Internet access to a wide range of customers, from homes and small businesses to enterprises (including other ISPs). Their residential service includes four DSL service tiers [1, 2]. We did not find any mention of traffic shaping in the AT&T service descriptions [1, 2].
5. CONCLUSION In this work, we presented an end-to-end active probing, detection, and estimation method of traffic shaping in ISPs. Our evaluation using controlled experiments and in two known ISP deployments shows that ShaperProbe has false positive and false negative detection rates of less than 5%. We presented a first large-scale study of shaping at four large ISPs, and validated some of our observations using ISP advertised tier data. A strong modality of shaping rates and burst sizes suggests that ISPs typically deploy a small set of shaping configurations. We found some shaping detections for which the ISPs do not mention shaping in their service descriptions4 . Lack of publicly-available information, however, does not necessary imply that these are false detections. We are currently working on passive shaping detection methods (for preliminary results, see [17]).
Capacity. We first look at the 90% of the runs that did not see shaping. The capacity distribution of non-shaped runs is shown in Figure 8. Given the point-to-point nature of DSL links, ShaperProbe estimates the narrow link capacity more accurately than in cable links. The capacity distributions show several modes: {330Kbps, 650Kbps, 1Mbps, 1.5Mbps} upstream, and {1Mbps, 2.5Mbps, 5Mbps, 6Mbps, 11Mbps, 18Mbps} downstream. We did not observe significant changes in the capacity modes between 2009-2011. Shaping runs. We look at the 10% of AT&T runs that were probably mis-diagnosed as shaping. We found that about a third of these runs exhibit strong shaping rate modes
4 ISPs, however, typically mention in their SLAs that “listed capacities may vary”.
478
6.
REFERENCES
[1] AT&T FastAccess Business DSL Plans (May 12, 2010). http://smallbusiness.bellsouth.com/ internet_dsl_services.html. [2] AT&T FastAccess DSL Plans (May 12, 2010). http://www.bellsouth.com/consumer/inetsrvcs/ inetsrvcs_compare.html?src=lftnav. [3] Comcast Business Class Internet (May 12, 2010). http: //business.comcast.com/internet/details.aspx. [4] Comcast High Speed Internet FAQ: PowerBoost. http://customer.comcast.com/Pages/ FAQListViewer.aspx?topic=Internet&folder= 8b2fc392-4cde-4750-ba34-051cd5feacf0. [5] Comcast High-Speed Internet (residential; May 12 2010). http://www.comcast.com/Corporate/Learn/ HighSpeedInternet/speedcomparison.html. [6] Comparing Traffic Policing and Traffic Shaping for Bandwidth Limiting. Cisco Systems: Document ID: 19645. [7] Cox: Residential Internet (May 12, 2010). http://intercept.cox.com/dispatch/ 3416707741429259002/intercept.cox?lob= residential&s=pf. [8] Data from M-Lab Tools (May 2011). http://www.measurementlab.net/data. [9] Mediacom: Hish-speed Internet (May 12, 2010). http: //www.mediacomcable.com/internet_online.html. [10] Road Runner cable: central Texas (May 12, 2010). http://www.timewarnercable.com/centraltx/ learn/hso/roadrunner/speedpricing.html. [11] ShaperProbe (M-Lab). http://www.measurementlab. net/measurement-lab-tools#tool5. [12] S. Bauer, D. Clark, and W. Lehr. PowerBoost. In ACM SIGCOMM HoneNets workshop, 2011. [13] M. Dischinger, A. Haeberlen, K. Gummadi, and S. Saroiu. Characterizing residential broadband networks. In ACM IMC, 2007. [14] M. Dischinger, M. Marcon, S. Guha, K. Gummadi,
[15] [16]
[17]
[18]
[19]
[20]
[21]
[22]
[23]
[24]
[25]
479
R. Mahajan, and S. Saroiu. Glasnost: Enabling End Users to Detect Traffic Differentiation. In USENIX NSDI, 2010. M. Hollander and D. Wolfe. Nonparametric statistical methods. 1973. P. Kanuparthy and C. Dovrolis. DiffProbe: Detecting ISP Service Discrimination. In IEEE INFOCOM, 2010. P. Kanuparthy and C. Dovrolis. End-to-end Detection of ISP Traffic Shaping using Active and Passive Methods. Technical Report, Georgia Tech, 2011. http: //www.cc.gatech.edu/~partha/shaperprobe-TR.pdf. K. Lakshminarayanan and V. Padmanabhan. Some findings on the network performance of broadband hosts. In ACM SIGCOMM IMC, 2003. G. Lu, Y. Chen, S. Birrer, F. Bustamante, C. Cheung, and X. Li. End-to-end inference of router packet forwarding priority. In IEEE INFOCOM, 2007. R. Mahajan, M. Zhang, L. Poole, and V. Pai. Uncovering performance differences among backbone ISPs with Netdiff. In USENIX NSDI 2008. S. Sundaresan, W. de Donato, N. Feamster, R. Teixeira, S. Crawford, and A. Pescap`e. Broadband Internet performance: a view from the gateway. In ACM SIGCOMM, 2011. M. Tariq, M. Motiwala, and N. Feamster. NANO: Network Access Neutrality Observatory. In ACM Hotnets Workshop 2008. G. Varghese. Network Algorithmics: an interdisciplinary approach to designing fast networked devices. Morgan Kaufmann, 2005. U. Weinsberg, A. Soule, and L. Massoulie. Inferring traffic shaping and policy parameters using end host measurements. In IEEE INFOCOM Mini-conference, 2011. Y. Zhang, Z. Mao, and M. Zhang. Detecting traffic differentiation in backbone ISPs with NetPolice. In ACM IMC, 2009.
Summary Review Documentation for
“ShaperProbe: End-to-End Detection of ISP Traffic Shaping Using Active Methods” Authors: P. Kanuparthy, C. Dovrolis How common would you expect cross traffic to result on an empty token bucket and make it impossible for ShaperProbe to detect shaping?
Reviewer #1 Strengths: Traffic shaping is a timely problem; residential networking is interesting in general. The paper is relatively wellwritten. Collecting a taxonomy of service tiers is significant.
Reviewer #3
Weaknesses: Very mature work; references to a tech report that would seem to have the interesting components of the tool’s design; unsurprising conclusions and no clear statement about traffic shaping as good or evil. No experimentation into perapplication (or port) shaping.
Strengths: The paper presents a clear method to detect traffic shaping. A large data set is available to the authors. There is a comparison with ground truths. Weaknesses: This should have been a long paper: not enough details about the methodology (e.g. detection of C, the capacity) and not enough results shared (e.g. you got results about 5700 ISPs and you only discuss 4 ISPs. In how many ISPs did you detect traffic shaping?). The false positive rate claimed in the conclusion is not backed up by content in the paper. Where does the number come from?
Comments to Authors: This work is complete enough to get press coverage, therefore it is complete enough to have a full paper worth of submission and not be presented as an abstract of a longer tech report. It does not fit the description “Short papers (up to 7 two-column pages) can convey work that is less mature but shows promise, articulating a high-level vision, describing challenging future directions, critiquing current measurement wisdom or offering results that do not merit a full submission.”
Comments to Authors: I tried your tool. I liked it; it was simple and clear to use.
http://arstechnica.com/tech-policy/news/2011/05/newshaperprobe-tool-detects-isp-traffic-shaping.ars
You mentioned that the data collected is publicly available. Where is it? I couldn’t find the data. Maybe I missed something, you should make it more clear where it is located.
The one paragraph “ShaperProbe Implementation” section was most disappointing. To understand the quality of your tool, I don’t need an equation for the median (2.2); I do need a sense for the tradeoffs in parameters: what if I believe that the buckets are just too small for you to detect? How do you generate traffic at a truly constant rate? How do you filter? Submit the 12-14 pager; it might be more interesting. Conversely, perhaps your passive shaping detection method (conclusion section) would be a good topic for a 6 page submission.
You have a 14 page version on your homepage, you should have submitted it. This is mature work, and there are enough questions to answer and enough data for a full evaluation to fill up 14 pages. The 6 page paper skips a lot of them. What happens if the bucket size is really small? Wouldn’t you simply not detect traffic shaping with your methodology? In the intro, you mention “services up to 6 Mbps”. This is typically for DSL services and has nothing to do with traffic shaping. I wouldn’t make that third point.
Reviewer #2 Strengths: Interesting and timely topic; publicly release tool; real-world data; interesting findings.
You may want to better articulate the differences with Glasnot in the related work section
Weaknesses: Some graphs are a bit hard to read.
In the active probing method, you mention that Rs=C without explaining how you measure C and more importantly whether your method of measuring C could be influenced by traffic shaping in place or not. If some settings of traffic shaping could influence your detection of C, then you could have a lot of false negatives.
Comments to Authors: This is great work with almost everything one could ask for. I really appreciate you making the tool available to the Internet at large and collecting data from real users for your analysis. The presentation is also very well done; I only have some minor issues with some of the graphs in page 5 and 6. Fig. 4 and 7 are hard to parse; it would help if you could “read” one of them when you introduce them in page 4. You jump too quickly to the tables that summarize the data but the figures, if explained, offer an interesting perspective.
You don’t discuss enough the robustness of your tool to the impact of cross traffic. I am really pleased to see a parameter selection section! I like it. How can some burst last 5mn in traffic shaping environments on figure 3? Is that really traffic shaping?
480
Section 2, by having large $\Delta$ you will need long measurement time. How does the measurement time affect the accuracy of your estimations?
Your results section doesn’t discuss your millions of results from 5700 ISPs. You go through 4 ISPS as case studies. Case studies are great after you present your overall results which are missing. For instance, were all your cases of traffic shaping for cable providers (good point about DSL vs. cable)?
Section 2.1, The receiving rate highly depends on cross-traffic, not just the shapers. How does cross traffic affect the received rate, hence your estimations? I would like to see more evaluation of the method with regards to the cross traffic.
“non shaped runs”: while you say the distributions are similar. It is interesting to note that you see a step function for the capacity of the shaped traffic.
Section 2.3, You mention in Section 2.1 that $N_L$ and $n_R$ will be selected from the ISP data, but you do not actually explain how do you set these parameters in your measurements. Furthermore, you set the other parameters, e.g. $\gamma$, using data from some specific ISPs. You then use these parameter values for measurements on other networks. As networks are different, you should really change these parameters for different networks too.
The AT&T case study seems to be an issue where you include traffic from multiple ISPs (Mediacom). If that’s the case, why don’t you just present the results per ASN? This should solve the issue. AT&T would probably not use the same ASN for its own subscribers and for the subscribers of companies, such as Mediacom, buying transit from its tier 1 network. The false positive and false negative rates are important when presenting these kinds of results. You claim specific rates in the conclusion (less than 5%), yet you didn’t explain how you came up with these numbers.
Section 4.1, you mention that you verify your results with Comcast listings. Where are the results of the verification? In general, it is very hard to verify the results in Section 4 as groundtruth data is not available. You should consider cross validation. Using a subset of measurements for inference and another subset to validate the inference results.
Reviewer #4 Strengths: Reasonable tool and design. Lots of great data from the wild to work with. Confirmation of at least some of the results, which suggests that the tool is fairly accurate.
Section 5, where does the accuracy result come from?
Response from the Authors
Weaknesses: A more serious and extensive evaluation of the tool in a controlled setting would improve confidence in it, and help to better understand its weaknesses.
Regarding the ``long versus short paper’’ issue: there is indeed a longer version of this work that includes, first, more detail about the implementation of the tool, and second, a method to detect traffic shaping passively given packet-level traces. The passive estimation algorithm is significantly different than ShaperProbe, and its evaluation also follows a different approach. So, we decided to split the work in two papers: this IMC short paper and a second paper (passive detection) that will be published later. This short IMC paper cannot describe all the implementation details of ShaperProbe -- if we would include those details in a long paper, we suspect that most readers would find them uninteresting. Additionally, we note that it is not true that IMC short papers are not ``less mature’’ than long papers. IMC has published many short but mature research papers in the last few years, which is great. Not every significant research contribution requires 12 pages.
Comments to Authors: Fun paper. I’ve used the tool a couple different times in the past (it wasn’t able to detect known shaping in my campus network, fwiw). I like the presentation of results in the form of case studies. In most cases it appears that shaperprobe detects the right thing, but there are clearly some fraction of runs in which the tool is wrong. It would have been nice to have some experiments in a controlled setting using “real” routers and other devices, along with some cross traffic, to get a better sense of the tool’s limitations. The minimal Linux experiments are nice, but aren’t terribly enlightening since they’re run in a setting in which you don’t have control to create conditions that could be problematic for the tool, e.g., congestion somewhere on the path that might cause a level shift-like event.
We have revised the paper to address the presentation problems that the reviewers identified. Additionally, we have added a bit more information in Section 3 about how the tool works.
Reviewer #5 Strengths: A method to detect and infer the parameters of “token bucket” mechanism employed in most of today shapers. Analysis of a large scale measurement of the tool that provides interesting information about today’s networks.
There are also some comments that we could not address (e.g., additional validation results or a more thorough study of the robustness with respect to cross traffic). Due to space constraints, we focus here on two comments that appear in several reviews: (1) It is true that if the token bucket is too small we may not be able to detect it. However, such a traffic shaper would not make much performance difference at the first place. In practice, we see that Cable-access ISPs typically use a bucket size of at least 510MB, and ShaperProbe can detect that. (2) If the path has significant cross traffic, ShaperProbe will abort the measurements (because it will detect packet losses). So, even though it is true that cross traffic can cause the token bucket to be non-full, ShaperProbe will avoid producing erroneous results in that case.
Weaknesses: The method is susceptible to cross traffic. More extensive evaluation of the tool under different cross-traffic settings is needed. Comments to Authors: I like the idea of detecting and inferring parameters of the packet shapers. Your effort in implementing and performing large scale validation of your tools is commendable. Below are detailed comments.
481