Although microarray-based expression ... Expression profiling of archival renal tumors by quantitative ... Roswell Park Cancer Institute, Buffalo, NY, USA ... Optimal reference genes for calculating normalization factors for RT-PCR were. ACTB ...
Short Technical Reports Expression profiling of archival renal tumors by quantitative PCR to validate prognostic markers Sean T. Glenn, Craig A. Jones, Ping Liang, Dharam Kaushik, Kenneth W. Gross, and Hyung L. Kim Roswell Park Cancer Institute, Buffalo, NY, USA BioTechniques 43:639-647 (November 2007) doi 10.2144/000112562
Formalin-fixed paraffin-embedded (FFPE) tissues are routinely stored by most pathology departments and are a widely available resource for discovery of clinically useful biomarkers. We describe our method for optimizing quantitative reverse transcription PCR (RT-PCR) for expression analysis using frozen and archival tissue. Commonly used reference genes were evaluated for stability of expression in normal kidney and clear cell renal cell carcinoma (RCC). Optimal reference genes for calculating normalization factors for RT-PCR were ACTB, RPL13A, GUS, RPLP0, HPRT1, and SDHA when using FFPE RCC. The optimal reference genes when using frozen RCC were ACTB, RPL13A, and GUS, confirming that use of multiple reference genes improves accuracy when intact RNA from frozen renal tumors are used. Expression of 16 markers previously reported to have prognostic significance in RCC was determined in 23 matching frozen and FFPE renal tumors, representing a range of tumor grades and stages; correlation coefficient for expression measured in frozen and FFPE tumors was 0.921 (P < 0.001). All markers predicted survival when frozen tumors were used and 14 of the 16 markers predicted survival when FFPE tumors were used as the source of RNA. An optimized RT-PCR assay can accurately measure expression of most prognostic tumor markers.
INTRODUCTION The prognosis associated with renal cell carcinoma (RCC) can vary widely. Small, incidentally diagnosed renal tumors can be observed safely for many years in patients who are poor surgical candidates (1). Larger, high-grade tumors carry risk of recurrence, which may be as high as 50%, following re-section of a clinically localized tumor (2). Accurate determination of prognosis using molecular markers may be useful for patient counseling and selecting treatment. However, there are no molecular markers of prognosis in routine clinical use for patients with RCC. Although microarray-based expression profiling studies have identified a large number of potentially prognostic markers, a barrier to development of molecular test for clinic use has been the lack of readily available clinical samples for validation of candidate markers. Frozen tumor libraries are costly to establish and maintain. However, Vol. 43 ı No. 5 ı 2007
formalin-fixed paraffin-embedded (FFPE) tissues are routinely archived and stored by pathology departments. Therefore, FFPE tumor samples are widely available and can be annotated with clinical information. We describe steps for optimizing and validating a quantitative reverse transcription (RT-PCR) assay for expression profiling of FFPE RCC. We evaluate commonly used reference genes for stability of expression in RCC and determine the optimal number of reference genes necessary to calculate normalization factors when using frozen or archival tissue. We validate the assay by comparing expression values measured in frozen and archival tissue. Finally, we validate individual prognostic markers for use with archival tissue. These validated markers can be used in large-scale clinical studies, which are required before a marker can be recommended for clinical use. This approach can be applied across tumor types to develop assays for testing prognostic markers using archive tissue.
MATERIALS AND METHODS Patient Selection and Overall Study Design To identify reference genes with stable expression in renal tissue, 20 pairs of clear cell RCC and adjacent normal kidney were used. An equal number of low-grade (Fuhrman grade 1 and 2) and high-grade (Fuhrman grade 3 and 4) tumors were represented. Matching pairs of frozen and FFPE, clear cell renal tumors from 23 patients were utilized to validate reference genes identified for use with FFPE renal tumors. All tissue samples were procured between 2002 and 2006 and were retrieved from the Department of Pathology following approval by the Institutional Review Board (EDR 53605). Commonly used reference genes (GUS, TFRC, TBP, RPLP0, ACTB, HPRT1, SDHA, B2M, and RPL13) (3,4) were evaluated for stable expression in renal tumors. RNA Extraction For extraction of RNA from FFPE tissue, four 10-μm sections were cut from archival block. Excess paraffin was trimmed using a scalpel cleaned with RNaseZAP (Ambion, Austin, TX, USA), and the sections were placed in 1.5-mL RNase-free Eppendorf tubes. Sections were treated twice with 1 mL xylene for 30 min at 55°C while rocking. The sections were washed twice with 100% ethanol. RNA was extracted from the paraffin samples using the MasterPure kit (Epicentre Biotechnologies, Madison, WI, USA). For frozen tissue, 0.5 g snap-frozen tissue was homogenized in TRIzol and placed in a 1.5-mL RNase-free Eppendorf tube. RNA was then extracted using the TRIzol protocol (Invitrogen, Carlsbad, CA, USA). RNA from both FFPE and frozen tissue was then treated with DNase I for 30 min. The samples were checked for residual genomic DNA by TaqMan RT-PCR for ACTB. If there was measurable DNA after 35 PCR cycles, the samples were treated with DNase I for an additional 30 min, and the assay for residual DNA was repeated. www.biotechniques.com ı BioTechniques ı 639
Short Technical Reports
The final RNA concentration (A260:0.025) and purity (A260:A280 ratio) was measured using a NanoDrop ND-1000 spectrophotometer (NanoDrop Technologies, Wilmington, DE, USA). RNA quality was assessed for 28S and 18S ribosomal degradation using a 2100 Bioanalyzer and an RNA 6000 Nano LabChip kit (both from Agilent Technologies, Santa Clara, CA, USA). Reverse Transcription and TaqMan PCR Reverse transcription was performed in an Applied Biosystems 2720 thermal cycler using the cDNA Archive kit (Applied Biosystems, Foster City, CA, USA). The reaction was performed according to manufacturer’s recommendation, using random primers and 1 μg total RNA. When utilized, gene-specific primers were included at 100 nmol/L for each gene. Gene-specific primers were designed using PerlPrimer v1.1.6 (perlprimer. sourceforge.net). All TaqMan primers and probes were custom designed using Primer Express, version 2.0 (Applied Biosystems), and appropriate mRNA consensus sequence from the NCBI Entrez nucleotide database.
PCR product sizes were limited to 100 bases in length. TaqMan probes were labeled with 5′-FAM as a reporter and 3′-TAM as a quencher. All oligonucleotides and probes were supplied by Integrated DNA Technologies (Coralville, IA, USA). Expression of each gene was measured in 25-μL reactions using TaqMan Universal PCR Master Mix (Applied Biosystems), 5 ng cDNA, 900 nM each primer, and 250 nM probe. The PCR was carried out using a MyiQ Real-Time PCR Detection system (Bio-Rad Laboratories, Hercules, CA, USA), and cycling conditions were as follows: 50°C for 2 min and 95°C for 10 min for 1 cycle; 95°C for 15 s and 60°C for 1 min for 45 cycles. To compare gene expressions between samples, the threshold cycle (CT) was normalized using the mean CT for reference genes. The normalized mRNA level (expression as log2 with arbitrary unit) was defined as
∆CT = CT (test gene) - CT (mean for the reference genes). All reactions were performed in triplicate, and results were averaged.
A
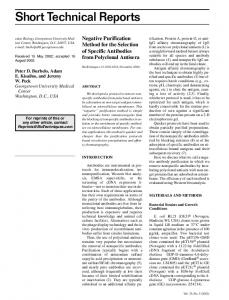
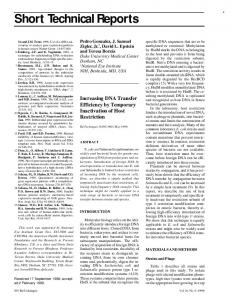
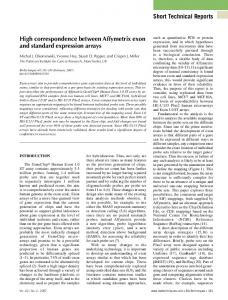
Figure 1. Denaturing RNA microcapillary electrophoresis. One microliter (approximately 220 ng) total RNA extracted from renal tumors was analyzed using an Agilent 2100 Bioanalyzer and RNA 6000 NanoChip. Lane 2 is a water control. Lanes 3–5 contain RNA from three representative frozen renal tumors, and lanes 6–8 contain RNA from three representative FFPE renal tumors. The RNA from FFPE tissue is degraded and does not have detectable 28S and 18S ribosomal RNA bands. 640 ı BioTechniques ı www.biotechniques.com
Each 96-well plate included a control reaction using a previously characterized cDNA and marker. Data Analysis C T values were recorded in Microsoft Excel 2003 for calculation of expression. Reference genes were evaluated using the freely available geNorm software, version 3.4 (medgen.ugent.be/genorm). geNorm is a Visual Basic applet for Microsoft Excel that calculates a gene expression stability measure M for a reference gene as the average pairwise variation for that gene with all other reference genes and allows ranking of genes according to stability of expression (5). This method produces similar results when compared with a strategy that ranks reference genes based on the standard deviation of the log-scaled expression levels (6). To determine the optimal number of reference genes, a pairwise variation V is calculated when a sequentially increasing number of reference genes are used. A large V indicates that the added gene should be included for calculation of the normalization factor. A V < 0.15 was used to determine the
B
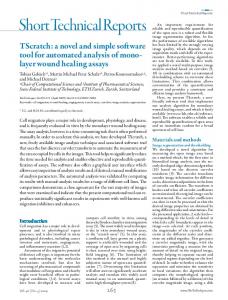
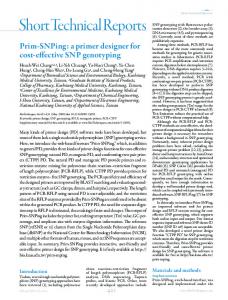
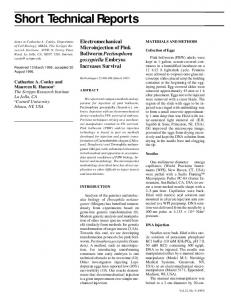
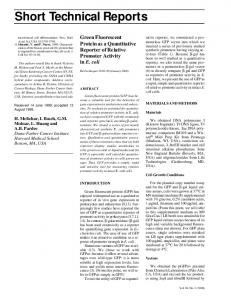
Figure 2. Determination of the optimal reference genes for normalization of gene expressions. (A) Nine reference genes ranked based on stability of expression in renal tumors and normal kidneys. TaqMan PCR analysis was performed for nine reference genes using total RNA extracted from 20 frozen clear cell renal carcinomas (10 high grade and 10 low grade) and adjacent normal kidneys. The geNorm software, version 3.4 calculates a gene expression stability measure M for a reference gene as the average pairwise variation for that gene with all other reference genes, and allows ranking of genes according to stability of expression. RPL13A and ACTB were the most stable genes and TFRC was the least stable gene. (B) Determination of the optimal number of reference genes for expression analysis using formalin-fixed paraffin-embedded (FFPE) renal tumors. TaqMan PCR was performed for nine reference genes using total RNA extracted from five FFPE renal tumors. The geNorm software calculates a pairwise variation V for each sequential increase in number of reference genes. A large V indicates that the added gene should be included for calculation of the normalization factor. A cutoff of 0.15 was used to determine the optimal number of genes. Therefore, adding a seventh reference gene is not necessary and the optimal number of reference genes is six. Vol. 43 ı No. 5 ı 2007
Short Technical Reports
optimal number of reference genes. For survival analysis, disease-specific survival was the end point, and expression status was the covariate for the logrank analysis. Graphs and Pearson correlation coefficients were generated using Stata 8 (College Station, TX, USA), and a two-sided P value of 0.05 was considered statistically significant.
Table 1. Reference Genes Evaluated Gene Symbol
GUSB
NM_000181
Sequence
Forward:
5′-CTCATTTGGAATTTTGCCGATT-3′
Reverse:
5′-CCGAGTGAAGATCCCCTTTTTA-3′
Probe:
5′-TGAACAGTCACCGACGAGAGTGCTGG-3′
Forward:
5′-GCTTTCCCTTCCTTGCATATTC-3′
Reverse:
5′-GGTGGTACCCAAATAAGGATAATCTG-3′
Probe:
5′-AATCCCAGCAGTTTCTTTCTGTTTTTGCGA-3′
Forward:
5′-GCCCGAAACGCCGAATA-3′
Reverse:
5′-CGTGGCTCTCTTATCCTCATGA-3′
Probe:
5′-CCCAAGCGGTTTGCTGCGGT-3′
Forward:
5′-CCAGCTCACCATGGATGATG-3′
Reverse:
5′-ATGCCGGAGCCGTTGTC-3′
Probe:
5′-TATCGCCGCGCTCGTCG-3′
Forward:
5′-TGAGTGCTGTCTCCATGTTTGA-3′
Reverse:
5′-CCACCTCTAAGTTGCCAGCC-3′
Probe:
5′-TCCTAGAGCTACCTGTGGAGCAACCTGC-3′
Forward:
5′-ACCAACCCTTCCCGAGGC-3′
Reverse:
5′-TTGGTTTTGTGGGGCAGCAT-3′-3′
Probe:
5′-CCTCGCACGGTCCGCCAGAAGATG-3′
Forward:
5′-AGGAATCAATGCTGCTCTGGG-3′
Succinate Dehydrogenase
Reverse:
5′-GTCGGAGCCCTTCACGGT-3′
Complex, Subunit A
Probe:
5′-AATGCCACCTCCAGTTGTCCTCCTCCA-3′
Forward:
5′-ATGGACAGGACTGAACGTCTTG-3′
Hypoxanthine
Reverse:
5′-GCACACAGAGGGCTACAATGT-3′
Phosphoribosyltransferase 1
Probe:
5′-TGGCCTCCCATCTCCTTCATCACATCTC-3′
Forward:
5′-CCACGCTGCTGAACATGCT-3′
Reverse:
5′-TCGAACACCTGCTGGATGAC-3′
Probe:
5′-AACATCTCCCCCTTCTCCTTTGGGCT-3′
β-Glucuronidase
TFRC
NM_003234
Transferrin Receptor
TBP
RESULTS AND DISCUSSION
TATA Box Binding Protein
Quantitative RT-PCR allows measurement of gene expression. RNA is extracted from tumor tissue and converted to cDNA. Hundreds of reactions can be performed and analyzed simultaneously on multiwell plates, allowing large numbers of cases to be rapidly assessed. The assay has a wide dynamic range, making it suitable for validation of disease related markers identified by microarray-based genomic profiling studies. Previously described expression profiling assays for RCC have relied on high-quality RNA extracted from fresh, frozen tumors. Paik et al. first described expression profiling for use in clinical practice using TaqMan RT-PCR and archival breast tumors (7). Two key features of their assay allow accurate quantification of gene expression using degraded RNA. PCR primers were designed to produce short products, and multiple reference genes were utilized to normalize expression results. As shown in Figure 1, total RNA extracted from frozen RCC had sharp 28S and 18S ribosomal RNA bands. However, RNA from FFPE tumors was degraded and had no ribosomal RNA bands. Therefore, others have reported using primers located immediately upstream to the PCR product in order to optimize the synthesis of cDNA (7). TaqMan PCR results were compared using cDNA synthesized with random oligonucleotide primers with or without gene-specific primers. The use of gene-specific primers did not affect the RT-PCR results when used with RNA from FFPE tumors