Short Term Trading Strategy Based on Chart Pattern Recognition and Trend Trading in Nasdaq Biotechnology Stock Market Saulius Masteika Vilnius University, Faculty of Humanities, Muitines 8, 44280 Kaunas, Lithuania
[email protected]
Abstract. The main task of this paper is to show the results of stock market trading strategy based on short term chart pattern. Proposed short term chart pattern is a trend following pattern and is relative to fractal formations and chaos theory. The proposed trading strategy consists of two steps: on the first step the stock screening algorithm is used to select volatile stocks in Nasdaq Biotechnology market; on the second step technical analysis and mathematical calculations for selected stocks are applied and profitability of strategy is calculated. The proposed trading strategy based on short term chart pattern was tested using historical data records from the USA Nasdaq Biotechnology market (2008-2010). The trading strategy applied in Biotechnology stock market had given higher returns if compared to the main USA stock market indexes (Dow Jones, S&P, Nasdaq).
1 Introduction When taking decisions in the stock markets, investors rely on various criteria. Two main directions of market analysis are distinguished. One is fundamental analysis, based on financial indicators the other is technical analysis, based on historical data of price changes [8, 10]. With the increasing use of computerized technologies and diminishing trust in financial reports of enterprises, technical analysis is increasingly applied for market analysis [12]. Chart pattern is a part of technical analysis. A chart pattern is a distinct formation on a stock chart that creates a trading signal, or a sign of future price movements. There are two types of patterns within this area of technical analysis, reversal and continuation. A reversal pattern signals that a prior trend will reverse upon completion of the pattern. A continuation pattern, on the other hand, signals that a trend will continue once the pattern is complete [15]. Continuation pattern is used in volatile and unstable markets where there can be many overreactions, which cause the market movement trends to last longer than anticipated [9, 11, 13]. Typically the time required to build chart pattern varies from 5 till 60 periods [1, 7]. In these days’ unstable economic environment and volatile markets the decision was made, that it is less risky to use short term trend trading strategies which in case of a sudden change in the market behavior can cause the adequate reaction. The main goals of this article is to present a newly build trading strategy based on short term continuation pattern, to formalize it and to show the results of experimental W. Abramowicz, R. Tolksdorf, K. Węcel (Eds.): BIS 2010 Workshops, LNBIP 57, pp. 51–56, 2010. © Springer-Verlag Berlin Heidelberg 2010
52
S. Masteika
investigations in a volatile stock market. The method of formalization of chart pattern was chosen from previous research [7].
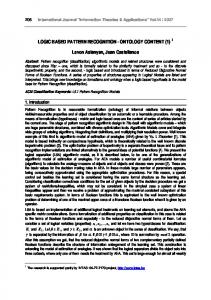
2 Basic Concept of the Proposed Short Term Trading Strategy The proposed short term trading strategy is based on trend following chart pattern. Proposed chart pattern is relative to fractal indicators, presented by Ph.D. Bill M.Williams [2, 3]. The fractal indicator is build from chart bars and is used to determine when there is continuation in the market. There are many forms of fractals. That fact makes many uncertainties when using this indicator. The proposed chart pattern with 3 periods lets increase prediction sharpness because of ignoring older data information. Generalizing the proposed short term trading strategy one can be stated that the trading system looks for securities with the biggest price increases; if the trend of increase is confirmed, such securities are bought. 2.1 Chart Pattern Used for Trading Strategy The block scheme of the identification algorithm of the chart pattern is provided in the next figure:
Fig. 1. Block scheme of the identification algorithm of chart pattern
The algorithm uses the FOR cycle, which allows to identify the formed signals in the period i. The cycle starts from i=3, because the data of the previous periods i-2 and i-1 are necessary for the identification of the signal. The cycle ends with variable N, which determines the last period of experimental investigation. If there are no open positions and the variable Poz is equal to zero (block 4), a signal of buying is sought.
Short Term Trading Strategy Based on Chart Pattern Recognition
53
The signal of buying is formed by checking whether the highest price H of period i-2 is higher or equal of the highest price H of period i-1 (block 6). If so, further check is carried – whether the period’s i opening price O is lower or equal to the highest price H of period i-1 (block 9). If the condition O[i]