Abstractâ The Short Time Fourier Transform (STFT) and the. Continuous Wavelet Transform (CWT) of accelerometer signals measured in patients with epilepsy ...
Belgian Day on Biomedical Engineering IEEE/EMBS Benelux Symposium
December 7-8, 2006
Short Time Fourier and Wavelet Transform for Accelerometric Detection of Myoclonic Seizures Tamara M.E. Nijsen1,2 , Pierre J.M. Cluitmans1 , Paul A.M. Griep2 , Ronald M. Aarts1,3 1
Eindhoven University of Technology, Department of Electrical Engineering, Eindhoven, The Netherlands 2 Epilepsy Centre Kempenhaeghe, Department of Clinical Neurophysiology, Heeze, The Netherlands 3 Philips Research Laboratories, Eindhoven, The Netherlands the choice of features and much less on the complexity of the type of classifier [2]. Therefore we focus on suitable features rather than on classification methods. In ACM-literature the choice for features depends on the type of activities the authors aim to detect. For distinguishing between normal daily activities, such as sitting, standing, lying, and movement in general, statistical properties of the amplitude of the signal such as mean an standard deviation seem to be effective [3]. When distinguishing between various complex movement patterns, features derived from time-frequency measures such as the short-time Fourier transform [4], or a wavelet transform, [5] are also applied. In this work time-frequency properties of myoclonic seizure patterns in accelerometer signals are studied. A comparison is made between the Short Time Fourier Transform (STFT) and the Continuous Wavelet Transform (CWT) to derive salient features for seizure detection. First, the most important characteristics of the myoclonic seizures are represented in an artificial signal. Second, real patient data are analyzed, after we come to understand how these important properties are reflected in the time-frequency measures. The insight gained in this way is used to derive features for myoclonic seizure detection. Third, this approach is evaluated by testing four feature sets for both STFT and CWT in a discriminant analysis setup on a subset of the clinical data.
Abstract— The Short Time Fourier Transform (STFT) and the Continuous Wavelet Transform (CWT) of accelerometer signals measured in patients with epilepsy are analyzed. Characteristics of the spectrogram and scalogram are studied in order to get more insight in how these transforms might be useful to derive suitable features for myoclonic seizure detection. First some artificial elementary patterns that represent some main characteristics of the patterns observed during myoclonic seizures and other movements, are studied. Second the analysis is performed on real patient data. Information from the analysis is used to motivate the use of certain features for detection of myoclonic seizures. Third, for both the STFT and the CWT four feature sets are evaluated in a linear classification setup. Incorporating knowledge from our analysis leads to better detection results than using the spectral power / wavelet coefficients as feature without incorporating this knowledge. This preliminary study shows that both the STFT and the CWT can be valuable for feature extraction for detecting myoclonic seizures. The STFT is more susceptible for false detections.
I. I NTRODUCTION Detection of seizures in institutionalized people with refractory epilepsy contributes to the management of daily care. Detections can be used to trigger an alarm during seizures that might be harmful to the patient, but also the detection of smaller, subtle seizures can be important for diagnostic purposes, for example to get more insight in the patients behavior or to titre anti-epileptic drugs. Previously we reported the potential value of accelerometry for detecting seizures that have movement as the most important clinical manifestation, so called motor seizures [1]. We found that 74% of the motor seizures detected, consisted of characteristic myoclonic waveforms in 3-D accelerometer (ACM) signals. Myoclonic seizures typically show a short, shock-like waveform in the ACM-signal. Because the clinical manifestation of myoclonic seizures is very subtle, they are often missed by the current available detection systems. There is a clinical importance of detecting these subtle seizures. Often a patient has many myoclonic seizures during the night and thus the sleep rhythm can be disturbed. Severe motor seizures are often preceded by myoclonic seizures and thus the detection of myoclonic seizures could be used for early warning. In our detection setup, we employ a supervised learning approach and thus appropriate features and classifier need to be chosen. Experience from more explored research areas, such as speech and audio, shows that the success of classification critically depends on Belgian Day on Biomedical Engineering IEEE Benelux EMBS Symposium
II. M ETHODS A. Short Time Fourier Transform The short time fourier transform of signal x(t)is defined by: Z ST F Th [x](t, ω) = x(τ )h∗ (t − τ )ejωτ dτ , (1) where h(t) is a window function and ∗ denotes the complex conjugation. As output the spectrogram is analyzed: SPh [x](t, ω) = |ST F Tx (t, ω)|2 .
(2)
For h(t) a Hanning window is chosen, since this is often used with good results. A myoclonic seizure can last shorter than one second, therefore a large time resolution is desirable. The sample frequency of the ACM-signals used is 100 Hz, this limits the choice for a window length. A window length of 50 samples is chosen. This corresponds to a frequency resolution of 2 Hz. We compare the STFT to the Continuous Wavelet 1
155
December 7-8, 2006
Belgian Day on Biomedical Engineering IEEE/EMBS Benelux Symposium
December 7-8, 2006
A acceleration (g)
Transform. Because we perform the CWT with a shift of 1 sample, this shift of 1 sample is also used with the STFT. B. Continuous Wavelet Transform The continuous wavelet transform (CWT) of a signal x(t), at the scale a and position t is defined as: µ ¶ Z 1 t−τ ∗ CW Th [x](t, a) = √ x(τ )h dτ (3) a a
1 myoclonus
0
−0.1 0
0
1
2
3
4
5
−1 0
1
2
acceleration (g)
C
where h(t) is the wavelet √base and ∗ denotes the complex conjugation. The factor 1/ a is used for energy normalization. While the STFT uses a single analysis window, the wavelet transform uses short windows for analyzing high frequencies and long windows for analyzing low frequencies. As output, the absolute wavelet coefficients are plotted in a scalogram: Sch [x](t, a) = |CW Tx (t, a)| .
B
0.1
(4)
3
4
5
2 3 4 time (s)
5
D
0.2
1 0.5
0 0 −0.2 0
1
2 3 4 time (s)
−0.5 5 0
1
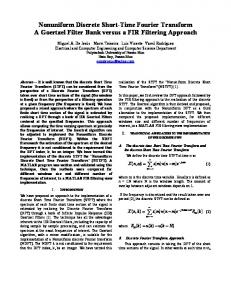
Fig. 1. A isolated myoclonic waveforms. B myoclonic waveform in sequence with other pattern. C Slow movement. D Non-myoclonic waveforms containing sharp peaks .
The output is calculated for scales 2–256. This choice is made because the lower boundary for frequencies in normal movements is approximately 0.3 Hz [6]. The scale of 256 corresponds to a frequency of 0.26 Hz. For analyzing real patient data the fifth member of the Daubechies wavelet is used. We motivate this choice by the typical shape of a myoclonic waveform that is depicted in Fig. 1. A myoclonic seizure is a twitch like contraction of an antagonistic muscle pair. After the seizure the limb suddenly stops. This suddenly stopping results in a sharp peak in the ACM-signal. The myoclonic waveform is asymmetric and seems to damp out exponentially at the end.
amplitude (g)
6
4. sine (16 Hz)
2. block
6. damped sine (8 Hz)
4 2 0 −2 −4
3. sine (2 Hz)
1. pulse
−6 0
5
10
5. sum sines
15
20
25
time (s)
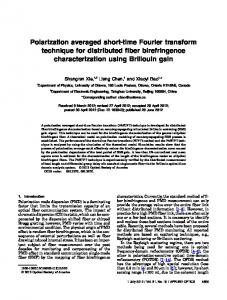
Fig. 2.
Artificial signal s(t) with elementary patterns.
C. Elementary patterns at least one seizure—according to experts who inspected both video and EEG registrations—and one randomly chosen episode containing a non-seizure movement. The total duration of both episodes together is 5 minutes. Three experts marked the periods that they consider movement and which of these movements are a myoclonic seizure. For the analysis in this paper, data segments of five seconds are chosen. All the myoclonic seizures are used (10), and per patient two nonmyoclonic patterns are chosen. Myoclonic seizures often occur isolated on only one 3-D sensor. In this study we only include the sensor where the myoclonic seizure is dominantly visible. Then from this dominant sensor only the x-direction is used.
Figure 1 shows examples of ACM-signals measured during myoclonic seizures and normal movements. Myoclonic seizure patterns have a short duration (0.5 - 2 s). They contain a sharp peak that damps out. They occur isolated (Fig. 1 A) or in a sequence of other movement patterns (Fig. 1 B). Normal movements have various appearances. They can be slow and block-like (Fig. 1 C), or contain sharp peaks in sequences of slow and rhythmic patterns (Fig. 1 D). To get more insight in the STFT and CWT on real patient data we first perform our analysis on an artificial signal s(t) that incorporates the characteristics mentioned above. s(t) consists of a pulse (shock-like, sharp peaks), a block during 1 second (block-like), a sinusoid (2 Hz) during 1 second (rhythmic), a sinusoid (16 Hz) during 1 second (shock-like, sharp peaks, rhythmic), the sum of these two sinusoids and a sinusoid (8 Hz) that damps out (Fig. 2).
E. Detection performance of feature sets based on analysis outcome The outcome of the analysis in subsection II-D is used to make a good choice for features for detecting myoclonic seizures. For both the STFT and the CWT, four feature sets are evaluated using Fisher’s linear discriminant analysis. The data is divided into train and test sets. Six test are performed where all of the data, except the movement that is used for testing, is used for training. Three of the six test samples contain a myoclonic seizure. The performance per feature set is expressed in the percentage of myoclonic seizures detected (SEN ), the number of false detections (F D) and the ratio
D. Real patient data ACM-data are used from seven mentally retarded patients who suffer from severe epilepsy. The patients are monitored with the setup described in our previous clinical study [1], with five 3-D sensors placed on the limbs and the sternum. The sample frequency fs of the ACM-signals is 100 Hz. For each patient two nocturnal data episodes are chosen. For each patient two data episodes are chosen: one episode containing Belgian Day on Biomedical Engineering IEEE Benelux EMBS Symposium
2
156
December 7-8, 2006
Belgian Day on Biomedical Engineering IEEE/EMBS Benelux Symposium
December 7-8, 2006
A. Spectogram, isolated myolconus
A
between correct detections and all detections, the positive predictive value (P P V ).
A. Spectogram, myoclonus before other movement
B
4
III. R ESULTS
1 20
0 0
A. Time-frequency representations of artificial signal
frequency (Hz)
frequency (Hz)
1.5 40
0.5
0.4
0.2
50
0.1 1
2
3
scale
scale
100
0
1 1
200
0.3
150
2
0 2 3 4 time (s) B. Continuous Wavelet Transform, myoclonus before other movement 1 250
2 3 4 time (s) B. Continuous Wavelet Transform, isolated myoclonus
200
3
20
0 0
1
250
Figure 3 shows the spectrogram and the scalogram of the artificial signal as shown in Figure 2.
40
150
0.5
100 50
4
0
1
2
time (s)
5 10 15 20 time (s) B. Continue Wavelet Transform
0
2 1
2 3 4 time (s) B. Continuous Wavelet Transform, slow normal movements 250
1
0.4
150
0.3
100
0.2
0
0.1 1
2
3 time (s)
0
4
0
4 40 3 2
20
1 0 0
0
200
50
3
4
A. Spectogram, normal movement with peaks
D frequency (Hz)
frequency (Hz)
3
20
0 0
25
250 200 150 100 50
40
scale
20
scale
frequency (Hz) scale
4
25 20 15 10 5
40
0 0
A. Spectogram, slow normal movements
C
A. Spectogram
3 time (s)
2 3 4 time (s) B. Continuous Wavelet Transform, normal movement with peaks 250 1.4 1.2 200 1 150 0.8 0.6 100 0.4 50 0.2 0
1
1
2
3
4
time (s)
2 1 5
10
15 time (s)
20
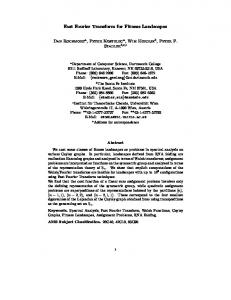
Fig. 4. Time-frequency representations of: A. isolated myoclonic signal, B. normal movement that is preceded by a myoclonic seizure, C. slow normal movement, D. normal movement with sharp peaks
25
Fig. 3. A. Spectrogram of artificial signal. B. Scalogram of artificial signal.
from 4 to 10 Hz in all the seizures. The frequency where the most power is concentrated lies for all seizures in a range of 4–6 Hz. For the scalogram the observations are similar, the coefficients with the highest values lie in the 8–60 range of scales. The scale where the coefficients are maximal lies for all the seizures in a range of 9–39. 2) Myoclonic seizures in other movements: When a myoclonic seizure is not isolated we see that the myoclonus still has an isolated shape and frequency range (Fig. 4 B). The original ACM-signal that belongs to this output is depicted in Fig. 1 B. Again the spectral power of this myoclonic seizures mainly lies between 4 and 10 Hz. For the normal movements, the power is higher for all frequencies, but there is relatively more power in the lower frequency band (0–2 Hz). In the scalogram we see again that during the myoclonic seizure the coefficients with the highest values lie in the 8–60 range of scales. During the normal movements we see high coefficient values in a wide range of scales up to scale 256. At the higher scales we see an overlap between the seizure pattern and the normal movement pattern. 3) Slow normal movements: Fig. 4 C shows a typical output for slow normal movements, 6 of our total 14 non-myoclonic movements belong to this category. The original ACM-signal that belongs to this output is depicted in Fig. 1 C. Most of the power in the spectrogram is concentrated beneath 2 Hz. In the scalogram we see the highest values in the scales ranging from 74–256. 4) Sharp peaks in other movements: Fig. 4 D shows a typical picture for normal movements with sharp peaks. The original ACM-signal that belongs to this output is depicted in Fig. 1 D. In the spectrogram high power values up to 30 Hz occur during these peaks. In the scalogram high coefficient values occur in the lower scales 1–10. Thus these peaks seem to differ from the peaks in myoclonic seizures. They have a broader frequency pattern, more like a pulse. They have
1) Pulse: The STFT of a pulse results in a flat spectrum in the time window where the pulse occurs. This is clearly visible in the spectrogram. All frequencies are present when the pulse occurs. In the scalogram the coefficients with the highest value occur at the lowest scale since this is the scale which the pulse shows the highest correlation to the wavelet used. 2) Block: The spectrogram of the block contains mainly low frequencies in the time window where the block occurs. Only in the beginning of the block-event there are more higher frequencies, since the signal that is in the time window then more resembles a pulse. In the scalogram we see coefficients with high values at higher scales. 3) Sinusoid: The STFT of a sinusoid of frequency ω gives a clear peak in the spectrogram at the corresponding frequency in the time window where the sinusoid occurs. In the scalogram, there is a restricted area of higher coefficient values around the scale that corresponds to a frequency of respectively 2 and 16 Hz (scale 33 en 4). This since the shape of the wavelet then corresponds the most to the shape of the sinusoids. For the sum of sinusoids we see a composition of the two single sinusoids in both the spectrogram and scalogram. 4) Damped sinusoid: For the damped sinusoid the observations are the same as with the undamped sinusoids, only the spectral power / wavelet coefficients are damped in time. B. Time frequency representations of seizure patterns The movements in our data set can be divided into 4 groups. 1) Isolated myoclonic waveforms: Fig. 4 A shows a typical output for isolated myoclonic waveforms, eight of our total ten myoclonic seizures belong to this category. The original ACMsignal that belongs to this output is depicted in Fig. 1 A. There is a clear distinct area in the spectrogram. Frequencies range Belgian Day on Biomedical Engineering IEEE Benelux EMBS Symposium
3
157
December 7-8, 2006
Belgian Day on Biomedical Engineering IEEE/EMBS Benelux Symposium
December 7-8, 2006
higher wavelet coefficients at lower scales, also more like a pulse. Whereas myoclonic seizures have a more isolated frequency pattern (4–10 Hz) and higher wavelet coefficients in an isolated range of scales 8–60, more like a sinusoid, or a sum of sinusoids.
IV. C ONCLUSION AND D ISCUSSION In this paper we describe a preliminary study about the use of the Short Time Fourier Transform and the Continuous Wavelet Transform for detecting myoclonic seizures in accelerometry data. Based on the graphical representations of the STFT and CWT both time-frequency measures seem to be useful for feature extraction since we can see a difference between myoclonic seizures and other movements in the spectrogram and the scalogram. During myoclonic seizures the most of the spectral power is in the 4–10-Hz range and there is an isolated spot visible in the spectrogram. This corresponds to high values in the wavelet coefficients at scales 8–60. Normal movements have most of their spectral power in the 0–2 Hz range. This corresponds to the findings of Bouten et al. [6]. For the CWT, we see that the wavelet coefficients have the highest values in the scales above 74. In normal movements sometimes also sharp waveforms occur but then we still see differences with the myoclonic pattern. The sharp peaks in normal movements have a broader frequency pattern (up to 30 Hz), and they have higher wavelet coefficients at lower scales (1–10). We also found that it is better to look at normalized values in stead of pure powers or coefficients. The feature sets that are based on the normalized STFT and CWT perform better than without the normalization. Furthermore adding the information about selected frequency ranges and scales increases the performance even more. The STFT seems to be more susceptible for false detections. In our detection approach we aim incorporating as many knowledge in the feature extraction process, thus creating very powerful features. Further research will be done to refine and optimize this approach.
C. Motivations for feature choices From the above observations we conclude that it is possible to distinguish between myoclonic and other patterns, when looking to the 2–10-Hz frequency range or scales 8– 60 and 74–265. We also suggest that in choosing features for detecting myoclonic waveforms, it would be better to look at the ratio between the different spectral powers / wavelet coefficients instead of using features derived from the pure coefficients. The great variance in amplitudes makes the pure powers/coefficients not sufficient. We evaluate four feature sets for both the STFT and the CWT. 1) All powers or coefficients (STFT or CWT). 2) Range of powers or coefficients based on the analysis outcome (ST F T+ or CW T+ ). 3) Normalized powers or coefficients (ST F Tn or CW Tn ). 4) Range of normalized powers or coefficients based on the analysis outcome (ST F T+n or CW T+n ). The normalization of the spectral powers and wavelet coefficients is performed in the following way: SPh [x](t, ω) N SPh [x](t, ω) = 50 (5) P SPh [x](t, ω) ω=0
N SCh [x](t, a) =
SCh [x](t, a) 256 P a=2
(6)
SCh [x](t, a)
R EFERENCES
D. Detection results Table I shows the performance for each feature set. Using
[1] T. Nijsen, J. Arends, P. Griep, and P. Cluitmans, “The potential value of 3-D accelerometry for detection of motor seizures in severe epilepsy,” Epilepsy and Behavior, vol. 7, pp. 74–84, 2005. [2] M. McKinney and J. Breebaart, “Features for audio and music classification,” 4th International Conferences on Music Information Retrieval (ISMIR2003), 26-30 October 2003 Baltimore Maryland USA. [3] P. Veltink, H. Bussmann, W. de Vries, W. Martens, and R. V. Lummel, “Detection of static and dynamic activities using uniaxial accelerometers,” IEEE Transactions on Rehabilitation Engineering, vol. 4, no. 4, pp. 375– 385, 1996. [4] T. Thielgen, F. Foerster, G. Fuchs, A. Hornig, and J. Fahrenberg, “Tremor in parkinson’s disease: 24-hr monitoring with calibrated accelerometry,” Electromyogr. clin. Neurophysiol., vol. 44, pp. 137–146, 2004. [5] B. Najafi, K. Aminian, A. Paraschiv-Ionescu, F. Loew, C. Bula, and P. Robert, “Ambulatory system for human motion analysis using a kinematic sensor: Monitoring of daily physical activity in the elderly,” IEEE Transactions on Biomedical Engineering, vol. 50, no. 6, pp. 711– 723, 2003. [6] C. Bouten, K. Koekkoek, M. Verduin, R. Kodde, and J. Janssen, “A triaxial accelerometer and portable data processing unit for the assessment of daily physical activity,” IEEE Trans Biomed Eng, vol. 44(3), pp. 136– 47, 1997.
TABLE I D ETECTION PERFORMANCE FOR EACH FEATURE SET Feature set ST F T ST F T+ ST F Tn ST F T+n CW T CW T+ CW Tn CW T+n
SEN 1 1 1 1 0.66 0.66 0.66 1
FD 16 15 20 12 26 24 5 4
PPV 0.16 0.17 0.13 0.20 0.07 0.08 0.29 0.42
the spectral powers / wavelet coefficients without using any knowledge leads to a very bad performance, with a lot of false detections (FD), and for the CWT the sensitivity (SEN) is also bad. Adding information about frequency ranges and scales slightly increases the performance. The normalized STFT and CWT perform much better. For the CWT the number of false detection goes down from 26 to 5. Combining this with the coefficient ranges, also sensitivity increases from 0.66 to 1. The STFT seems to be more susceptible for false detections. Normalization alone is not an improvement, the combination with the frequency ranges is. Belgian Day on Biomedical Engineering IEEE Benelux EMBS Symposium
4
158
December 7-8, 2006