Supplementary Information for ”New weakly expressed cell cycle regulated genes in yeast”
SI1: Synchronization and interdivision time Ulrik de Lichtenberg1 †, Rasmus Wernersson1 †, Thomas S. Jensen1 †, Henrik Bjørn Nielsen1 , Anders Fausbøll1 , Peer Schmidt2 , Flemming Bryde Hansen1 , Steen Knudsen1 and Søren Brunak1∗ †These authors contributed equally to this work 1 Center for Biological Sequence Analysis, BioCentrum, Technical University of ¨ Denmark, Building 208, DK-2800 Lyngby, Denmark. 2 febit ag, Kafertaler Strasse 190, D-68167 Mannheim, Germany ∗ Corresponding author: Tel: (+45) 45 25 24 77, Fax: (+45) 45 93 15 85, email:
[email protected]
In this supplementary information, we address the issue of cell cycle synchrony from a number of different angles and estimate the interdivision time. We find that the culture appears clearly synchronized in both the first and the second cycle and find close agreement between two independent estimates of the interdivision time.
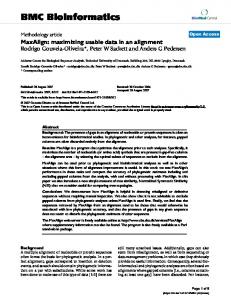
Monitoring synchrony As described in Materials and methods, the synchronized yeast culture was grown in a fermentor for 300 minutes with samples taken every 20 minutes. Synchronization was obtained through arrest-and-release of the temperature sensitive mutant strain CDC15–2 (Spellman et al., 1998; Futcher, 1999). The culture was grown to a density of OD600 = 0.8, and the temperature was raised slowly to 37◦ C over 3 hours (1.5◦ C/15min for the first 2 hours and 0.5◦ C/15min for the last hour) and kept at 37◦ C for 1 hour. At this point, phase-contrast microscopy confirmed that virtually all cells had the dumbbell shape characteristic for arrested cdc15-2 mutants (see Figure 1), described by Futcher (1999). T-20
T-40
T-60
T-120
T-140
T-160
T-180
T-80
T-100
T-200
Figure 1: Phase contrast microscopy images. Selected images, showing examples of the cell morphology at different stages during the experiment. The first small buds appeared at 40-60 min and the next generation of buds was seen at 180-200 min.
Throughout the experiment, the synchrony of the culture was monitored by phase contrast microscopy (Figure 1), and the growth rate of the culture through measurements of OD600 and CO2 efflux.
1
Estimating the interdivision time Based on the microscopy results, we counted the fractions of cells with i) No visible buds ii) small buds, size 2/3 — all sizes relative to the mother cell — at every time point. Randomly selected cells from phase contrast microscopy pictures (40x magnification) were used.
A
B
1 No visible buds Small buds Medium buds Large buds
20 Number of genes
Fraction
0.8
25
0.6
0.4
0.2
0 20
15
10
5
60
100
140 180 Time [min]
220
260
300
0 100
150 200 Interdivision time estimate [min]
250
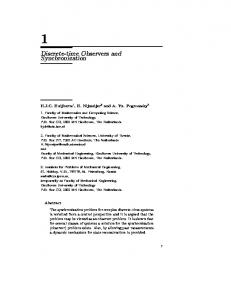
Figure 2: Estimation of interdivision time. A) Fraction of cells with i) No visible buds ii) small buds iii) medium buds and iiii) large buds (see Materials and methods). B) Histogram and smoothed distribution (gauss kernel density estimation) of optimal interdivision times for 113 known cell cycle regulated genes (Johansson et al., 2003). The distribution shows a peak at 148 minutes, in good agreement with the bud-counting estimate. The peak at the extreme end of the scale is caused by genes that do not appear periodic in this experiment.
Figure 2A summarizes the results and indicates synchrony in both cycles. The synchronization method releases cells from arrest in late M phase (Yeong et al., 2000), and we see the first buds appearing between the 40 min and 60 min time points. The culture appears clearly synchronized in the first cycle and a new generation of buds appears at 180-200 min, also indicating synchrony into the next cycle. The microscopy data thus displays an interdivision time around 140 min. However, due to the particular morphology of arrested CDC15-2 cells, distinguishing the categories becomes difficult in the second cell cycle: During the arrest, the cell wall becomes fused in the original mother/daughter cell pair, which leads to the characteristic dumbbell shape (Futcher, 1999). In the second cell cycle, the culture is a mix of the original fused cells and single cells (detached buds from the first cell cycle), making it difficult to compare the second cycle to the first. In particular, it is virtually impossible to distinguish between “no buds” and “large buds”. See Futcher (1999) for a detailed discussion of the CDC15–2 strain. Orthogonal to the interdivision time estimate based on microscopy, we used the microarray data directly to estimate the period that contained the maximum signal. A reference set of 113 genes (Johansson et al., 2003) (cell cycle regulated in small scale experiments) was used and for each of these, the period that gave the maximum Fourier score (see Materials and methods) was determined. Figure 2B shows the distribution of these “optimal periods”. A clear peak was seen at 148 min, in good agreement with the conclusion of the microscopy analysis (140 min). The second, smaller peak at the extreme of the scale (250 min) was an artifact caused by genes that (in this experiment) exhibit an almost constant, non-cyclic pattern of expression and thus correlate best with the longest possible period.
A final check for synchrony For the total set of 397 genes identified as periodic (see the main paper), the time of peak expression was estimated (see Materials and methods). This peak time is given as a fraction of the cell cycle completed, with time zero defined as the time of cell division (de Lichtenberg et al., 2005). Figure 3 relates the characteristic cell cycle phases to this timescale by showing the expression of five phase specific gene clusters defined by Spellman et al. (1998). It demonstrates that the phases occur in the correct consecutive order in this experiment, as would be expected in a synchronized cell culture. The
2
M/G1 (25)
G1 (114)
G1
M
S (17) 90%
0%
10%
80%
20%
70%
30%
60%
50%
S/G2 (26)
40%
G2/M (50)
G2
S
Figure 3: Phase specific gene clusters. A peak time was estimated for each periodic gene, describing where in the cycle the gene is maximally expressed (see Materials and methods). Time is given as a fraction of the cycle completed, with zero defined as the time of cell division. For each of the five gene clusters defined earlier by Spellman et al. (1998), we selected the genes that scored above the 20% FDR threshold in this experiment (with the number of genes in each cluster in parentheses). The circles show the smoothed distribution of peak times for these genes in each cluster. Zero time was set at the peak of the M/G1 cluster. Based on the time of expression of these five clusters, the positioning of the four characteristic phases (G1 , S, G2 and M) was estimated, as illustrated by the outermost black circle.
Figure was used to estimate the phase in which the periodic genes peak, as illustrated by the outermost black circle.
Homology All yeast Open Reading Frames (ORFs) were blasted against a set of 1134 human cloneIDs identified as periodically expressed in human HeLa cells by (Whitfield et al., 2002). CloneIDs with a e-value lower than 10−5 were considered homologs. S. pombe orthologs were provided by Valerie Wood at the Sanger Centre.
References de Lichtenberg, U., Jensen, L. J., Fausbøll, A., Jensen, T. S., Bork, P., & Brunak, S. (2005). Comparison of computational methods for the identification of cell cycle regulated genes. Bioinformatics 21(7), 1164–1171. doi:10.1093/bioinformatics/bti093. Futcher, B. (1999). Cell cycle synchronization. Methods in cell science 21(2-3), 79–86. Johansson, D., Lindgren, P., & Berglund, A. (2003). A multivariate approach applied to microarray data for identification of genes with cell cycle-coupled transcription. Bioinformatics 19(4), 467–473. Spellman, P., Sherlock, G., Zhang, M., Iyer, V., Anders, K., Eisen, M., Brown, P., Botstein, D., & Futcher, B. (1998). Comprehensive identification of cell cycle-regulated genes of the yeast S. cerevisiae by microarray hybridization. Molecular Biology of the Cell 9, 3273–3297. Whitfield, M. L., Sherlock, G., Saldanha, A. J., Murray, J. I., Ball, C. A., Alexander, K. E., Matese, J. C., Perou, C. M., Hurt, M. M., Brown, P. O., & Botstein, D. (2002). Identification of genes periodically expressed in the human cell cycle and their expression in tumors. Molecular Biology of the Cell 13, 1977–2000. Yeong, F. M., Lim, H. H., Padmashree, C. G., & Surana, U. (2000). Exit from mitosis in budding yeast: Biphasic inactivation of the cdc28-clb2 mitotic kinase and the role of cdc20. Molecular Cell 5(3), 501–511.
3