17th World Conference on Nondestructive Testing, 25-28 Oct 2008, Shanghai, China
Signal Processing for Guided Waves Testing Based on Magnetostrictive Effect Jiang XU a, Xinjun WU a, Gongtian SHEN b, Liangyun WANG a a School of Mechanical Science and Engineering Huazhong University of Science and Technology, Wuhan, 430074, P.R. China b China Special Equipment Institute and Research College, Beijing 100013 P.R. China Phone: +86 15872419550 Fax: +86 27 87559332 E-Mail:
[email protected]
Abstract: A design process for the signal processing method to the magnetostrictive guided waves testing instrument is investigated. The short time Fourier transform method is used to analyze the characteristic of the guided wave signal with a flaw in a pipe. Based on the characteristic of the signal, the software band pass filter is employed to processing the signal. The echoes of flaw show clearly in the signal by filtering. Then a hardware circuit is designed to realize the software filter. The performances of the two methods are compared. The result shows that the method based on the hardware filter can identify the flaws, locate the flaws quickly which is suitable for the real time inspection. The method based on the software filter can clearly recognize the response of the flaws which is feasible for the post-processing. Lastly, a design process for the signal processing method to the magnetostrictive guided waves testing instrument is given. Key words: magnetostritive effect, guided waves, signal processing, instrument
1. Introduction Nondestructive testing (NDT) plays an important role in manufacturing, quality control and life management to assure safety and reliability. In recent years, the technology of guided waves has been applied to NDT of pipes, wires and rails widely because the technology can inspect over long distance from a single position [1-4]. The signal processing method for guided wave technology has been studied by many researchers. D.N. Alleyne [5] applied the high pass filter circuit or the low pass filter circuit to process the signals. The short time Fourier transform (STFT) and the higher order spectra method was applied to analyze magnetostrictive generated pulse-echo signals of a steel pipe defect by Y.M. Wang [6]. C.F. He [7] applied the methods of wavelet transform and Wigner-Ville transform to the signal analysis of guided wave testing of defects in a hollow sucker rod. All the above methods are useful to process the guided wave testing signals, but they are incomplete and efficient enough to a guided waves testing instrument especially a magnetostrictive guided waves testing instrument. Comparing with the piezoelectric technology, the magnetostrictive technology generating and detecting guided waves is a non-contact method. Therefore the method doesn’t require preparation of the specimen surface and removing the coatings of the coated specimen. The magnetostrictive guided wave technology has been applied and studied by many researchers [8-9]. But the testing signal of the technology is more complicated than the piezoelectricity’s. The reason is the complexity of the magnetic fields which would bring more noise, even some modes unexpectedly. Therefore the appropriate signal processing
methods is very important for designing of the magnetostrictive guided waves testing instrument. In this paper, the experiment setup for sampling the origin signal is given firstly. Secondly, the STFT method is used to analyze the characteristic of the guided wave signal. Thirdly, the software band pass filter is employed to processing the signal based on the characteristic of the signal and a hardware circuit is designed to realize the software filter. The performances of the two methods are compared. Lastly, a design process for the signal processing method to the magnetostrictive guided waves testing instrument is given.
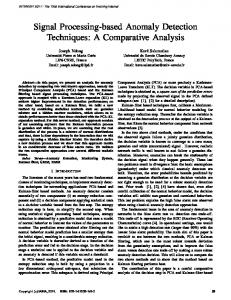
2. Experiment setup In the experiment, approximately the 3.2 m long, 38 mm outside diameter, and 5 mm wall steel pipe was used as the specimen. Figure 1 shows the dispersion curve as the group velocity and frequency relation of the pipe.
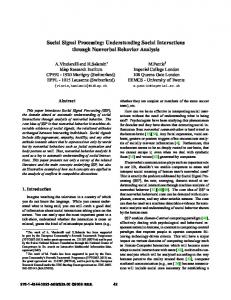
Figure 1 Group speed dispersion curve for guided waves of a pipe with 38 mm outside diameter and 28 mm inside diameter The transmitting and receiving coils were placed at approximately 120mm and 1600mm distances from the near end of the pipe respectively. The bias magnet consisted of a permanent magnet bar with a steel yoke on either end. The direction of the bias magnetic field was along the length of the pipe. A 13.9% loss of cross-sectional area was at 1000mm from the near end of the pipe. Figure 2 shows the schematic diagram of experimental setup.
Figure 2 Schematic diagram of experimental setup The transmitting coil was excited by applying a sinusoidal tone burst with 120V peak to peak amplitude with 2 cycles using a signal generator and power amplifier. To reduce the influence of dispersion, the mode which was chosen for excitation in the testing is the axially symmetric L(0,2) mode at about 120kHz. The voltage induced in the receiving coil was amplified (by approximately 66 dB). The signals were subsequently digitized using an A/D card which work at 2MS/s sample rate. The signals were synchronization acquired with duration of 10 ms which began at the pulse generated in the coil. The data were then stored in a personal computer. To reduce the effect of white noises, the repeated times of each experiment were 300 times. The origin signal obtained using the experiment setup is shown in Figure 3.
0.2
Initial pulse First passing signal
0.15
End reflected signal
Amplitude(V)
0.1 0.05 0 -0.05 -0.1 -0.15 -0.2 -0.25 0
1
2
3
4
5
Time(ms)
Figure 3 Origin signal taken from the steel pipe
Figure 4 Spectrogram of the origin signal
3. Analysis of origin signal Detection of flaws includes many factors, which influence the transmitted guided wave signal in the specimen under testing. The theory of elastic wave propagation in the elastic materials shows that the parameters of the reflected signal depend on induced signal frequency and bandwidth, structure of the specimen, position and shape of defects, material properties. To a given specimen, the induced signal frequency and bandwidth is the one factor which could be controlled. The signal obtained in a guided wave testing system is generally nonstationary and difficult to be analyzed due to frequency dependent scattering, attenuation and dispersion. Since the time-frequency analysis of a signal can provide its detailed time information at a concerned frequency and a detailed frequency distribution at any periods of time, it should be an appropriate tool for analyzing guided wave signal. A lot of results about the application of time-frequency analysis to guided wave nondestructive testing have been reported in recent years [6][7]. These studies indicated that it was possible to obtain frequency dependent characteristics in a time-frequency plane rather than only in a time domain or in a frequency domain, and these characteristics could be applied to detect the flaws of the specimen. A lot of time-frequency analysis methods have been developed and improved. Although the behavior of these methods is quite different and each has peculiar properties, STFT is one of the elementary methods. The STFT of a signal x(t) is defined as: ∞
STFT (t , f ) = ∫ x (τ )ω * (τ − t )e − 2 jπfτ dτ
(1)
−∞
where t is time, ω is a selected window function used for observing the signal’s local spectrum by translating it along time, τ is time lag, and * represents complex conjugate. The Spectrogram S(t,f) of x(t) is
S (t , f ) = STFT (t , f ) = 2
∫
∞
−∞
x(τ )ω (τ − t )e *
− 2 jπf τ
dτ
2
(2)
There are many windowed functions in actual application, such as the rectangular window, the triangle window, the Hanning window, the Gauss window, the Kaiser window and so on. In order to reveal the characteristic of the signal, the Kaiser window is selected to the spectrogram transform. Because The Kaiser window function is unique in that its shape is variable. A variable parameter defines the shape, so the Kaiser window is unique in being able to match precisely the attenuation you require without over
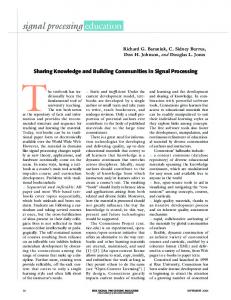
performing. The length of window is a very important parameter to the transform of spectrogram, because the suitable length can provide good characteristics of assemble in the time domain and the frequency domain at the same time. If it is overlong, the unstable information will add to the flaw information which is unexpected. If it is shorter, the useful information of flaw will lost which will influence the result strongly. The computable speed of the spectrogram transform is also considered. The length 512 is selected to be the length of the spectrogram transform. Figure 4 plots the contour of STFT for the actually obtained echoes given in Figure 3. The magnitude of the signal at each point in frequency and time is represented by the color scale. Red represents the maximum amplitude and blue the minimum. The dispersive characteristic of L(0,1) and L(0,2) is revealed by the curves in the time-frequency domain which is accordance with the group speed dispersion curve as shown in Figure 1. Figure 4 clearly shows that the energy of the passing signal and end reflected signals is very strong which reach the excitation frequency 120 KHz (even 150 KHz). There is a weak energy between the passing signal and the first end reflected signal which is at about 0.55~0.60ms (Wave speed is about 5000m/s). In contrast with the schematic diagram of experimental setup, the weak energy represents the response of the flaw. The characteristic of the guided wave signal is that frequency components of the defect echo correspond with the passing signal or end reflected signals.
4. Signal processing using band pass filter For detection of defects various signal processing techniques are already used. Based on the characteristic of the signal and the requirement of the instrument, the simple signal processing methods are selected which available in many conventional ultrasonic testing.
4.1 Band pass software filter The band pass software filter is based on the Matlab signal processing toolbox. The flat frequency response in the pass band is required to ensure that the information of flaws should be reserved after processing. The Butterworth filter is selected because it is designed to have a frequency response which is as flat as mathematically possible in the pass band. The 8th order Butterworth band pass filter with a center frequency of 120 KHz, a 20 KHz wide 3 dB pass band, and a stop band attenuation of 40 dB for frequencies below 100 KHz and above 140 KHz is designed. The signal after filtering is shown in Figure 5.
Figure 5 the signal filtered by the band pass software filter
The passing signal and the end reflected signals are shown in Figure 5. The flaw signal is also shown at about 0.58ms in the figure which accords with the flaw position and the setting of sensors. The signal to noise ratio increases obviously after filtering and the phenomenon of dispersion is weakened. But the software filter method is slower than the hardware which could realize the real time signal processing.
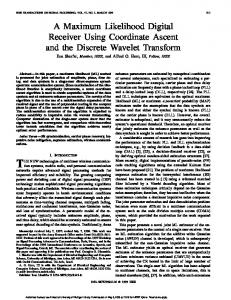
4.2 Band pass hardware filter The band pass hardware filter is based on max274 which is an 8th order continuous time active filter. A hardware band pass filter which is same as above filter is designed by the Maxim filter design software. The signal after filtering is shown in Figure 6.
Figure 6 the signal filtered by the band pass hardware filter As shown in Figure 6, the flaw signal is very clear which could distinguish from the signal easily. The position of the flaw is same as the signal after software filtering. The band pass hardware filter can realize not only the flaw detection but also the real time signal processing.
5. Conclusions A design process for the signal processing method to the magnetostrictive guided waves testing instrument is investigated. The steps for designing the signal processing method are given below: Step 1: Analyze the characteristic of the guided wave signal by STFT, acquire the characteristic of the signal. Step 2: Based on the characteristic of the signal, design a software signal processing method for the post-processing. Step 3: Design a hardware circuit is designed to realize the software signal processing method for the real time inspection. Undoubtedly there are many other signal processing methods which could be applied to process the signals. Here the only a simple method for the magnetostrictive guided waves testing instrument is given. To be a complete instrument, there are many other works need to be done in the next step.
Acknowledgements The authors gratefully acknowledge the financial support from National Key Technology R & D Program of China (No. 2006BAK02B03-S-01), the National High Technology Research and Development Program of China (863 Program) (No. 2006AA04Z435), and the Key Laboratory of Nondestructive Test (Ministry of Education of China).
References 1.
J.L. Rose, A baseline and vision of ultrasonic guided wave inspection potential, Journal of Pressure Vessel Technology Transactions of the ASME, 124 (3), 2002, P273-282.
2.
P. Cawley, M.J.S. Lowe, D.N. Alleyne, B. Pavlakovic, P. Wilcox, Practical long range guided wave testing: Applications to pipes and rail, Materials Evaluation, 61 (1), 2003, P66-74.
3.
H. Kwun, S.Y. Kim, G.M. Light, The magnetostrictive sensor technology for long range guided wave testing and monitoring of structures, Materials Evaluation, 61, (1), 2003, P80-84.
4.
J. Qu, L.J. Jacobs, Guided circumferential waves and their applications in characterizing cracks in annular components, Materials Evaluation, 61, (1), 2003, P85-93.
5.
D.N. Alleyne, P. Cawley, Long range propagation of lamb waves in chemical plant pipe work. Materials Evaluation, 55, (4), 1997, P504-508.
6.
Y.M. Wang, Y.H. Kang, X.J. Wu, Application of STFT and HOS to analyse magnetostrictively generated pulse-echo signals of a steel pipe defect, NDT and E International, 39, (4), 2006, P289-292.
7.
C.F. He , Y. LI, X.Y. Wang , B. Wu, L.T. Li, Ultrasonic guided wave signal analysis based on wavelet and Wigner-Ville transform processing, Journal of Experimental Mechanics, 20, (4), 2005, P584-588. (In Chinese)
8.
H. Kwun, G.M. Light, S.Y. Kim, R.L. Spinks, Magnetostrictive sensor for active health monitoring in structures, Proceedings of SPIE - The International Society for Optical Engineering, 2002, P282-288.
9.
H. Lee, Y.Y. Kim, Wave selection using a magnetomechanical sensor in a solid cylinder, Journal of the Acoustical Society of America, 112, (3), 2002, P953-960.